


Services on Demand
Article
 English (pdf)
 Article in xml format
 Article references
Indicators

Related links
-
 Cited by Google
 -
 Similars in Google
Share

 Permalink
South African Journal of Science
On-line version ISSN 1996-7489
Print version ISSN 0038-2353
S. Afr. j. sci. vol.114 n.7-8 Pretoria Jul./Aug. 2018
http://dx.doi.org/10.17159/sajs.2018/20170391
RESEARCH ARTICLE
Spatial distribution of temporal precipitation contrasts in South Africa
Christina M. BotaiI; Joel O. BotaiI, II; Abiodun M. AdeolaI
ISouth African Weather Service, Pretoria, South Africa
IIDepartment of Geography, Geoinformatics and Meteorology, University of Pretoria, Pretoria, South Africa
ABSTRACT
The focus of the present study was to investigate the spatial-temporal variability and trends of precipitation concentration across South Africa using the Tropical Rainfall Measuring Mission (TRMM) 3B42 version 7 satellite precipitation data sets spanning 1998-2015. In the analysis, the precipitation concentration index (PCI) was used to infer the variability of temporal precipitation contrasts and the spatial distributions at annual, seasonal and supra-seasonal timescales. The results indicate that precipitation concentration across South Africa exhibits noticeable spatial-temporal variability. In terms of PCI classification criteria, the precipitation distribution ranges from relatively uniform (mainly in the central and southern interior of South Africa) to highly irregular (especially to the northeastern and western parts of South Africa) at annual timescales. At seasonal timescales, the precipitation distribution is uniform during December-February season, moderate during March-May and September-November seasons while during the June-August season, the precipitation distribution is highly irregular. Furthermore, during the 1998-2015 period, there exists a spatial and temporal pattern of PCI trends which are generally statistically insignificant. The PCI analysis results reported in this study are essential because they provide valuable information on the long-term total variability in the precipitation records across South Africa. In particular, this study contributes towards evaluating the spatial contrasts or concentration of the different accumulated amounts of the received precipitation. Results from this study have important scientific and practical applications in hydrological hazard risks (floods and droughts) and soil erosion monitoring.
SIGNIFICANCE:
• Precipitation concentration exhibits spatial-temporal variability.
• At an annual timescale, precipitation concentration is highly irregular in most parts of the country.
• Precipitation concentration distribution varies across seasons.
Keywords: precipitation concentration index; spatial-temporal variation; rainfall intensity; trends analysis; rainfall variability
Introduction
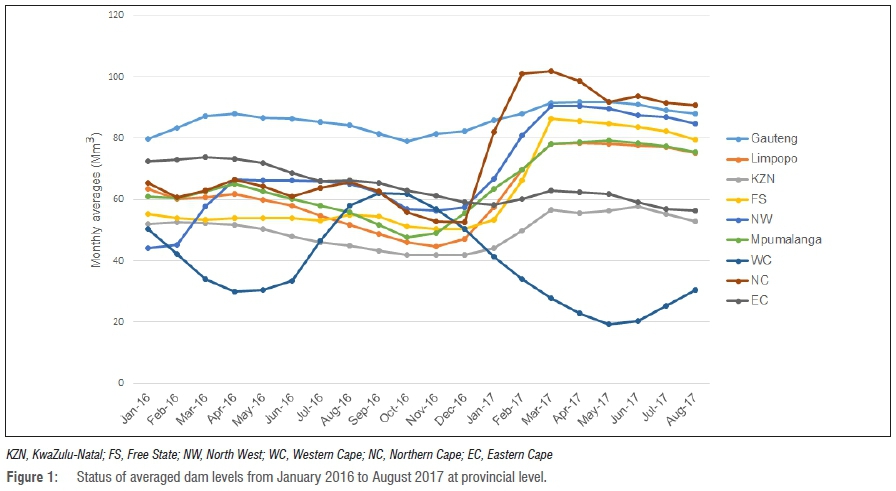
There is an increasing global consensus that climate change and variability is a reality, as manifested both in terms of the varying climatic variable mean and extremes. A number of scientific publications from diverse fields point to this eventuality.1-4 The implication of the changing climate has elicited great concern in individuals and societies in general as well as in various sectors (e.g. agriculture, water, energy and health) directly or indirectly affected by the impacts of climate change. In South Africa, the imminent implication of climate change is for instance the strain imposed on water resources as a result of prolonged dry spells. This unfortunate situation of limited water supply reverberates across South Africa currently (e.g. 2016/2017 hydrological year), as manifested in the significant drop of dam levels, see for example Figure 1. In addition, changes in precipitation patterns are contributing to the on-going drought experienced in various provinces, with five of the provinces officially declared as drought disaster regions. This hydrological drought has serious socio-economic consequences, including threats to the nation's food security, health and economy.
Because of the dire consequences imposed by climate change, understanding processes that relate to this change can be vital for climate-related preparedness measures, which thereby enhance economic growth sustainability, including planning for agriculture, water resources management and planning, economic planning and health. As precipitation is one of the essential variables associated with climate change, the changing patterns and trends of this climatic variable require proper and systematic attention within the topic of climate change.
South Africa, which is considered a semi-arid country, is characterised by highly variable diurnal5, intra-seasonal6,7 as well annual timescales8. These variations are reported to be intensifying (i.e. becoming more variable) over time (see for example studies by Hewitson and Crane9, Engelbrecht et al.10, Shongwe et al.11, Pohl et al.12 and references therein). This inherent variability characterises the country's annual rainfall distribution patterns, concentration and intensity. Furthermore, rainfall variability in southern Africa has also been linked to variations in teleconnection patterns such as the El Niño Southern Oscillation (ENSO).6 Understanding precipitation characteristics (e.g. patterns, variability, intensity and concentration) forms part of preparedness and mitigation measures that can be put in place to reduce the impacts of weather and climate extreme events. In particular, an in-depth analysis of precipitation at sub-regional level is important as the results can be used to quantify spatial and temporal variation of precipitation concentration and distribution patterns in the region.
The precipitation concentration index (PCI) has been proposed as an indicator to assess spatial and temporal distributions as well as concentration of precipitation.13,14 The PCI has the ability to provide valuable information on long-term total variability in the amount of rainfall received.15,16 Research studies on PCI include the computation of PCI to evaluate the statistical structure of precipitation rates for Pearl River Basin situated in Southern China.14 In addition, Martin-Vide17 calculated PCI values with the aim of assessing the spatial patterns of rainfall in Peninsular, Spain. Li et al.18 estimated the PCI values for the Kaidu River Basin and assessed the spatial and temporal variability of the statistical structures of precipitation across Xinjiang, China. De Luis et al.19 made an analysis of the PCI using a monthly precipitation database of Spain. Valli et al.20 computed PCI values at annual and seasonal scale and analysed the patterns of rainfall in agro-climatic zones of Andhra Pradesh, India. Iskander et al.21 calculated PCI values and Simple Daily Intensity Index (SDII) and investigated trends and variability of annual precipitation total and annual number of rainy days in 34 stations distributed over Bangladesh. Gocic et al.22 computed PCI values using monthly precipitation data sets from 29 stations in Serbia and analysed spatial variability of monthly precipitation and long-term total variability in the precipitation series. In addition, Gocic et al.22 used three support vector machine (SVM) models coupled with the discrete wavelet transform, the SVM firefly algorithm and the SVM radial basis function to estimate and predict PCIs in Serbia.
It is apparent from the literature that analysis studies on PCI have been undertaken in various countries and regions in the past decades. Most of the reported studies, however, were conducted in India, China, Bangladesh and Spain. In South Africa, a number of studies have been carried out on precipitation patterns (e.g. Kruger23, New et al.24, Kruger and Sekele25, MacKellar et al.26, Botai et al.27 and references therein), yet characterising the variability of precipitation using the PCI has never been done. The aim of the present study was to analyse the spatial-temporal variability of PCI across South Africa using the Tropical Rainfall Measuring Mission (TRMM) daily 3B42 satellite derived data sets. In this regard, the PCI analysis calculated at annual, supra-annual and seasonal timescales is used to characterise the precipitation contrasts across South Africa over the period 1998-2015. This study provides valuable scientific and practical insights on the overall patterns of spatial-temporal contrasts of accumulated rainfall relevant for agricultural planning and water resources management.
Study area
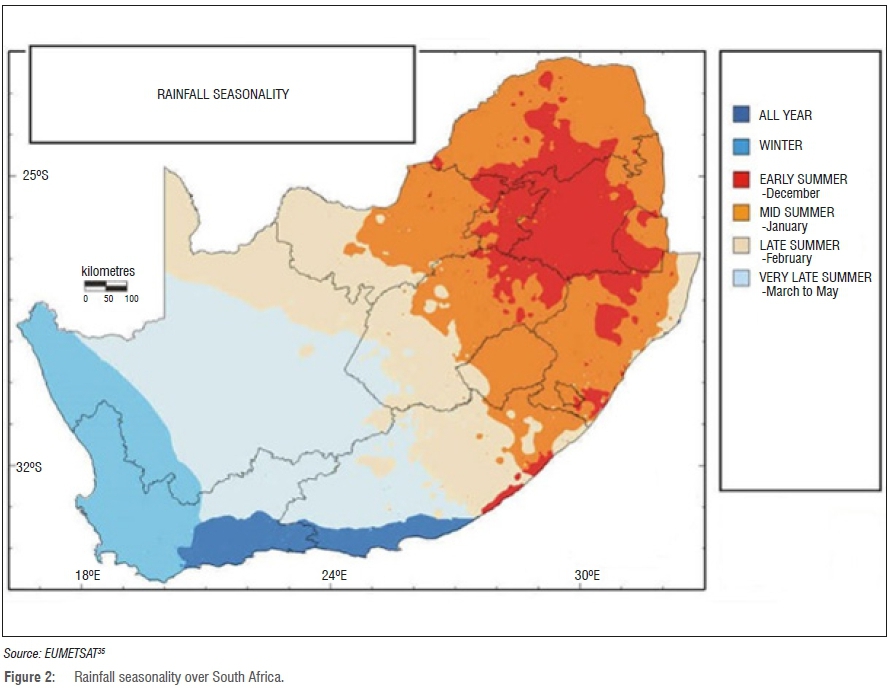
South Africa is known to be a semi-arid to arid country, and is particularly characterised by a highly variable climate with constrained water resources as a result of weather extremes enforced by climate change and variability. The country's climate conditions range from the Mediterranean in the southwestern corner of the country to temperate in the interior plateau and subtropical in the northwestern region. South Africa's average annual rainfall is about 450 mm/year, which is below the world's 860 mm average per year. South Africa is conventionally characterised by four main seasons, i.e. summer (December-January-February (DJF)), autumn (March-April-May (MAM)), winter (June-July-August (JJA)) and spring (September-October-November (SON)). Rainfall in South Africa exhibits seasonal variability, with most of the rainfall occurring mainly during summer months; see for example Figure 2. However, in the southwestern region of the country, rainfall occurs mostly in winter months. South Africa experiences rainfall that varies significantly from west to east. Annual rainfall in the northwestern region often remains below 200 mm, whereas much of the eastern Highveld receives between 500 mm and 900 mm (occasionally exceeding 2000 mm) of rainfall per annum. The central part of the country receives about 400 mm of rain per annum, with wide variations occurring closer to the coast.
Data
We utilised the Tropical Rainfall Measuring Mission (TRMM) Multi-satellite Precipitation Analysis (TMPA) daily 3B42 precipitation products covering the period from 1 January 1998 to 1 November 2015. These products cover the 50°S to 50°N latitude belt at a spatial resolution of 0.25° × 0.25°.28 The TRMM data sets are freely available from http://disc.gsfc.nasa.gov/uui/datasets. They were retrieved from the TRMM calibrated-based multiple satellite microwave and infrared measurements using the TMPA algorithm reported by Chiu et al.29 In particular, the TMPA algorithm involves four stages and can be summarised as follows: (1) calibrating and combining the microwave precipitation estimates; (2) creating infrared precipitation estimates using the calibrated microwave precipitation; (3) combining the microwave and infrared estimates; and (4) incorporating rain gauge data. Overall, the TRMM products provide a significant opportunity to monitor precipitation over tropical and sub-tropical regions wherein the TRMM Microwave Imager becomes reliable and useful.30,31
Methodology
In this study, PCI was calculated and used to assess rainfall concentration in South Africa for the period 1998-2015. The PCI values were calculated on three different timescales, namely annual, seasonal and supra-seasonal. At annual timescale, the PCI values were calculated according to Equation 1 as described in Oliver13 as well as in Zhang and Qian32.
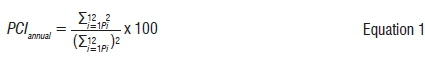
In Equation 1, Pi corresponds to the amount of precipitation of the ith month. In this way, the PCI values were calculated for each year at each gridded point to detect the temporal variation of the index. The computed annual PCI can then be used to indicate the monthly variation in the distribution of precipitation on an annual basis. At seasonal timescale (i.e. DJF, MAM, JJA and SON), the PCI values were calculated based on Equation 2:

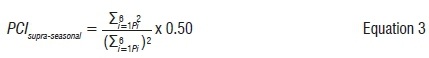
Similarly, at supra-seasonal timescales (e.g. the wet season represented by October to March months and the dry season from April to September months), the PCI values were calculated according to Equation 3:
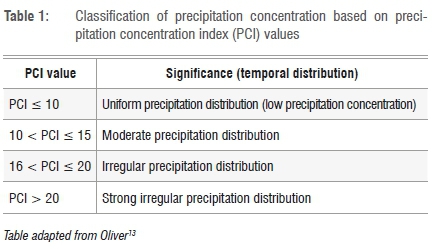
According to Oliver's classification, PCI values can be classified as ranging from uniform precipitation distribution to a strong irregular distribution; see a summary of this classification in Table 1.
This classification was also adopted in this study in order to assess changes of statistical parameters of PCI (including the median, mean, coefficient of variation (CV), standard deviation (std), trends and significant trends) with the aim of understanding the rainfall distribution and concentration in the period from 1998 to 2015. All the statistical moments generated in the analysis were rasterised and plotted using the level-plot graphics function of the Lattice package in R, the statistical computing and graphics software.
Results
Spatial characteristics of annual PCI
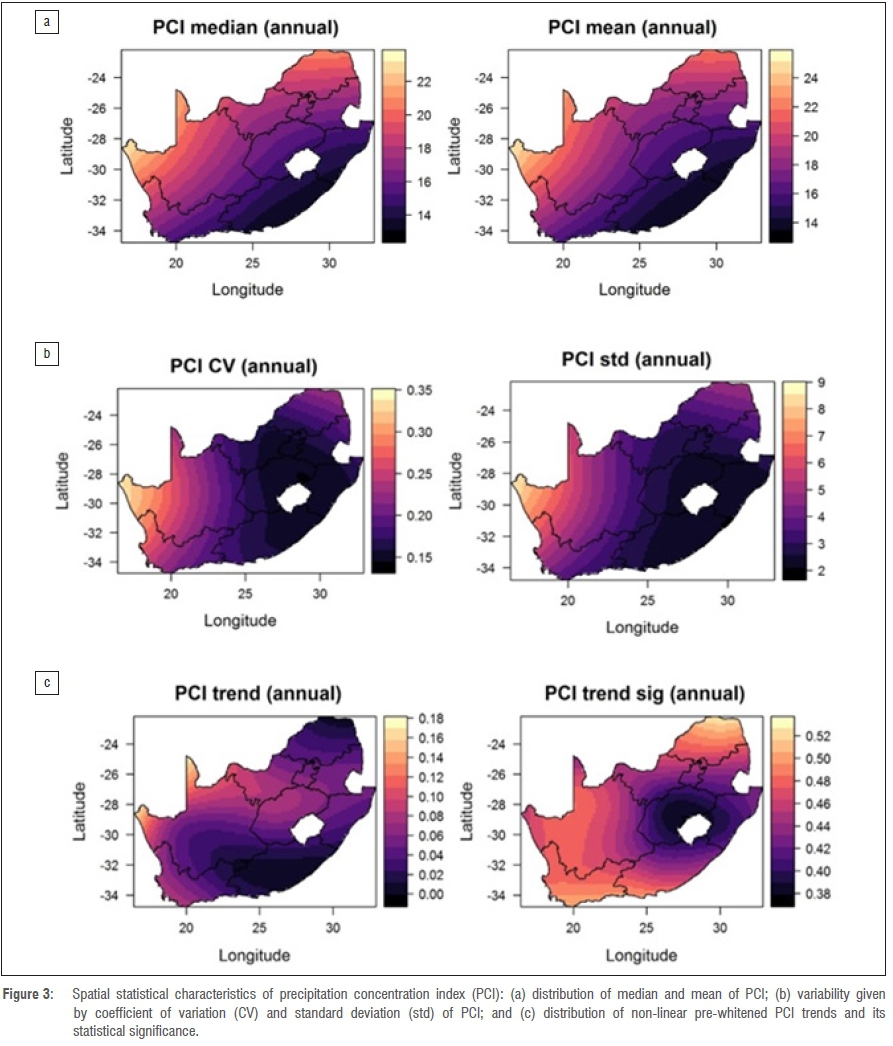
The spatial variability of the annual PCI statistics between 1998 and 2015 are presented in Figure 3. It is noted that the precipitation distribution is largely moderate (i.e. 11 ≤ PCI {mean/median} ≤ 15) along the east coastal regions of the country, covering parts of the Eastern Cape and KwaZulu-Natal (KZN) Provinces. The central and the eastern parts of the country depict PCI values ranging between 14 and 16 while the north, west and southern regions depict higher PCI values, with some areas reaching 25. These areas are therefore characterised by irregular to high precipitation distribution over a year. Overall, the pattern of the annual PCI values delineates South Africa into three major regions: moderate, irregular and high rainfall distribution regions. Based on the coefficient of variation and the standard deviation results, the PCI is highly variable towards the west and southwestern regions of the country, covering the Northern Cape and Western Cape Provinces, and less variable over the northern regions of the country (e.g. Limpopo Province). The central interior region and parts of the eastern region of the country (i.e. Free State, KZN, Gauteng as well as some parts of the North West and Eastern Cape Provinces) depict lower PCI variability. During the period 1998 to 2015, South Africa exhibited positive, statistically insignificant PCI trends (less than 0.2 mm/year). According to Theil33, PCI trends are considered significant if the estimated p-value falls below a critical value (e.g. α<0.05), indicating 95% confidence. Furthermore, negative trends are also observed in small regions of the Eastern Cape and Limpopo Provinces (see Figure 3c). These results corroborate the precipitation trends reported in Kruger and Nxumalo34 for example.
Spatial characteristics of seasonal PCI
Results for seasonal PCI calculations are depicted in Figure 4. During the summer season, lower PCI values (≤ 10) are evident in the interior region (e.g. the Free State and parts of the North West) and towards the eastern part of the country, covering the Eastern Cape and KZN Provinces. Based on the PCI classification criteria, these regions are characterised by lower precipitation distribution at seasonal timescales. However, the PCI values increase towards the southwestern regions of South Africa, covering the Northern Cape and Western Cape Provinces. During the summer season, precipitation in these regions exhibits moderate to high seasonal precipitation distribution. The PCI values during autumn are low along the east coast while high in the north, west and southwestern regions, implying low precipitation and moderate to irregular precipitation distribution, respectively. Precipitation in winter is generally more spatially regularly distributed, with higher PCI values (up to 16) are observed in the central region of the country.
During the spring season, parts of the Western Cape, Eastern Cape and KZN Provinces exhibit largely low precipitation distribution while the central interior regions (including the Free State, Gauteng and Northern Cape Provinces) exhibit mostly moderate precipitation distribution.
Figure 5 depicts the spatial distribution of variability of PCI values. From Figure 5, the PCI values in summer are less variable in the central interior, while highly variable in the western areas of South Africa (e.g. large areas of the Northern Cape and Western Cape Provinces). During autumn, there is high variability in the precipitation distribution patterns in the Western Cape, Northern Cape, North West, parts of the Free State and Limpopo Provinces. On the other hand, low variability in precipitation distribution patterns is evident in large parts of KZN and the Eastern Cape. Similar spatial variability patterns were exhibited in winter and spring. From Figure 5, it can also be observed that the degree of JJA PCI variability is relatively twice that of SON PCI variability. During the winter season, the Northern Cape, North West and some parts of the Free State and Limpopo Provinces exhibit a higher degree of PCI spread from the mean. This variability is in contrast to the inherent spread in the PCI values in some southern parts of the Western Cape and the southwestern parts of the Eastern Cape Provinces. It can be concluded that, during the 1998-2015 period, the degree of PCI variability exhibited a noticeable seasonal dependence.
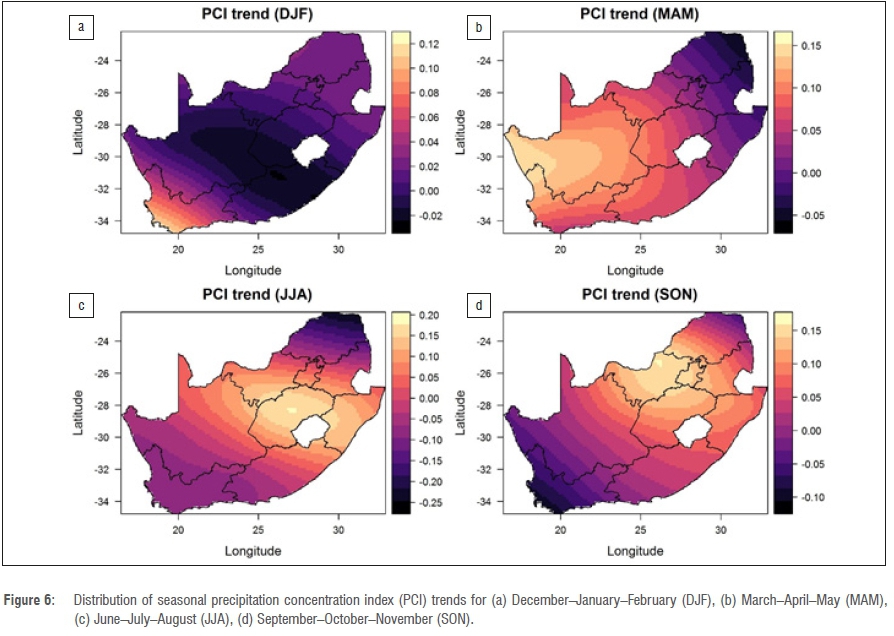
Figure 6 illustrates the seasonal PCI trends during the period of study. As shown in Figure 6, the central interior parts of South Africa, including some parts of the Northern Cape, Eastern Cape and Free State Provinces exhibit negative PCI trends while the rest of the country depicts positive trends, albeit statistically insignificant during DJF. During MAM and JJA, the vast majority of South Africa exhibits statistically insignificant positive trends while limited northeastern parts of Limpopo and Mpumalanga exhibit negative trends. In contrast, some parts of the Western Cape Province depict statistically insignificant negative trends while the rest of South Africa depicts positive (yet statistically insignificant) trends during SON.
Spatial characteristics of supra-seasonal PCI
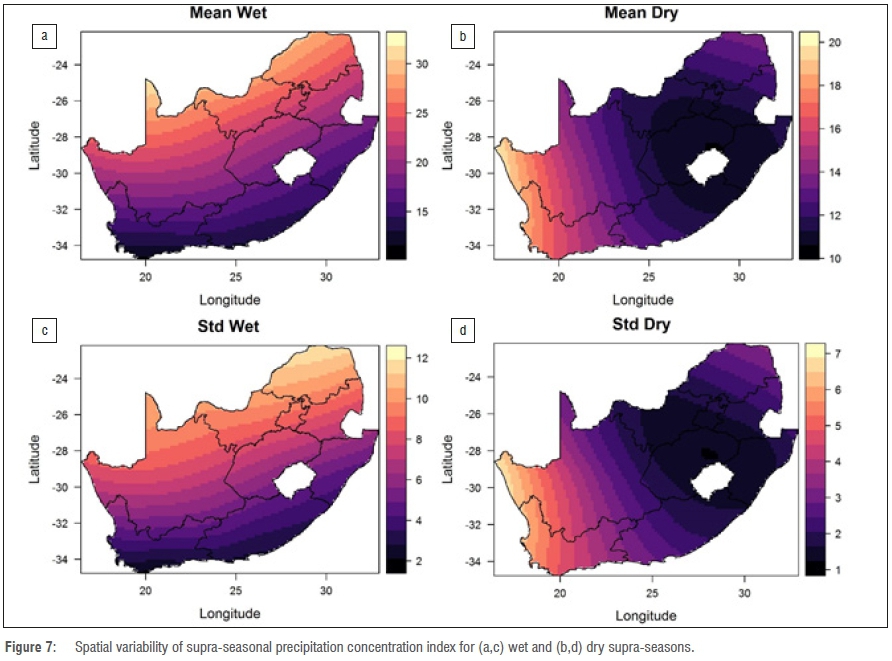
Figure 7 depicts the PCI mean and standard deviation values during the generally wet and dry months across South Africa. During the wet months (see left upper panel in Figure 7), the PCI values exhibit an increasing southwest to northeast gradient. In addition, the precipitation distribution varies from irregular to highly distributed, from the south to the northern parts of the country. In particular, the coastal regions generally exhibit low PCI values. The standard deviation exhibits similar spatial pattern of precipitation distribution, as shown on the left lower panel of Figure 7. During the dry months (right upper panel in Figure 7), low to moderate precipitation distribution is evident mostly in KZN, the Free State and some parts of the North West, Gauteng and Mpumalanga Provinces. On the other hand, irregular precipitation distribution is observed in the Northern Cape and Western Cape Provinces. The spread of the PCI from the PCI mean exhibits similar spatial distribution patterns to those of the precipitation distribution during the wet and dry months.
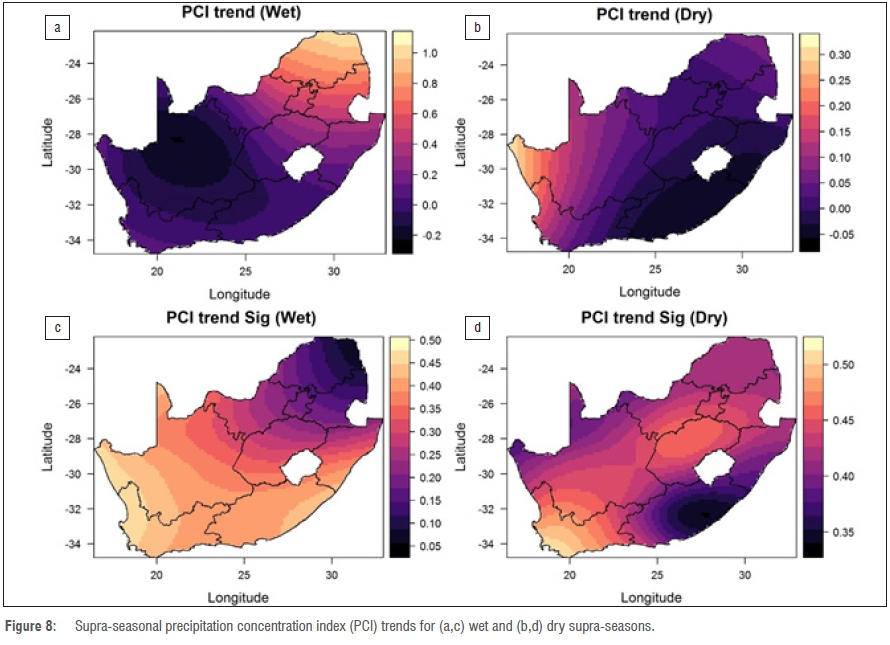
Trends in PCI values during the wet and dry months are depicted in Figure 8. As depicted in Figure 8, statistically insignificant negative (see left lower panel) trends are observed during the generally wet months, mostly in the Northern Cape Province whereas noticeable statistically insignificant positive trends are observed in Limpopo, Mpumalanga, Gauteng, KZN, and some parts of the North West and Free State Provinces. Furthermore, the dry period exhibits statistically insignificant negative trends (see right lower panel) mainly in the Eastern Cape as well as some parts of KZN while the Northern Cape and Western Cape Provinces exhibit statistically insignificant positive trends.
Discussion
South Africa is one of the countries in Africa that receives less precipitation annually. Viewed as a water-stressed country, South Africa receives an average annual rainfall of less than 500 mm. Rainfall in South Africa is highly unpredictable and sporadic in most regions, with the intensity, frequency, duration and distribution always being a concern, particularly to farmers and water resources managers. Various regions in South Africa are currently experiencing prolonged drought duration events that are crippling water resources and also impacting on other sectors such as agriculture.36-38 In particular, five of the nine South African provinces (i.e. the Western Cape, Free State, North West, KZN and Limpopo) are currently declared as drought disaster areas. The rainfall anomalies, particularly in these drought disaster provinces, have caused undesirable effects on crop production and have stressed water resources, which threaten the food security, health and economy of South Africa.36
The spatial distribution of seasonal and annual PCI values calculated in this study indicates that the vast majority of South Africa received contrasting precipitation (i.e. low to moderate distribution patterns) in the last two decades. Because poor-resourced farmers depend on rainfall for their crop and livestock production, the spatial-temporal distribution of PCI across South Africa suggests unfavourable conditions for their agriculture production. Given that rainfall is a vital climatic factor influencing crop growth, less concentrated rainfall has adverse effects on agricultural productivity.39,40 In addition, rainfall is the main component that feeds water to most water reservoirs in South Africa. Therefore, inadequate rainfall will have a significant impact on water resources and water supply to the South African community. For example, drought attributed to low rainfall in the Western Cape Province has resulted in significant water level reduction in most dams in the province.38 In addition, the Vaal Dam, which supplies water to approximately 25 million citizens, reached its lowest level during the 2015/2016 hydrological year, although summer rainfall has since improved the situation. Furthermore, changes in precipitation distribution, intensity and concentration may lead to soil erosion (gully erosion is dominant in the Northern Cape and Eastern Cape while sheet and rill erosion mostly occur in the eastern parts of South Africa), desertification and forest fires. As reported in Van Dijk et al.41, for example, high concentration and intensity of rainfall attributed to heavy storms may cause greater soil loss through increased soil particle detachment. In addition, high-intensity rainfall often causes higher rates of infiltration, excess run-off and greater transport of eroded sediments.42,43 These impacts are mostly unfavourable to agriculture and water sectors in South Africa.
Conclusions
We investigated the spatial-temporal distribution of precipitation concentration in South Africa for the period 1998-2015. The TRMM 3B42 version 7 satellite precipitation data sets were used to calculate PCI values at three timescales (i.e. annual, seasonal and supra-seasonal). Based on the results, precipitation concentration across South Africa exhibits noticeable spatial-temporal contrasts. The spatial variability of PCI values manifests as transition zones of the precipitation concentration that are in most cases aligned to the three climatological zones of the region. At annual timescales, the PCI values illustrate that the precipitation distribution ranges from relatively uniform (mainly in the central and southern interior) to highly irregular (especially to the north-eastern and western parts of South Africa). At seasonal timescales, the precipitation distribution is uniform during DJF, moderate during MAM and SON and highly irregular in JJA. Between 1998 and 2015, the annual PCIs across South Africa exhibit positive (but statistically insignificant) trends. Furthermore, during the SON season, large parts of South Africa exhibit generally negative PCI trends while during the MAM and JJA seasons, the PCI trends are generally positive. During the wet season, precipitation distribution is highly irregular across the Limpopo, Gauteng, North West and Northern Cape Provinces. On the other hand, the dry season exhibits largely moderate to low precipitation concentration over large parts of South Africa except for some parts of the western regions of the Northern Cape and northern regions of the Western Cape which depict irregular precipitation concentration. The PCI trends during the wet season are largely positive in the eastern and southwestern parts of South Africa while the interior parts exhibit negative PCI trends. The observed spatial pattern of PCI trends transition zones during the wet season mimic the climatological zones of South Africa, i.e. positive PCI trends correspond to the Mediterranean and sub-tropical climatic zones while the interior tropical climatological zone is characterised by negative PCI trends. Overall, given that precipitation concentration is an index of rainfall variability, water availability and rainfall erosivity, our results have practical applications in water resource planning and management as well as disaster preparedness. In addition, the spatial contrasts of PCI could provide information on water variability for the relevant government agencies. The implications of such observed change have strong influence on the natural processes of soil erosion, flooding, fluvial regimes and groundwater recharge and, therefore, serve as a warning tool for flooding and erosion within, for example, urban and peri-urban communities that are prone to these hydrological processes.
Acknowledgements
We thank the anonymous reviewers for their constructive and detailed comments that assisted in improving the quality of the manuscript.
Author's contributions
C.M.B. conceptualised the research study and wrote the manuscript. J.O.B. was responsible for writing scripts to analyse the data and edited the manuscript. A.M.A. edited the manuscript.
References
1. Meehl GA, Washington WM, Santer BD, Collins WD, Arblaster JM, Hu A, et al. Climate change projections for the twenty-first century and climate change commitment in the CCSM3. J Clim. 2006;19:2597-2616. https://doi.org/10.1175/JCLI3746.1 [ Links ]
2. IPCC, WGI. Climate change 2007: The physical science basis: Contribution of Working Group I to the Fourth Assessment Report of the Intergovernmental Panel on Climate Change. In: IPCC fourth assessment report. Geneva: IPCC; 2007. [ Links ]
3. Mora C, Frazier AG, Longman RJ, Dacks RS, Walton MM, Tong EJ, et al. The projected timing of climate departure from recent variability. Nature. 2013;502:183-195. https://doi.org/10.1038/nature12540 [ Links ]
4. Rouault M, Roy SS, Balling Jr RC. The diurnal cycle of rainfall in South Africa in the austral summer. Int J Climatol. 2013;33:770-777. https://doi.org/10.1002/joc.3451 [ Links ]
5. Roy SS, Rouault M. Spatial patterns of seasonal scale trends in extreme hourly precipitation in South Africa. Appl Geogr. 2013;39:151-157. https://doi.org/10.1016/j.apgeog.2012.11.022 [ Links ]
6. Pohl B, Fauchereau N, Reason CJC, Rouault M. Relationships between the Antarctic Oscillation, the Madden-Julian Oscillation, and ENSO, and consequences for rainfall analysis. J Clim. 2009;23:238-254. https://doi.org/10.1175/2009JCLI2443.1 [ Links ]
7. Liebmann B, Blade I, Kiladis GN, Carvalho LMV, Senay GB, Allured D, et al. Seasonality of African precipitation from 1996 to 2009. J Clim. 2012;25:4304-4322. https://doi.org/10.1175/JCLI-D-11-00157.1 [ Links ]
8. Pohl B, Rouault M, Roy SS. Simulation of the annual and diurnal cycles of rainfall over South Africa by a regional climate model. Clim Dyn. 2014;43:2207-2226. https://doi.org/10.1007/s00382-013-2046-8 [ Links ]
9. Hewitson BC, Crane RG. Consensus between GCM climate change projections with empirical downscaling. Int J Clim. 2006;26:1315-1337. https://doi.org/10.1002/joc.1314 [ Links ]
10. Engelbrecht FA, McGregor JL, Engelbrecht CJ. Dynamics of the Conformal-Cubic Atmospheric Model projected climate-change signal over southern Africa. Int J Climatol. 2009;29:1013-1033. https://doi.org/10.1002/joc.1742 [ Links ]
11. Shongwe ME, Van Oldenborgh GJ, Van Den Hurk BJJ. Projected changes in mean and extreme precipitation in Africa under global warming. Part I: Southern Africa. Amer Meteor Soc. 2009;22:3819-3837. https://doi.org/10.1175/2009JCLI2317.1 [ Links ]
12. Pohl B, Macron C, Monerie P-A. Fewer rainy days and more extreme rainfall by the end of the century in southern Africa. Sci Rep. 2017;7(46466):1-7. https://doi.org/10.1038/srep46466 [ Links ]
13. Oliver JE. Monthly precipitation distribution: A comparative index. Prof Geogr. 1980;32:300-309. https://doi.org/10.1111/j.0033-0124.1980.00300.x [ Links ]
14. Zhang Q, Xu CY, Marco G, Chen YP, Liu CL. Changing properties of precipitation concentration in the Pearl River Basin, China. Stoc Environ Res Risk Assess. 2009;23:377-385. https://doi.org/10.1007/s00477-008-0225-7 [ Links ]
15. Michiels P, Gabriels D, Hartmann R. Using the seasonal and temporal precipitation concentration index for characterizing monthly rainfall distribution in Spain. Catena. 1992;19(1):43-58. https://doi.org/10.1016/0341-8162(92)90016-5 [ Links ]
16. Apaydin H, Erpul G, Bayramin I, Gabriels D. Evaluation of indices for characterizing the distribution and concentration of precipitation: A case for the region of Southeastern Anatolia Project, Turkey. J Hydrol. 2006;328:726-732. https://doi.org/10.1016/j.jhydrol.2006.01.019 [ Links ]
17. Martin-Vide J. Spatial distribution of a daily precipitation concentration index in Peninsular Spain. Int J Climatol. 2004;24:959-971. https://doi.org/10.1002/joc.1030 [ Links ]
18. Li X, Jiang F, Li L, Wang G. Spatial and temporal variability of precipitation concentration index, concentration degree and concentration period in Xinjiang, China. Int J Climatol. 2011;31(11):1679-1693. [ Links ]
19. De Luis M, Gonzalez-Hidalgo JC, Brunetti M, Longares LA. Precipitation concentration changes in Spain 1946-2005. Nat Hazards Earth Syst Sci. 2011;11:1259-1265. https://doi.org/10.5194/nhess-11-1259-2011 [ Links ]
20. Valli M, Sree KS, Krishna IVM. Analysis of precipitation concentration index and rainfall prediction in various agro-climatic zones of Andhra Pradesh, India. Int Res J Environ Sci. 2013;2(5):53-61. [ Links ]
21. Iskander SMd, Rajib MA, Rahman MdM. Trending regional precipitation distribution and intensity: Use of climate indices. Atmos Clim Sci. 2014;4:385-393. [ Links ]
22. Gocic M, Shamshirband S, Razak Z, Petkovic D, Ch S, Trajkovic S. Long-term precipitation analysis and estimation of precipitation concentration index using three support vector machine methods. Adv Meteorol. 2016;2016:1-11. https://doi.org/10.1155/2016/7912357 [ Links ]
23. Kruger AC. Observed trends in daily precipitation indices in South Africa: 1910-2004. Int J Climatol. 2006;26:2275-2285. https://doi.org/10.1002/joc.1368 [ Links ]
24. New M, Hewitson B, Stephenson DB, Tsiga A, Kruger A, et al. Evidence of trends in daily climate extremes over southern and west Africa. J Geophys Res. 2006;111,D14102, 11 pages. https://doi.org/10.1029/2005JD006289 [ Links ]
25. Kruger AC, Sekele SS. Trends in extreme temperature indices in South Africa: 1962-2009. Int J Climatol. 2013;33:661-676. https://doi.org/10.1002/joc.3455 [ Links ]
26. MacKellar N, New M, Jack C. Observed and modelled trends in rainfall and temperature for South Africa: 1960-2010. S Afr J Sci. 2014;110(7/8), Art. #2013-0353, 13 pages. https://doi.org/10.1590/sajs.2014/20130353 [ Links ]
27. Botai MC, Botai JO, De Wit JP, Ncongwane KP. Trend characteristics of rainfall and streamflow in the Vaal River catchment. 33rd Annual Conference of the South African Society for Atmospheric Sciences. 2017:38. [ Links ]
28. Huffman GJ, Adler RF, Bolvin DT, Gu G, Nelkin EJ, Bowman KP, et al. The TRMM multisatellite precipitation analysis (TMPA): Quasi-global, multiyear, combined-sensor precipitation estimates at fine scales. J Hydrometeorol. 2007;8:38-55. https://doi.org/10.1175/JHM560.1 [ Links ]
29. Chiu LS, Liu Z, Vongsaard J, Morain S, Budge A, Neville P, et al. Comparison of TRMM and water district rain rates over New Mexico. Adv Atmos Sci. 2006;23:1-13. https://doi.org/10.1007/s00376-006-0001-x [ Links ]
30. Kummerow C, Barnes W, Kozu T, Shiue J, Simpson J. The tropical rainfall measuring mission (TRMM) sensor package. J Atmos Ocean Technol. 1998;15:809-817. https://doi.org/10.1175/1520-0426(1998)015<0809:TTRMMT>2.0.CO;2 [ Links ]
31. Guo R, Liu Y. Evaluation of satellite precipitation products with rain gauge data at different scales: Implications for hydrological applications. Water. 2016;8(7), Art. #281, 20 pages. https://doi.org/10.3390/w8070281 [ Links ]
32. Zhang L, Qian Y. Annual distribution features of the yearly precipitation in China and their interannual variations. Acta Meteorol Sin. 2003;17(02):146-163. [ Links ]
33. Theil H. A rank-invariant method of linear and polynomial regression analysis, I. Nederlands Akad Wetensch Proc. 1950;53:386-392. [ Links ]
34. Kruger AC, Nxumalo MP. Historical rainfall trends in South Africa: 1921 - 2015. Water SA. 2017;43(2):285-297. [ Links ]
35. EUMETSAT. Winter lightning associated with cut-off low over South Africa [webpage on the Internet]. c2011 [cited 2017 Oct 10]. Available from: http://www.eumetsat.int/website/home/Images/ImageLibrary/DAT_2351448.html [ Links ]
36. Araulo J, Abiodun B, Crespo O. Impacts of drought on grape yields in Western Cape, South Africa. Theor Appl Climatol. 2014;123(1):117-130. [ Links ]
37. Botai CM, Botai JO, Dlamini LC, Zwane NS, Phaduli E. Characteristics of droughts in South Africa: A case study of Free Sate and North West provinces. Water. 2016;8:439-462. https://doi.org/10.3390/w8100439 [ Links ]
38. Botai CM, Botai JO, De Wit JP, Ncongwane KP, Adeola AM. Drought characteristics over the Western Cape Province, South Africa. Water. 2017;9:876-892. https://doi.org/10.3390/w9110876 [ Links ]
39. Gbetibouo G, Hassan R. Economic impact of climate change on major South African field crops: A Ricardian approach. Glob Planet Change. 2005;47:143-152. https://doi.org/10.1016/j.gloplacha.2004.10.009 [ Links ]
40. Kang Y, Khan S, Ma X. Climate change impacts on crop yield, crop water productivity and food security - A review. Progr Nat Sci. 2009;19:1665-1674. https://doi.org/10.1016/j.pnsc.2009.08.001 [ Links ]
41. Van Dijk AIJM, Bruijnzeel LA, Rosewell CJ. Rainfall intensity - Kinetic energy relationships: A critical literature appraisal. J Hydrol. 2002;261:1-23. https://doi.org/10.1016/S0022-1694(02)00020-3 [ Links ]
42. Rose CW. Erosion and sedimentation. In: Bonnell M, Hufschmidt MM, Gladwell JS, editors. Hydrology and water management in the humid tropics - Hydrological research issues and strategies for water management. Cambridge, UK: Cambridge University Press; 1993. p. 301-343. https://doi.org/10.1017/CBO9780511564468.018 [ Links ]
43. Mohamadi MA, Kavian A. Effects of rainfall patterns on runoff and soil erosion in field plots. Int Soil Water Conserv Res. 2015;3:273-281. https://doi.org/10.1016/j.iswcr.2015.10.001 [ Links ]
 Correspondence:
Christina Botai
Email: christina.botai@weathersa.co.za
Received: 16 Nov. 2017
Revised: 09 Apr. 2018
Accepted: 22 Apr. 2018
Published: 30 July 2018
FUNDING: None

