


Servicios Personalizados
Articulo
 Inglés (pdf)
 Articulo en XML
 Referencias del artículo
Indicadores

Links relacionados
-
 Citado por Google
 -
 Similares en Google
Compartir

 Permalink
South African Journal of Science
versión On-line ISSN 1996-7489
versión impresa ISSN 0038-2353
S. Afr. j. sci. vol.114 no.5-6 Pretoria may./jun. 2018
http://dx.doi.org/10.17159/sajs.2018/20170284
RESEARCH ARTICLE
Household food waste disposal in South Africa: A case study of Johannesburg and Ekurhuleni
Suzan Oelofse; Aubrey Muswema; Fhumulani Ramukhwatho
Natural Resources and the Environment, Council for Scientific and Industrial Research, Pretoria, South Africa
ABSTRACT
Food waste is becoming an important issue in light of population growth and global food security concerns. However, data on food wastage are limited, especially for developing countries. Global estimates suggest that households in developed countries waste more food than those in developing countries, but these estimates are based on assumptions that have not been tested. We therefore set out to present primary data relating to household food waste disposal for South Africa within the sub-Saharan African context. As the Gauteng Province contributes about 45% of the total municipal waste generated in South Africa, the case study area covers two of the large urban metropolitan municipalities in Gauteng, namely Ekurhuleni and Johannesburg, with a combined population of 8.33 million, representing nearly 15% of the South African population. Municipal solid waste characterisation studies using bulk sampling with randomised grab sub-sampling were undertaken over a 6-week period during summer in 2014 (Johannesburg) and 2016 (Ekurhuleni), covering a representative sample of the municipal waste collection routes from households in each of the two surveyed municipalities. The food waste component of the household waste (excluding garden waste) was 3% in Ekurhuleni and 7% in Johannesburg. The results indicate that an average of 0.48 kg (Ekurhuleni) and 0.69 kg (Johannesburg) of food waste (including inedible parts) is disposed of into the municipal bin per household per week in the two municipalities, respectively. This translates into per capita food waste disposal of 8 kg and 12 kg per annum, respectively, in South Africa as compared to the estimated 6-11 kg per annum in sub-Saharan Africa and South and Southeast Asia.
SIGNIFICANCE:
• Research on food waste in developing countries is limited.
• This study is the first of its kind undertaken in South Africa.
• Food waste research is important to address food security issues.
• This study provides evidence to support Sustainable Development Goal 12.3.
Keywords: food security; municipal solid waste; socio-economic status; developing country; sub-Saharan Africa
Introduction
Global estimates suggest that the world population will reach 9.6 billion by 2050.1 At current lifestyle patterns, it is estimated that we will need the equivalent of nearly three planets to sustain the world population in 2050.1Increasing food production to ensure food security will put additional pressure on already constrained natural resources.1 Yet, it is estimated that between a third and a half of all food produced globally never reaches the point of human consumption.2 It is ethically unacceptable to waste food that could be used to feed people.3 In South Africa, 12 million people (24.5% of the national population) go to bed hungry each day4 and it is reported that South Africa has the largest proportion of food wastage in Africa5. Food waste can be seen as having a triple negative impact: (1) the waste of resources (including water and energy) used along the supply chain in the production, handling and distribution of food that is not consumed by humans; (2) the socio-economic impacts associated with food insecurity; and (3) environmental impacts associated with waste and emissions (including greenhouse gas emissions) generated during the production, harvesting, processing, distribution and disposal of food that is not consumed.6
All households, irrespective of income level, contribute to food waste.7-9 Baker et al.10 found a direct relationship between household food waste generation, household income and the number of people residing in a household. Food waste decreases when there are more occupants, yet increases with household income level.10 As such, households in wealthier countries tend to generate more food waste than those in developing countries; while in all cases there are significant economic costs associated with food waste. The average annual cost of household food waste in South Africa is ZAR21.7 billion (EUR1.5 billion at an exchange rate of ZAR14.40/EUR1.00)11. Annual costs of food waste in Europe are reported as ZAR7 200 million (EUR500 million) in Finland12, ZAR388.8 billion (EUR27 billion) in Norway13, ZAR30.96 billion (EUR2.15 billion) in Denmark14 and ZAR126.7 billion in the UK (GBP10.2 billion at an exchange rate of ZAR12.42/GBP1.00)15. Therefore, preventing food wastage will not only save money for households, but will have broader economic, social and environmental benefits.16 Reducing food waste will address food and water security concerns17 and contribute to the development of more sustainable food systems18.
The choice of food waste disposal system by households can have environmental implications (e.g. composting is preferable to throwing food in the trash), but the largest environmental benefits will be derived from preventing food waste altogether.19 Research found that 60% of the total household food waste in the UK is avoidable.20 Initial findings of ongoing research in South Africa noted similarities in the food types being wasted as well as the reasons for wasting food between households in the City of Tshwane and the UK.21 The main reasons why food is thrown away in the UK is because it either 'wasn't used in time', or too much was cooked, prepared or served.20 Similar reasons for food wastage are reported for households in South Africa.9,21The potential therefore exists that food waste at household level in South Africa can be reduced.
Comparing per capita food waste at consumer level between different studies is problematic because of non-standard definitions and sampling methods when measuring food waste.22 Attempts have therefore been made to standardise the definition of food waste. For example, a project commissioned by the European Union proposes the following definition:
Any food, and inedible parts of food, removed from the food supply chain to be recovered or disposed (including composted, crops ploughed in/not harvested, anaerobic digestion, bio-energy production, co-generation, incineration, disposal to sewer, landfill or discarded to sea).23
The data reported in this paper include the edible and inedible parts of food that is disposed of by households into the municipal bin but exclude food waste being composted, fed to animals or disposed of in any manner other than in the municipal bin.
Current estimates of food wastage (edible portion only) throughout the value chain suggest that 'on a per capita basis, much more food is wasted in the industrialised world than in developing countries'24. The water and carbon footprint of the food wasted in the industrial world extends beyond the boundaries of the country in which the food is wasted, to the countries where the food is produced and processed.17The environmental impacts of wasted food are therefore a global issue in light of globalised food markets.
The per capita food wasted (edible portion) by consumers in Europe and North America is estimated to be 95 kg and 115 kg per annum, respectively; as compared to only 6 kg and 11 kg per annum in sub-Saharan Africa and South/Southeast Asia, respectively.24 If we assume that food wastage patterns in South Africa are similar to those in the rest of sub-Saharan Africa, then South African households contribute about 4% of total food waste in South Africa.6 The latest published estimates of the magnitude of food waste at consumer level in South Africa, using estimates from Gustavsson et al.24 regarding the proportion of food wasted at each stage of the value chain (on average for sub-Saharan Africa), together with the Food and Agriculture Organization of the United Nations data on actual food production in South Africa, is 501 000 tonnes per annum25. This translates into 9.68 kg per capita per annum using 2011 population statistics for South Africa.26
In an earlier study, following a different methodology (i.e. using estimates from waste characterisation studies conducted in South Africa across various municipalities rather than Gustavsson et al.'s averages for sub-Saharan Africa), Nahman et al.11 estimated household food wastage in South Africa at 1.4 million tonnes per annum, or 28 kg per capita per annum. This is nearly three times the 9.68 kg per capita per annum estimated by Nahman and De Lange25. However, Nahman et al.11 caution that the 28 kg per capita per annum may be an overestimation, because of the difficulties of extrapolating food waste quantities from the reported organic waste quantities derived from waste composition analysis.
A study of households in the City of Tshwane, South Africa, found the average food waste generation to be 6 kg per household per week across income groups (with an average three people per household),27which is equivalent to about 98 kg per capita per annum. In this study, source separated food waste from 133 participating households was collected and weighed.27 The study by Ramukhwatho27 provides an accurate measure of the actual food waste generation across income groups prior to treatment or disposal, whereas the report by Nahman et al.11 estimated the average food waste disposed of in the municipal bin.
The results from the studies by Nahman et al.11 and Ramukhwatho27suggest that post-consumer food waste in South Africa is higher than in the rest of sub-Saharan Africa. South Africa is one of the high-income countries in the region, with a larger and more advanced economy in comparison with the rest of sub-Saharan Africa.28 Higher household incomes are associated with a decline in consumption of starchy food staples and increased diversification of diets towards more fresh fruit and vegetables, dairy, meat and fish.22 However, the study by Ramukhwatho27 found that starchy foods (mealie pap, bread and rice) are still the most wasted food types across income groups with higher-income groups wasting more rice and vegetables as compared to middle- and low-income households. Wealthier people are reported to buy more food as a result of affordability29 and are therefore likely to waste more. However, Koivupuro et al.30 found no correlation between households' income levels and the amount of food wasted in Finland. Household food wastage in urban South Africa can be expected to be higher than in the rest of sub-Saharan Africa as a result of affordability, but this expectation still needs to be confirmed.
The small sample size (133 households) included in the study by Ramukhwatho27, and the difficulties expressed in the paper by Nahman et al.11, highlight the need for more accurate data on household food waste from a representative sample of households in South Africa. The data reported in this paper were collected as part of municipal solid waste characterisation studies in Johannesburg and Ekurhuleni - two of the larger urban metropolitan municipalities in the Gauteng Province of South Africa during the summers of 2014 and 2016. A limitation of reporting the results of two independent studies is that only directly comparable data can be used and, therefore, although both characterisation studies covered at least two seasons, only data collected during the summer seasons are reported here.
Contextualising the study area
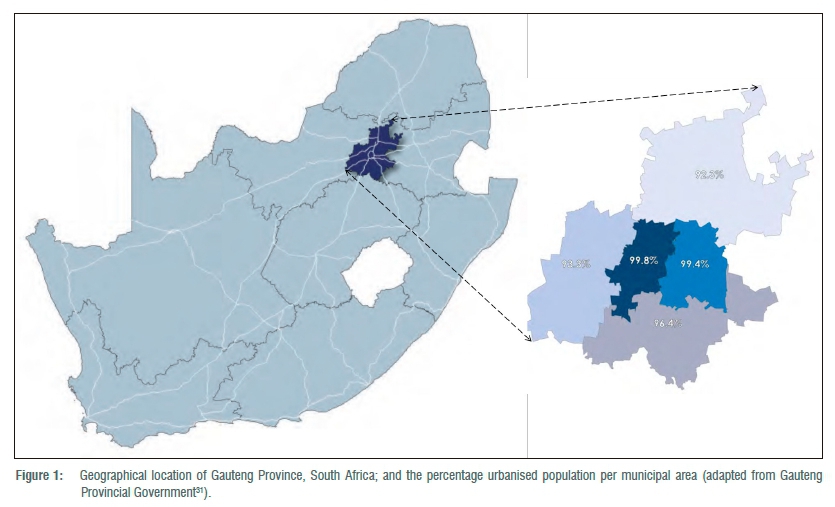
Gauteng is the smallest of the nine provinces of South Africa, comprising only 1.5% of the land area, yet it is home to 25% of the national population26 and contributes 34% of the country's gross domestic product (GDP)31. The Gauteng Province consists of three metropolitan municipalities - Ekurhuleni, Johannesburg and Tshwane - as well as two district municipalities - Sedibeng and West Rand - which are further subdivided into six local municipalities (Figure 1). Johannesburg is home to 36% of Gauteng's population, Ekurhuleni 26%, Tshwane 24% and the two district municipalities 7% each.32 Being the most densely populated and urbanised province of South Africa (97% of the population in Gauteng is urbanised), it is estimated that Gauteng contributes about 45% of total municipal solid waste generated in South Africa.33 Credible data on waste generation and composition in the rural areas of Gauteng are limited.
Household waste collection in the urban areas of Gauteng is typically done once a week in line with the National Domestic Waste Collection Standards.34 Waste separation at source (S@S) is not yet common practice in South African households. Following the promulgation of the National Environmental Management: Waste Act, 200835and approval of the National Waste Management Strategy, which sets targets for, among other things, initiating S@S programmes for households in all metropolitan municipalities, secondary cities and large towns36 - a number of such initiatives have been launched in selected suburbs in the study area. S@S initiatives primarily target recyclables (i.e. paper, cardboard, plastics, glass and metals), and therefore food waste is still collected as part of the mixed household solid waste collection service provided by municipalities or their service providers, and disposed of at landfill.
Methodology
Sampling
Waste characterisation studies in Johannesburg and Ekurhuleni were undertaken using bulk sampling with randomised grab sub-sampling, as described by Jarrod Ball and Associates Consortium37, covering a representative sample of the municipal waste collection routes from households in each of the two surveyed municipalities. This sampling methodology was used in order to collect data that are comparable to the 2001 characterisation results for Johannesburg as reported by Jarrod Ball and Associates Consortium37. The sampling areas were chosen purposefully to cover a range of socio-economic areas (high, middle and low income), but the routes within the selected areas were randomly chosen.
Sampling teams consisted of one person accompanying the waste collection vehicle during normal waste collection from households to record data on the route and the number of households serviced, and another four people to collect and sort the waste samples at the landfill.
Bulk samples were collected using municipal waste collection vehicles following the normal collection schedules (weekly collection). At the end of the collection routes, the mass of the waste load collected was determined using the weighbridge at the landfill. A random grab sample of 100-200 kg was then taken from each load and manually sorted into pre-determined waste categories, including food waste, by trained waste sorters. Sorting was done at dedicated sorting areas on the landfill sites, away from the active workface (the landfill operational area). Any food and inedible parts of food (including drinks and cooking oil) that were present in the waste sample were sorted into the food waste category (if it was still in packaging material, the packaging was removed). Each sorted waste fraction was weighed using a calibrated scale and accurately recorded. At the end of each day, the sorted waste was returned to the workface for proper disposal.
Calculations
Waste disposal per household (kilograms/household/week) was calculated by dividing the mass of each bulk sample by the number of households serviced by the specific vehicle. Then, the mass of food waste per household for each sample was calculated by multiplying the percentage food waste determined from each sub-sample with the total calculated household waste for the bulk sample from which the sub-sample was taken.
Limitations
It was not in all instances possible to clearly determine the number of households from which waste was collected in the case of townhouse complexes, apartment buildings and communal collection points. Therefore, the results reported here only include data collected from routes for which the number of households serviced could clearly be determined; data from townhouse complexes, gated communities and apartment buildings are not included in the results presented here.
Using bulk sampling of waste collected by the municipal waste collection service, limits the results to the food waste disposed into the municipal bin. Food and drink waste fed to pets, disposed of into the sink and treated through home composting is not included in the scope of this study.
Results and discussion
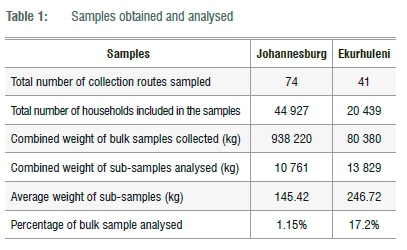
The data reported were collected from 74 waste collection routes covering 44 927 households in the Johannesburg metropolitan municipality and 41 routes covering 20 439 households in the Ekurhuleni metropolitan municipality (Table 1). Data in both municipalities were collected in summer, which is the rainy season in Gauteng Province.
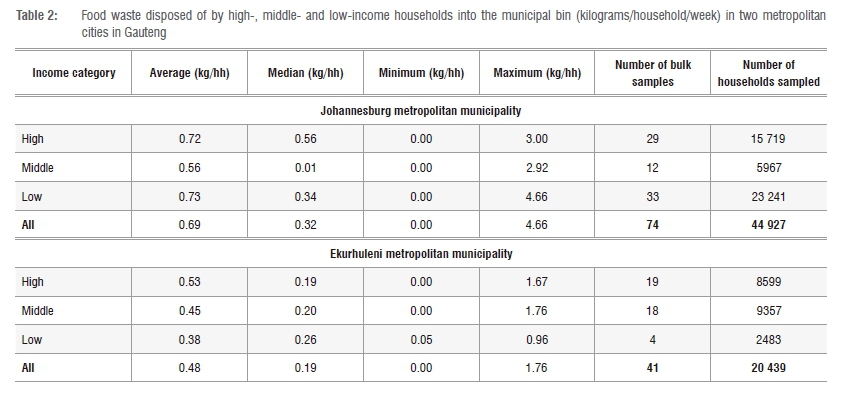
The average food waste disposed per household in Johannesburg (0.69 kg/week) is higher than that in Ekurhuleni (0.48 kg/week) across all income categories (Table 2).
The differences in weekly food waste disposal (kg/hh) between income groups and municipalities appear to be small and therefore a statistical analysis was done to determine the significance of the differences between high, middle and low income as well as between high and low income. The Mann-Whitney test was done because of the skewness of the data. The results indicate that there are no statistically significant differences in the food waste generation (kg/hh), i.e. there is a consistent pattern of differences between municipalities and income levels (Table 3).
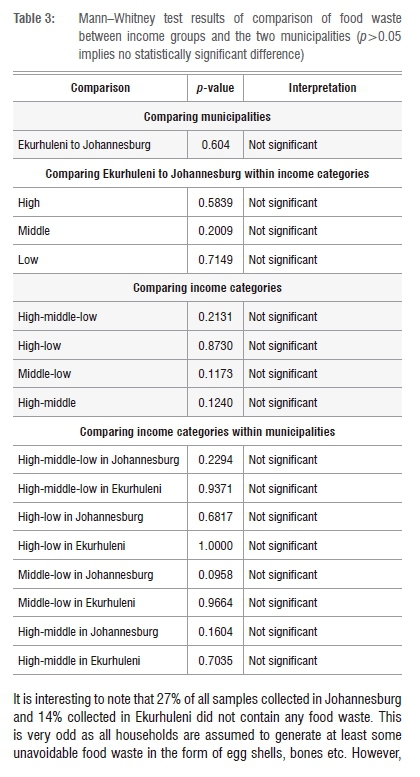
It is interesting to note that 27% of all samples collected in Johannesburg and 14% collected in Ekurhuleni did not contain any food waste. This is very odd as all households are assumed to generate at least some unavoidable food waste in the form of egg shells, bones etc. However, this may be as a result of the random grab sampling method used for sub-sampling or it may be an indication that some households use alternative food waste management strategies which may include feeding of food waste to pets and/or home composting.
Global estimates of food waste assume similar food wastage in South Africa compared with the rest of sub-Saharan Africa.24 For comparative purposes, the data collected in this study from metropolitan households in South Africa were converted into food waste per capita per annum. This results in estimates of approximately 8 kg and 12 kg per capita per annum in Ekurhuleni and Johannesburg, respectively (Table 4); which is higher than the average of 6 kg per capita per annum for sub-Saharan Africa, but lower than the 95 kg in Europe.24 Furthermore, the estimates for sub-Saharan Africa and Europe include all food that was meant for human consumption and that reached the consumer, but was never consumed24; whereas our results include only the waste disposed of into the municipal bin.

The study by Ramukhwato27 was conducted in urban households in Gauteng which kept food diaries; 86% of respondents mostly wasted starchy staples (i.e. mealie pap, rice and bread), and 17% managed their food waste either by feeding it to pets (14%) or by home composting (3%). The results reported here are therefore likely to be a conservative estimate of household food waste generation in Gauteng.
Based on the 2011 urban population of each municipality, the amount of food waste disposed to landfill by urban households in Ekurhuleni and Johannesburg can be calculated at between 25 198 tonnes and 51 462 tonnes per annum.
Conclusions and recommendations
An average of 0.48 kg and 0.69 kg of food waste (including inedible parts) is disposed of into the municipal bin per household per week in the municipalities of Ekurhuleni and Johannesburg, respectively. These figures translate into per capita food waste disposal of about 8 kg and 12 kg per annum, respectively, and between 25 198 tonnes and 51 462 tonnes from households per annum.
Because the results reflect only the waste disposed of into the municipal bin, and it is reported that other food waste management strategies are also employed by households in Gauteng27, this should be seen as a conservative estimate for urban households. It is important to note that rural households were not included in the survey, and therefore extrapolation beyond urban households in Gauteng using these data is not possible.
It is evident from this study that initiatives focusing on urban households' food waste reduction and diversion from landfill have the potential to divert significant amounts of food waste from landfill. The results from this study will specifically be useful to the two surveyed municipalities, as they provide accurate data against which the success of food waste reduction strategies can be measured.
It is recommended that future research should consider different sampling methods in addition to bulk sampling, including random sampling of individual household bins or bags across a city or by asking participants to keep food diaries and record the reasons for the food wastage at household level. All future research should aim to collect complementary evidence for the development of food waste reduction strategies for South Africa including data across the different types of municipalities in South Africa (A, B1, B2, B3 and B4) to obtain representative data across metros, large cities and more rural towns.
Acknowledgements
We acknowledge the efforts and hard work of the sampling and sorting teams who assisted with data collection under sometimes very trying conditions. The cooperation and kind assistance of the management, staff and service providers of the two sampled municipalities are acknowledged as well as Renee Koen for assistance with the statistical analysis and Anton Nahman for valuable input into an earlier draft of the paper. The research was funded by the Gauteng Infrastructure Financing Agency and we are grateful for their support and the permission of all involved to publish these findings.
Authors' contributions
S.O. conceptualised the article, identified relevant data sets, extracted relevant data, interpreted the data and drafted the bulk of the article. A.M. was involved in the data collection, contributed to the methodology section and assisted with the interpretation of the data and conclusions. F.R. assisted with the literature review and drafting of the introduction.
References
1. United Nations. Responsible consumption and production: Why it matters [document on the Internet]. c2015 [cited 2016 Nov 21]. Available from: http://www.un.org/sustainabledevelopment/wp-content/uploads/2016/08/16-00055L_Why-it-Matters_Goal-12_Consumption_2p.pdf [ Links ]
2. Institution of Mechanical Engineers. Global food, waste not want not. c2013 [cited 2013 Jan 03]. Available from: https://www.imeche.org/policy-and-press/reports/detail/global-food-waste-not-want-not [ Links ]
3. Thyberg KI, Tonjes DJ. Drivers of food waste and their implications for sustainable policy development. Resour Conserv Recycl. 2016;106:110-123. https://doi.org/10.1016/j.resconrec.2015.11.016 [ Links ]
4. Hosken G. Twelve million going to bed hungry in SA. TimesLIVE. 2013 January 30 [cited 2013 Feb 06]. Available from: http://www.timeslive.co.za/thetimes/2013/01/30/twelve-million-going-to-bed-hungry-in-sa [ Links ]
5. AllAfrica. South Africa: Waste not, want not is a lesson still to be learnt. Business Day. 2010 September 20 [cited 2014 May 13]. Available from: http://allafrica.com/stories/201009201320.html [ Links ]
6. Oelofse SHH, Nahman A. Estimating the magnitude of food waste generated in South Africa. Waste Manag. Res. 2013;31(1):80-86. https://doi.org/10.1177/0734242X12457117 [ Links ]
7. Sustainability Victoria. Food waste avoidance studies 2010 [document on the Internet]. c2011 [cited 2017 Jan 26]. Available from: http://www.google.co.za/url?sa=t&rct=j&q=&esrc=s&source=web&c d=&cad=rja&uact=8&ved=0ahUKEwjz1rHFqN_RAhXkAcAK HRNlAvYQFggXMAA&url = http%3A%2F%2Fwww.sustainability.vic.gov.au%2F-%2Fmedia%2Fresources%2Fdocuments%2Fpublications-and-research%2Fpublications%2Fc--f%2Fpublications-food-waste-avoidance-studies-2010.pdf%3Fla%3Den&usg=AFQjCNGbZgTDKWTZHSa1MzvpO_JkDPc juA&sig2=vrI_5GZCsQZwckpRHlZLEg [ Links ]
8. Visagie J. Growth in the middle class: Two perspectives that matter for policy. Develop South Afr. 2015;32(1):3-24. https://doi.org/10.1080/0376835X.2014.965387 [ Links ]
9. Ramukhwatho FR, Du Plessis R, Oelofse S. Household food wastage by income level: A case study of five areas in the city of Tshwane Metropolitan Municipality, Gauteng Province, South Africa In: Proceedings of WasteCon 2016; 2016 October 17-21; Johannesburg, South Africa. Johannesburg: IWMSA; 2016. p. 57-64. [ Links ]
10. Baker D, Fear J, Dennis R. What a waste - An analysis of household expenditure on food [document on the Internet]. c2009 [cited 2014 Mar 08]. Available from: http://www.tai.org.au/node/1580%20food [ Links ]
11. Nahman A, De Lange W, Oelofse S, Godfrey L. The costs of household food waste in South Africa. Waste Manage. 2012;32(11):2147-2153. https://doi.org/10.1016/j.wasman.2012.04.012 [ Links ]
12. Statistics Finland. Annual national accounts [webpage on the Internet]. c2011 [cited 2013 Nov 14]. Available from: http://www.stat.fi/til/vtp/index_en.html [ Links ]
13. Olufsson HK. Prevention of food waste. Presentation of the ForMat-project [document on the Internet]. c2012 [cited 2013 Oct 09]. Available from: http://ostfoldforskning.no/uploads/dokumenter/Food% 20Waste%20juni%202012/ Prevention%20of%20food%20waste%20%20Halfdan%20Kverneland%20 Olafss%C3%B8n,%20Matvett%20AS.pdf [ Links ]
14. Danish Agriculture and Food Council. Food waste: A global tragedy. Aarhus: Aarhus University, CONCITO, the Institute of Food and Resource Economics; 2011.p.31. [ Links ]
15. WRAP (Waste Resource and Action Programme). Food waste report: The food we waste [document on the Internet]. c2008 [cited 2011 May 26]. Available from: http://wrap.s3.amazonaws.com/the-food-we-waste.pdf [ Links ]
16. Schott A, Canovas A. Current practice, challenges and potential methodological improvements in environmental evaluations of food waste prevention. Resour Conserv Recyl. 2015;101:132-142. https://doi.org/10.1016/j.resconrec.2015.05.004 [ Links ]
17. WRAP, WWF-UK. The water and carbon footprint of household food and drink waste in the UK: Final report 2011 [document on the Internet]. c2011 [cited 2017 Jan 26]. Available from: http://waterfootprint.org/media/downloads/Water-and-carbon-footprint-food-and-drink-waste-UK-2011.pdf [ Links ]
18. Quested TE, Parry AD, Easteal S, Swannell R. Food and drink waste from households in the UK. Nutr Bull. 2011;36:460-467. https://doi.org/10.1111/j.1467-3010.2011.01924.x [ Links ]
19. Quested TE, Marsh E, Stunell D, Parry AD. Spaghetti soup: The complex world of food waste behaviours. Resour Conserv Recyl. 2013;79:43-51. https://doi.org/10.1016/j.resconrec.2013.04.011 [ Links ]
20. WRAP (Waste Resource and Action Programme). Household food and drink waste in the United Kingdom 2012: Final report [document on the Internet]. c2013 [cited 2015 Jan 08]. Available from: http://www.wrap.org.uk/sites/files/wrap/hhfdw-2012-main.pdf.pdf [ Links ]
21. Oelofse SHH, Marx-Pienaar N. Household food wastage - A case study of middle to high income urban households in the City of Tshwane. In: Proceedings of WasteCon 2016; 2016 October 17-21; Johannesburg, South Africa. Johannesburg: IWMSA; 2016. p. 51-56. [ Links ]
22. Parfit J, Barthel M, Macnaughton S. Food waste within food supply chains: Quantification and potential for change to 2050. Philos Trans R Soc Lond B Biol Sci. 2010;365:3065-3081. https://doi.org/10.1098/rstb.2010.0126 [ Links ]
23. Fusions. Reducing food waste through social innovation: Fusions definitional framework for food waste. Full report 3 July 2014. Göteborg: Swedish Institute for Food and Biotechnology; 2014. [ Links ]
24. Gustavsson J, Cederberg C, Sonesson U, Van Otterdijk R, Meybeck A. Global food losses and food waste: Extent, causes and prevention. Study conducted for the International Congress SAVE FOOD! at Interpack 2011, Düsseldorf, Germany. Rome: Food and Agriculture Organisation of the United Nations; 2011. [ Links ]
25. Nahman A, De Lange W. Costs of food waste along the value chain: Evidence from South Africa. Waste Manage. 2013;33:2493-2500. https://doi.org/10.1016/j.wasman.2013.07.012 [ Links ]
26. Statistics South Africa (StatsSA). Census 2011: Census in brief. Report no. 03-01-41. Pretoria: StatsSA; 2012. [ Links ]
27. Ramukhwatho FR. An assessment of the household food wastage in a developing country: A case study of five areas in the City of Tshwane Metropolitan Municipality, Gauteng Province, South Africa [MSc dissertation]. Pretoria: University of South Africa; 2016. http://uir.unisa.ac.za/handle/10500/21162 [ Links ]
28. International Monetary Fund (IMF). World economic and financial surveys: Regional economic outlook: Sub-Saharan Africa. Navigating Headwinds [document on the Internet]. c2015 [cited 2017 Jan 11]. Available from: https://www.imf.org/external/pubs/ft/reo/2015/afr/eng/pdf/sreo0415.pdf [ Links ]
29. Skourides I, Smith SR, Loizides M. Sources and factors controlling the disposal of biodegradable municipal solid waste in urban and rural areas of Cyprus. Waste Manag Res. 2008;26:188-195. https://doi.org/10.1177/0734242X07085756 [ Links ]
30. Koivupuro HK, Hartikainen H, Silvennoinen K, Katajajuuri JM, Heikintalo N, Reinikainen A, et al. Influence of socio-demographical, behavioural and attitudinal factors on the amount of avoidable food waste generated in Finnish households. Int J Consum Stud. 2012;36(2):183-191. https://doi.org/10.1111/j.1470-6431.2011.01080.x [ Links ]
31. Gauteng Provincial Government. Gauteng spatial development framework 2030. Johannesburg: Gauteng Provincial Government; 2016 [cited 2017 Jan 10]. Available from: http://www.gautengonline.gov.za/Documents/GSDF%202030.pdf [ Links ]
32. Statistics South Africa (StatsSA). Census 2011 municipal report - Gauteng. Report no. 03-01-5572. Pretoria: StatsSA; 2012. [ Links ]
33. Department of Environmental Affairs (DEA). National waste information baseline report. Pretoria: DEA; 2012. [ Links ]
34. Republic of South Africa. National domestic waste collection standards. GN 21, GG 33935 of 21 January 2011. Pretoria: Government Printers; 2011. [ Links ]
35. Republic of South Africa. National environmental management: Waste act, 2008 (Act No 59 of 2008). GG 32000, Vol. 525, Notice no. 278. Pretoria: Government Printers; 2009. [ Links ]
36. Department of Environmental Affairs (DEA). National waste management strategy. GN 344 GG 35306 of 4 May 2012. Pretoria: DEA; 2012. [ Links ]
37. Jarrod Ball and Associates Consortium. A waste stream analysis of the general waste stream. DANCED Environmental Capacity Building Project, Johannesburg. Mini-Project WM4 on Metro-wide waste management planning - Phase 1. Current waste management in the City of Johannesburg. Report no. 1A; December 2001. Unpublished report. [ Links ]
 Correspondence::
Suzan Oelofse
Email: soelofse@csir.co.za
Received: 18 Aug. 2017
Revised: 23 Oct. 2017
Accepted: 07 Dec. 2017
Published: 30 May 2018
FUNDING: Gauteng Infrastructure Financing Agency (South Africa)

