


Servicios Personalizados
Articulo
 Inglés (pdf)
 Articulo en XML
 Referencias del artículo
Indicadores

Links relacionados
-
 Citado por Google
 -
 Similares en Google
Compartir

 Permalink
South African Journal of Science
versión On-line ISSN 1996-7489
versión impresa ISSN 0038-2353
S. Afr. j. sci. vol.114 no.3-4 Pretoria mar./abr. 2018
http://dx.doi.org/10.17159/sajs.2018/20170331
RESEARCH ARTICLE
An approach for the determination and correlation of diversity and efficiency of software development teams
Seher Altiner; Mustafa B. Ayhan
Industrial Engineering Department, Marmara Universit Istanbul, Turkey
ABSTRACT
We examined the impact of diversity on team efficiency. To do so, a model was developed to measure both the efficiency and diversity of the teams. Based on these measures, the correlation between efficiency and diversity was also analysed. In addition, to demonstrate the applicability of the model, it was applied to a real-life problem involving five teams dealing with different software development projects. Firstly, diversity indices were calculated based on age, experience, education and gender information on each member for each team by using Simpson's Diversity Index. Then, four key performance indicators (KPIs) were defined to measure the success rate of the teams. Depending on these KPIs, efficiencies of the teams were measured through data envelopment analysis (DEA). The correlation between team efficiency and each diversity factor was analysed and all four factors had positive correlation with efficiency. That is, in order to increase efficiency, teams should be composed of members with diverse characteristics. Education was the diversity factor that had the most positive correlation with team efficiency. This result highlights the importance of different educational backgrounds on team efficiency.
SIGNIFICANCE:
• This study represents the first attempt to measure team diversity using Simpson's Diversity Index.
• A new technique is proposed to measure team efficiency through DEA.
• Team efficiency is positively correlated with diversity, specifically educational level, which is important for many software development teams to consider.
Keywords: diversity; efficiency; data envelopment analysis; correlation; performance evaluation
Introduction
The efficiency of software development teams is an important topic. In order to optimise efficiency, team success rates should be monitored and evaluated. Currently, the success rate of software project development teams is much lower than desired. These projects are often completed years behind schedule and exceed their budgets by millions of dollars, and, if completed, sometimes fail to meet their users' needs. A long-standing key question that has intrigued the minds of researchers concerns the problem in managing software projects efficiently while promoting team performance.
As software development is a labour- and knowledge-intensive task, teamwork in software projects has been long acknowledged as a crucial criterion for the successful design and deployment of software projects. In search of factors for successful team performance, researchers have examined the various personality characteristics of team members. Every software project will inevitably face the issue of team composition. Whether increasing diversity in team composition promotes successful teamwork and further leads a project towards fulfilment of its mission, vision and values is therefore of interest to researchers.1
Organisational scholars considering the link between team diversity in a workgroup and the group's performance have generally concluded that the relationship is neither simple nor direct. In some studies, diverse groups outperformed homogeneous groups, while in others, homogeneous groups avoided the conflicts and communication problems that often beset diverse groups.2
Because team diversity can affect project performance, our aim in this study was to develop an integrated model to determine a relation between team diversity and the efficiency of software development project teams. To do so, firstly, a tool is presented to measure the diversity in software development teams by Simpson's Diversity Index according to four different diversity factors. Secondly, four key performance indicators are defined to be used to measure the team efficiency through data envelopment analysis (DEA). Then correlation analysis is performed between the team efficiency and each of the diversity factors. As a case study, this integrated model is also applied to check the correlation between diversity and efficiency of teams for software development.
The main contributions of this study are threefold. Firstly, although Simpson's Diversity Index is used in many areas, as far as we know, this is the first attempt to measure team diversity using Simpson's Index. Techniques to measure team diversity are very limited, inadequate and ambiguous in the literature. Because Simpson's Index is easy to clarify, it can be applied to measure team diversity satisfactorily. Secondly, a new technique is proposed to measure team efficiency through DEA. As there are many inputs and outputs affecting the performance of teams, it is not easy to assess their efficiency. Hence DEA can measure the relative performance of organisational units for which the presence of multiple inputs and outputs makes comparisons difficult.3 Thirdly, by performing a correlation analysis, the relation between team diversity and efficiency can be revealed. This relation is important for many software development teams to understand which diversity factor has the greatest effect on efficiency.
Literature review
The literature is reviewed according to diversity measurement and key performance indicators in two sub-sections.
Diversity measurement
Diversity can be defined as acknowledging, understanding, accepting and valuing differences among people with respect to age, class, race, ethnicity, gender, disabilities, etc.4 Companies need to embrace diversity and look for ways to become inclusive organisations because diversity has the potential to yield greater work productivity and competitive advantages.5 The world's increasing globalisation requires more interaction among people from diverse backgrounds. Everyone is part of a worldwide economy competing within a global framework. For this reason, profit and non-profit organisations need to become more diversified to remain competitive.6 Maximising and capitalising on workplace diversity is an important issue for management.
Many different types of workplace diversity have been studied7, including age, gender, race and ethnicity, education, physical ability, culture, problem-solving ability, communication ability, motivation ability, listening ability and conflict resolution ability.
Having a diverse workforce provides many benefits such as increased adaptability, broader service range, a variety of viewpoints and more effective execution.8,9 On the other hand, more diversity also creates many challenges, such as lack of effective communication, lack of freedom of speech, increased cost of training, integration problems, increased competition and disrespect.10
It is important to manage culturally diverse workforces with different perspectives.11 In order to manage diversity, it should first be measured. Simpson's Diversity Index is one of the most commonly used indices to measure diversity, especially in ecology.12 The Shannon Diversity Index has also been a popular diversity index in ecology, where it is also known as the Shannon-Weaver Index.13 Moreover, McIntosh14 developed a diversity index, which is independent of sample size and yields values which are a percentage of the maximum possible diversity for a sample of the same size. DeJong15 analysed these three indices and compared them based on their richness and evenness components. Although there are various studies on diversity indices, the most commonly used one is Simpson's Index.15 However, as stated by Pitts and Wise16, workforce diversity research suffers from inadequate data and insufficient attention to empirical connections between diversity and organisational performance. So in the next section, the literature is reviewed regarding key performance indicators with respect to diversity.
Key performance indicators
In order to evaluate the efficiencies of teams, their performance should be measured. Performance measurement is a fundamental principle of management. It is important because it identifies performance gaps between current and desired performance and provides an indication of progress towards closing the gaps.17 Performance measurement focuses on results. It is a process of assessing the results of a company, project, or an individual to determine how effective the operations are and it is also used to detect performance gaps, shortfalls, and other problems.18 Many leading organisations employ an enterprise-wide formal performance measurement system such as Goal-Driven Measurement, Balanced Scorecard, Six Sigma, Practical Software and Systems Measurement, and variations of Shewhart's Plan-Do Check-Act Paradigm.19 Each of these approaches emphasises the need to take the following steps:
• Set clear and achievable performance goals or objectives.
• Define key performance indicators (KPIs) to characterise performance relative to the goals or objectives.
• Establish targets for each KPI.
• Collect the measurement data (i.e. results).
• Evaluate the data and use the results to make adjustments in order to achieve the targeted levels for each KPI.18
Defining the KPIs is an important step. They help an organisation define and measure progress toward organisational goals. Once an organisation has analysed its mission, identified all its stakeholders, and defined its goals, it needs a way to measure progress toward those goals. Hence, KPIs can be used as tools to measure the success rate of this progress.20
KPIs are goals or targets that measure how well an organisation is achieving its overall operational objectives or critical success factors for a particular project.21 KPIs must be objectively defined in order to provide a quantifiable and measurable indication of the organisation's progress towards achieving its goals.22
KPIs can change according to the organisation, mission and project. Despite hundreds of KPIs defined for software projects, there are some key measures that every organisation should collect and use as a basis to compare performance between projects. For software projects, the following KPIs are recommended: project effort, productivity, project duration, schedule predictability, requirements completion ratio and post-release defect density.18
Proposed model
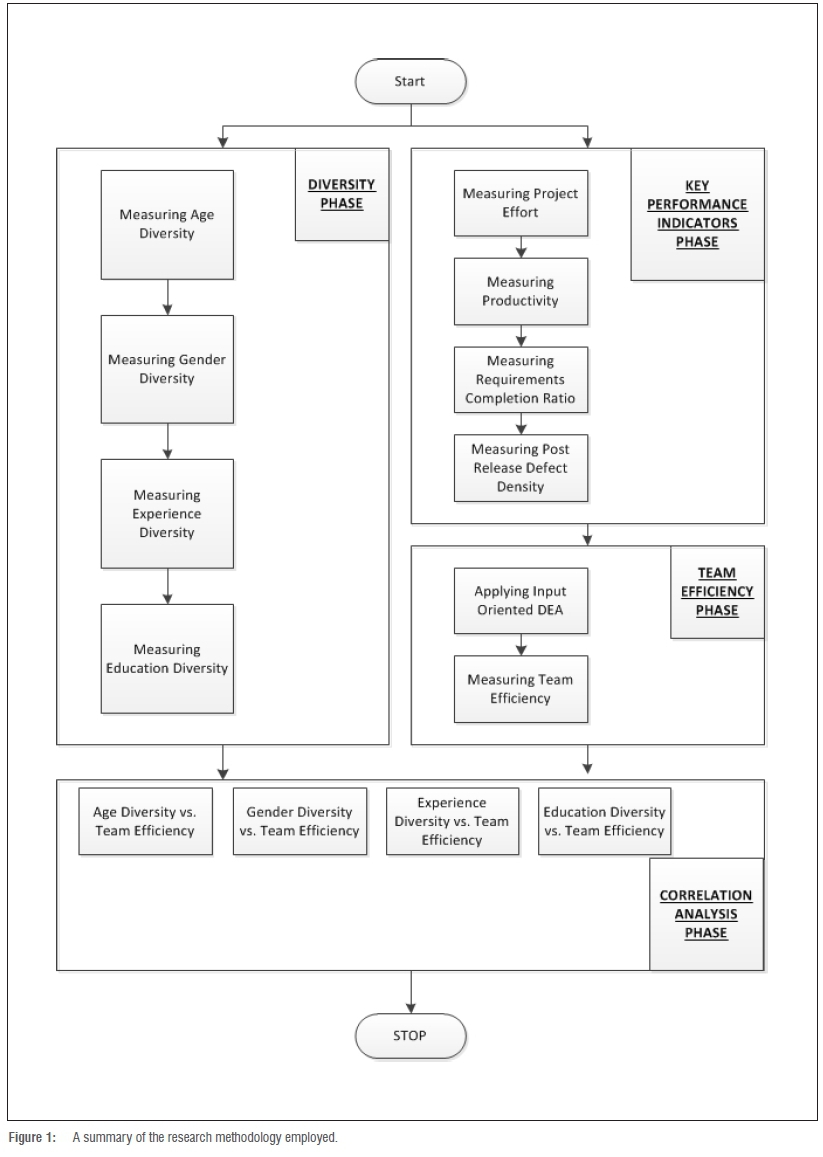
An integrated model is proposed to measure the relation between team diversity and efficiency. This model includes four phases: diversity phase, key performance indicators phase, team efficiency phase, and correlation analysis phase, as shown in Figure 1. The first phase is devoted to evaluate team diversity according to four factors. The second phase is determination of the four KPIs to measure the performance of teams. The third phase is measuring the team efficiency based on the four KPIs through DEA. The last phase is a correlation analysis to detect whether there is a meaningful relation between diversity and efficiency of teams.
Measuring team diversity
Although there are numerous diversity factors in a work place, the most commonly used diversity factors were selected: age, gender, experience and education.
Age diversity
A workforce composed of different age demographics creates an environment in which each generation brings different skills and talents. For example, young professionals grew up in a high-tech world and have greater familiarity with business technology tools compared with their more mature counterparts, whereas more mature professionals often have exceptional interpersonal skills and perform well in environments in which traditional in-person communication is used.23 Hence different age groups have different skills in terms of computer use and communication. Age diversity is an important factor to be studied in team efficiency.
Gender diversity
In the past, women in the workplace were automatically assigned to temporary, part-time or low responsibility jobs because it was thought that their first priority was taking care of their families. In addition, there was a widespread belief that women were not as capable as men, either physically or mentally or emotionally. Today, organisations are slowly adjusting to treating women and men equally. Discriminating against female employees (in terms of hiring and advancement) as well as treating them in a sexual manner (sexual harassment) are now against the law.24
It has been suggested that gender-diverse teams perform better than single-gender teams for several reasons:
• Men and women have different viewpoints, and different skills for problem solving.
• A gender-diverse workforce provides easier access to resources, and wider industry knowledge.
• A gender-diverse workforce allows the company to serve a diverse customer base.
• Gender diversity helps companies attract and retain talented women.20
Gender diversity is an important factor which affects team efficiency and hence it should be measured.
Experience diversity
The concept of experience diversity is similar to that of informational diversity proposed by Jehn and Bezrukova25. Informational diversity has been measured by differences in education and functional area in the firm, such as position in the firm, major and level of education, or tenure.25 Hence, in this study, experience diversity is referred to as tenure in the software project teams.
Education diversity
Education diversity refers to differences among members on the basis of technical knowledge and perspectives brought to the group. For example, team members who have a bachelor's degree, master's degree or doctorate have different skills and different perspectives. Because these skills and perspectives can affect the team efficiency in different ways, education diversity should be evaluated to detect if it has an effect on team efficiency.
Simpson's Diversity Index
The Simpson Index was introduced in 1949 by Edward H. Simpson to measure the degree of concentration when individuals are classified into types. The same index was described again by Orris C. Herfindahl in 1950. The square root of the index had already been introduced in 1945 by the economist Albert O. Hirschman. As a result, the same measure is usually known as the Simpson Index in ecology, and as the Herfindahl Index or the Herfindahl-Hirschman Index in economics. As far as we know, it has not yet been used to measure diversity in teams, but is well suited to the concept of team diversity. Moreover, it is a reasonable and simple measure of diversity in teams, as shown in Equations 1 and 212:

where n is the total number of members of a particular species and N is the the total number of members of all species. The result is between 0 and 1, where 0 represents no diversity and 1 indicates maximum diversity.
Measuring team key performance indicators
As there are many criteria to measure the project performance of teams, it is important to determine which factors to use. Firstly, total time spent on the project by all team members ('project effort') is an important indicator to measure team performance. Secondly, 'productivity', which can be calculated by dividing the total time spent on the project by the number of team members, is also crucial to detect average performance. The third factor is the 'requirements completion ratio'. This ratio mainly calculates what percentage of the requirements can be satisfied at the end of the project. The last factor is the 'post-release defect density'. This indicator mainly focuses on the number of defects detected after the launch of the project. The total number of defects is divided by the number of team members to calculate the defect density. Each of these indicators and their calculations are explained in the following sections.
Project effort
Project effort is the total time spent on the software project by all of the team members. This total time should be that spent on only project-related activities during the life cycle of the project. Project-related activities are events in the software process life cycle for which effort data are collected and reported.
Activities that do not specifically contribute to the development and delivery of the software products are excluded from the calculation of project effort. For example, time spent on company-wide meetings, conferences, information seminars, and professional development training is excluded.18 The formulation of project effort is given in Equation 3:

where Working Hour is the working hours spent on project-related activities for team member i and N is the total number of team members.
Productivity
Productivity can be simply expressed as output over input. For software project teams, outputs can vary (e.g. lines of code, function points, feature points, use cases, objects).18 Also, the inputs can include many different factors such as labour hours, funds invested, etc. In this study, productivity can be calculated by Equation 4:

Requirements completion ratio
The requirements completion ratio measures the extent to which planned functional requirements were satisfied in the final product imple-mentation.18 It is calculated as in Equation 5:
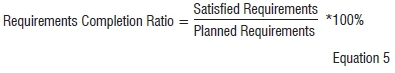
where 'planned requirements' is the number of requirements that were originally planned at the beginning of the project and those that were added or modified through negotiation with the user, and 'satisfied requirements' is the number of functional requirements that were satisfied in the delivered software product.
Post-release defect density
Post-release defect density is the number of unique defects per unit size discovered during the first 6 months after initial deployment of the software.18 It is calculated as in Equation 6:

Measuring team efficiency
As explained previously, there are four KPIs to be measured. These KPIs have different units. Also, efficiency should consider inputs as well as outputs because it signifies a level of performance that describes a process that uses the lowest amount of inputs to create the greatest amount of outputs. Efficiency relates to the use of all inputs in producing any given output, including personal time and energy. It is a measurable concept that can be determined by determining the ratio of useful output to total input. It minimises the waste of resources such as physical materials, energy and time, while successfully achieving the desired output. The usual measure of efficiency is shown in Equation 7:

However, this measure is often inadequate because of the existence of multiple inputs and outputs related to different resources, activities and environmental factors. Moreover, the units of these multiple outputs and inputs are generally different from each other. Therefore, it is not easy to calculate efficiency.
The DEA model allows relative efficiency measures as a result of multiple inputs and outputs. It is a linear programming based technique for measuring the relative performance of organisational units in which the presence of multiple inputs and outputs makes comparisons difficult.3 It was originally developed by Charnes et al.26 and Banker et al.27 It has been widely used to measure performance in many areas. A key advantage of DEA is that it easily accommodates both multiple inputs and multiple outputs.
A range of DEA models has been developed to measure efficiency and capacity in different ways. These models largely fall into the categories of input-oriented or output-oriented models. With input-oriented DEA, the linear programming model is configured so as to determine how much a firm could contract if inputs are used efficiently in order to achieve the same output level. Adenso-Diaz et al.28 used an input-oriented DEA model to assess the performance of the teams in a company and to estimate the relative efficiency scores of the projects. In their study, the project efficiencies were calculated based on three inputs - namely cost, duration and difficulty - and one output, namely project revenue.
In contrast, with output-oriented DEA, the linear program is configured to determine a firm's potential output given its inputs if it operated as efficiently as firms along the best practice frontier. Nazari-Shirkouhi and Keramati29 used an output-oriented DEA model for selecting the best fuzzy regression models among 16. In their study, these fuzzy regression models were considered to understand the relationship between customer satisfaction and new product design.
The following steps were followed in the DEA method:
• Determine the number of service units being compared in the DEA analysis.
• Determine the inputs and outputs.
• Evaluate the efficiency rating of the service units by DEA.
Based on this DEA analysis, team efficiency can be evaluated through input and output parameters. However, because of the structure of the problem, it is more appropriate to use an input-oriented approach as in Adenso-Diaz et al.28
Correlation between diversity and efficiency
The correlation coefficient is a statistical measure that indicates the extent to which two or more variables fluctuate together. A positive correlation indicates the extent to which those variables increase or decrease in parallel; a negative correlation indicates the extent to which one variable increases as the other decreases.30
The correlation coefficient can vary from +1 to -1. Values close to +1 indicate a high degree of positive correlation, and values close to -1 indicate a high degree of negative correlation. It can be calculated as in Equation 8:
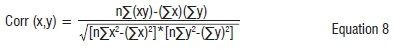
where x and y are the variables for which the correlation is to be determined.
In this study, the correlations between team efficiency and four diversity factors were calculated separately to determine which had the greater relation with performance.
Case study
The proposed model was applied to measure the correlation between different diversity factors and team efficiency at a bank's credit application development department. This department is developing a new banking package for the banking credit system within the .Net environment. In this department there are numerous teams dealing with different software development projects. For reasons of confidentiality, the name of the bank cannot be given, but the data can be revealed.
Five project teams were selected within the Credit Application Development Department as indicated below:
• Team 1: Retail Loans Team
• Team 2: Non-performing Loans Team
• Team 3: Revolver Loans Team
• Team 4: Instalment Loans Team
• Team 5: Loan Allocation Team
In addition, the age, experience, education and gender information of each member of each team was gathered from the Human Resources Department. The information required to calculate the performance of each team was also gathered.
Firstly, four diversity indices for each factor were calculated for all teams. Secondly, the performance of each team was measured according to four KPIs. Thirdly, based on these four KPIs, team efficiencies were measured using DEA. Lastly, the correlations of each factor with efficiency were analysed.
Measuring diversity index
In order to measure the diversity indices for age, gender, experience and education, the following criteria were applied.
• Team members were classified by age into three groups: young (those less than or equal to 30 years old); middle (those between 31 and 40 years old); and old (those older than or equal to 41 years old).
• Gender classification was female or male.
• Experience was categorised into three groups: working for less than 5 years; working for between 5 and 8 years; and working for more than 9 years. These years reflect the durations determined by the bank's Human Resources Department for promotions.
• Education was classified by bachelor's degree; master's degree; and doctorate.
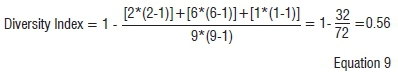
According to the diversity index formula given in Equation 2, diversity indices of each factor for each team were calculated and are given in Table 1.
For example, the age diversity index for Team 1 can be calculated as in Equation 9. Team 1 is composed of nine members of whom two are young, six are middle-aged and one is old.
Measuring key performance indicators
After calculating the diversity indices of each factor for each team, team performances were measured using the four KPIs: project effort, productivity, requirements completion ratio, and post-release defect density. For the sake of comparisons between teams, some assumptions were needed to sustain the uniformity and standardisation. The project period was assumed to be 180 days for each team. Starting and finishing dates of each project were assumed to be the same.
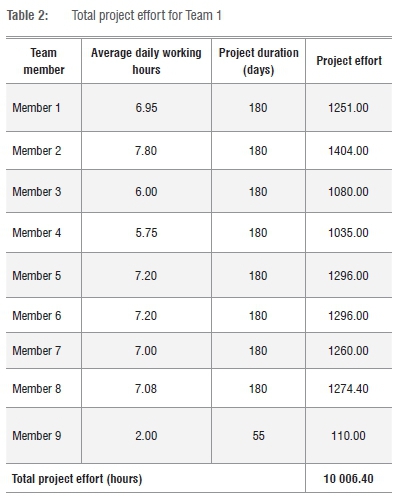
Project effort is the total time spent on the project by all team members. So, the average daily working hours of each team member on project-related activities is multiplied by 180 days to determine the total working hours spent on the project. Lastly, the summation of project efforts of all team members gives the total project effort. For example, total project effort for Team 1 is calculated as 10 006.40 hours and shown in Table 2.
By similar calculations, the total project efforts of all teams are given in Table 3.

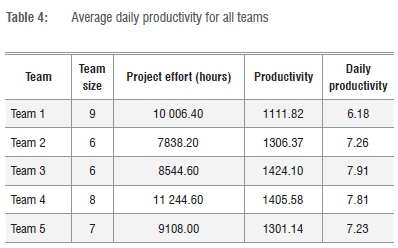
Productivity is the ratio of total project effort over the number of team members. This ratio gives the average working hours for each worker for project-specific activities. For example, Team 1 is composed of nine members and has a project effort of 10 006.40 working hours. So the productivity of Team 1 is calculated as 1111.8222. When this figure is divided by the number of days, average daily productivity can be determined; 6.18 in this example, as shown in Table 4.
The requirements completion ratio can be calculated by dividing the satisfied requirements over planned requirements. A high ratio reflects good customer satisfaction. For each of the project teams, the number of planned and satisfied requirements are recorded and given in Table 5.

For example, Team 1 had 252 planned requirements to complete at the beginning of the project. However, at the end, 251 of them were satisfied. Therefore, the requirements completion ratio for Team 1 is calculated as 99.60%.
Post-release defect density can be calculated by dividing the total number of defects detected within 6 months after launching the project by the number of team members. The defect density of each team member is shown in Table 6. For example, for Team 1, the total number of defects after release was 5041. Team 1 has nine members, therefore the post-release defect density is 560.11. Divided by 180 days, the average daily defect for each member of Team 1 is 3.11.

A comparison of the four KPIs of each of the five teams is given in Table 7.

Measuring efficiency of teams
In order to calculate the efficiency of each team using DEA, the daily available time of each team should be found. Although each team member can work 8 hours a day, they also have to deal with post-release defects. As 15 minutes is the accepted time spent for each defect in the bank in general, the time spent on post-release defects was assumed to be 15 minutes for each defect.
The calculated time spent for defects (in minutes) was converted into hours to compare daily work time (8 hours) and the time spent on defects. For example, for Team 1, the average daily defect for each member was 3.11 (Table 6). When multiplied by 15 minutes, the average daily time spent for each member of Team 1 is 46.65 minutes or 0.78 hours. Hence, the available daily maximum working hours per member of Team 1 is 7.22 hours as shown in Table 8.

In order to calculate the efficiency of each team by DEA, the service units being compared in the DEA analysis were determined as well as the input and output parameters (Table 9). MaxDEA 7 Basic x64 software was used to perform the DEA to evaluate the efficiency rating of all the teams by input-oriented choice; the results are shown in Table 10. These efficiency ratings were used to calculate correlations between efficiency and the various diversity indices.


Correlation between team diversity and team efficiency
The efficiency ratings for each team and the diversity indices of each factor for each team are summarised in Table 11. Correlation analyses were performed for each diversity factor against team efficiency to determine the correlation coefficients.

All diversity factors show a positive correlation with team efficiency. However, education diversity shows the highest correlation with efficiency. Therefore, in forming software development project teams, it is better to select employees with different educational backgrounds. In addition, gender diversity and experience diversity show a medium effect on team efficiency. Age diversity had the lowest effect on team efficiency.
Notably, Team 4 has the lowest diversity indices for all factors and their team efficiency is also low. This result highlights the importance of diversity among team members. Figure 2 summarises these results. We can conclude that software project teams should have a high degree of diversity. All team members differ in knowledge, social category and values. The importance of this diversity may be especially relevant for software development teams because software projects are complex and need different skills at different stages of the project.

Conclusion
This study focused on the relation between efficiency and diversity of software development project teams. Based on four diversity factors (age, gender, experience and education), a methodology was proposed to measure the diversity index using Simpson's formula. Four KPIs (project effort, productivity, requirements completion ratio and post-release defect density) were used to measure efficiency by DEA. Lastly, correlation analyses were performed to detect the relations between each diversity factor and efficiency, using five software development project teams at a bank's Credits Application Development Department as a case study. Based on the result of this real-life application, we conclude that the more diverse teams - with respect to the four selected factors - were more efficient, and thus more successful, in their software development projects.
Some inferences can be made with respect to the managerial implications of our findings. Project team managers should consider different kinds of diversity when forming their teams or hiring new employees in order to increase the team's efficiency. Moreover, managers should also support different training alternatives for their employees. The staff with diverse educational backgrounds can open new horizons for the company. Although homogeneity in the workforce may provide for a smoother working environment, greater diversity in teams enhances their efficiency. Managing diverse teams may include ensuring harmony between different team members.
Although there are other methods, using Simpson's Index to calculate the diversity index of teams is a novel approach in this research area. In addition, using DEA to measure the efficiency of teams was a new application.
This study could be improved by adding other kinds of diversity to the methodology. For example, the ability to motivate other people and the ability to communicate are also important characteristics in a team and their diversities can affect team efficiency. This methodology should also be applied to other types of teams to strengthen the results applicable to software development teams. If the findings in this study are also valid for other teams, then the results can be generalised.
Authors' contributions
S.A. was responsible for the methodology, validation, data collection, data curation, data analysis, sample analysis and writing the initial draft. M.B.A. was responsible for the conceptualisation, methodology, validation, data curation, critically reviewing the first draft and revisions, student supervision, project leadership and project management.
References
1. Liang T, Liu C, Lin T, Lin B. Effect of team diversity on software project performance. Ind Manage Data Syst. 2007;107(5):636-653. https://doi.org/10.1108/02635570710750408 [ Links ]
2. Ely RJ. A field study of group diversity, participation in diversity education programs, and performance. J Organ Behav. 2004;25:755-780. https://doi.org/10.1002/job.268 [ Links ]
3. Emrouznejad A, Parker RP, Tavares G. Evaluation of research in efficiency and productivity: A survey and analysis of the first 30 years of scholarly literature in DEA. Socio Econ Plan Sci. 2008;42(3):151-157. https://doi.org/10.1016/j.seps.2007.07.002 [ Links ]
4. Esty K, Griffin R, Schorr-Hirsh H. Workplace diversity. A manager's guide to solving problems and turning diversity into a competitive advantage. Holbrook, MA: Adams Media Corporation; 1995. [ Links ]
5. Green K, Lopez M, Wysocki A, Kepner K, Farnsworth D, Clark JL. Diversity in the workplace: Benefits, challenges, and the required managerial tools [document on the Internet]. c2002 [updated 2015 Oct; cited 2017 Nov 01]. Available from: https://edis.ifas.ufl.edu/pdffiles/HR/HR02200.pdf [ Links ]
6. Komaki JL, Minnich MLR. A behavioral approach to organizational change: Reinforcing those responsible for facilitating the climate and hence promoting diversity. J Organ Behav Manage. 2016;36(2-3):154-184. https://doi.org/10.1080/01608061.2016.1200514 [ Links ]
7. Konrad AM, Prasad P Pringle JK. Handbook of workplace diversity. Wiltshire, UK: SAGE; 2006. [ Links ]
8. Greenberg J. Diversity in the workplace: Benefits, challenges and solutions [document on the Internet]. c2004 [cited 2017 Nov 01]. Available from: http://www.multiculturaladvantage.com/recruit/diversity/diversity-in-the-workplace-benefits-challenges-solutions.asp [ Links ]
9. Marshall e-Learning Consultancy. Understanding equality and diversity in the workplace [document on the Internet]. c2015 [cited 2017 Nov 01]. Available from: http://marshalleleaming.com/blog/understanding-equality-and-diversity-in-the-workplace/#sthash.xtl1PUiU.dpuf [ Links ]
10. Fleming RK. Diverse problems call for diverse analyses and interventions in behavioral safety. J Organ Behav Manage. 2001;21(1):65-69. https://doi.org/10.1300/J075v21n01_05 [ Links ]
11. Podsiadlowski A, Gröschke D, Kogler M, Springer C, Van der Zee K. Managing a culturally diverse workforce: Diversity perspectives in organizations. Int J Intercult Rel. 2013;37:159-175. https://doi.org/10.1016/j.ijintrel.2012.09.001 [ Links ]
12. Simpson EH. Measurement of diversity. Nature. 1949;163:688. https://doi.org/10.1038/163688a0 [ Links ]
13. Shannon CE, Weaver W. The mathematical theory of communication. Urbana, IL: University of Illinois Press; 1949. [ Links ]
14. McIntosh RP. An index of diversity and the relation of certain concepts to diversity Ecology. 1967;48:392-404. https://doi.org/10.2307/1932674 [ Links ]
15. De Jong TM. A comparison of three diversity indices based on their components of richness and evenness. OIKOS. 1975;26:222-227. https://doi.org/10.2307/3543712 [ Links ]
16. Pitts DW, Wise LR. Workforce diversity in the new millennium: Prospects for research. Rev Public Pers Adm. 2009;30(1):44-69. https://doi.org/10.1177/0734371X09351823 [ Links ]
17. Lavy S, Garcia JA, Dixit MK. Establishment of KPIs for facility performance measurement: review of literature. Facilities. 2010;28(9-10):440-464. https://doi.org/10.1108/02632771011057189 [ Links ]
18. Kasunic M. A Data Specification for Software Project Performance Measures: Results of a Collaboration on Performance Measurement. Technical Report, 2008. CMU/SEI-2008-TR-012, ESC-TR-2008-012, Software Engineering Institute, Carnegie Mellon University, USA [ Links ]
19. Abernathy WB. Beyond the Skinner Box: The Design and Management of Organization-Wide Performance Systems. J Organ Behav Manage. 2014;34(4):235-254. https://doi.org/10.1080/01608061.2014.973631 [ Links ]
20. Badal S, Harter JK. Gender Diversity, Business-Unit Engagement, and Performance. J Leadersh Org Stud. 2013;21(4):354-365. https://doi.org/10.1177/1548051813504460 [ Links ]
21. Binder C. Integrating Organizational-Cultural Values With Performance Management. J Organ Behav Manage. 2016;36(2-3):185-201. https://doi.org/10.1080/01608061.2016.1200512 [ Links ]
22. Parmenter D. Key Performance Indicators: Developing, Implementing, and Using Winning KPIs. New Jersey, USA. John Wiley and Sons Inc., 2015. https://doi.org/10.1002/9781119019855 [ Links ]
23. Hopkins WE, Hopkins SA. Diversity Leadership: A Mandate for the 21st Century Workforce. J Leadersh Stud. 1999;5(3):129-140. https://doi.org/10.1177/107179199900500311 [ Links ]
24. Cundiff NL, Komarraju M. Gender Differences in Ethnocultural Empathy and Attitudes Toward Men and Women in Authority. J Leadersh Org Stud. 2008;15(1):5-15. https://doi.org/10.1177/1548051808318000 [ Links ]
25. Jehn K, Bezrukova K. A field study of group diversity, workgroup context, and performance. J Organ Behav. 2004;25(6):703-729. https://doi.org/10.1002/job.257 [ Links ]
26. Charnes A, Cooper WW, Rhodes E. Measuring the efficiency of decision-making units. Eur J Oper Res. 1978;2(6):429-444. https://doi.org/10.1016/0377-2217(78)90138-8 [ Links ]
27. Banker R, Charnes A, Cooper WW. Some models for estimating technical and scale inefficiencies in data envelopment analysis. Manage Sci.1984;30(9):1078-1092. [ Links ]
28. Adenso-Diaz B, Lozano S, Gutierrez E, Calzada L, Garcia S. Assessing individual performance based on the efficiency of projects. Comput Ind Eng. 2017;107:280-288. [ Links ]
29. Nazari-Shirkouhi S, Keramati A. Modeling customer satisfaction with new product design using a flexible fuzzy regression data envelopment analysis algorithm. Appl Math Model. 2017;50:755-771. [ Links ]
30. Devore JL. Probability and statistics for engineering and the sciences. 8th ed. Boston, MA: Richard Stratton; 2012. [ Links ]
 Correspondence:
Mustafa Ayhan
Email: batuhan.ayhan@marmara.edu
Received: 16 Sep. 2017
Revised: 01 Nov. 2017
Accepted: 13 Nov. 2017
Published: 27 Mar. 2018
FUNDING: None

