


Servicios Personalizados
Articulo
 Inglés (pdf)
 Articulo en XML
 Referencias del artículo
Indicadores

Links relacionados
-
 Citado por Google
 -
 Similares en Google
Compartir

 Permalink
South African Journal of Science
versión On-line ISSN 1996-7489
versión impresa ISSN 0038-2353
S. Afr. j. sci. vol.114 no.3-4 Pretoria mar./abr. 2018
http://dx.doi.org/10.17159/sajs.2018/20170134
RESEARCH ARTICLE
Water for sustainable development in the Berg Water Management Area, South Africa
Megan J. ColeI, II; Richard M. BaileyI; James D.S. CullisIII; Mark G. NewII
ISchool of Geography and the Environment, University of Oxford, Oxford, United Kingdom
IIAfrican Climate and Development Initiative, University of Cape Town, Cape Town, South Africa
IIIAurecon South Africa, Cape Town, South Africa
ABSTRACT
Water is fundamental to human well-being and economic growth. Measuring how water contributes to sustainable development is an important aspect of the United Nations Sustainable Development Goal (SDG) 6, 'Water and sanitation for all'. This importance is especially significant for water-scarce developing countries such as South Africa. Appropriate indicators can support decision-making and highlight key issues on inequality, unemployment and sustainability. In this paper, additional indicators for SDG 6.4 on water-use efficiency are proposed that focus on how individuals and households benefit, both directly and indirectly, from the allocations and use of water resources. The Berg Water Management Area (WMA) in the southwest corner of South Africa is used as a case study to illustrate the results. Residential per capita water use and municipal water losses were determined for all towns in the area. Figures for jobs and income per unit of water use were calculated for the heavily water-dependent industries, namely, agriculture, agriprocessing, freshwater aquaculture, mining and steel processing. This approach to measuring the socioeconomic benefits of water use are relevant for other countries seeking to measure the role that water plays in achieving inclusive sustainable development, and could be included in the final SDG 6 indicator suite.
SIGNIFICANCE:
• New measures of water-use efficiency based on jobs and income are proposed.
• New indicators are proposed for SDG 6.
• Water use, jobs and annual income are estimated for all heavily water-dependent sectors in the Berg WMA.
Keywords: SDGs; water-dependent jobs; Berg WMA; water-use efficiency
Introduction
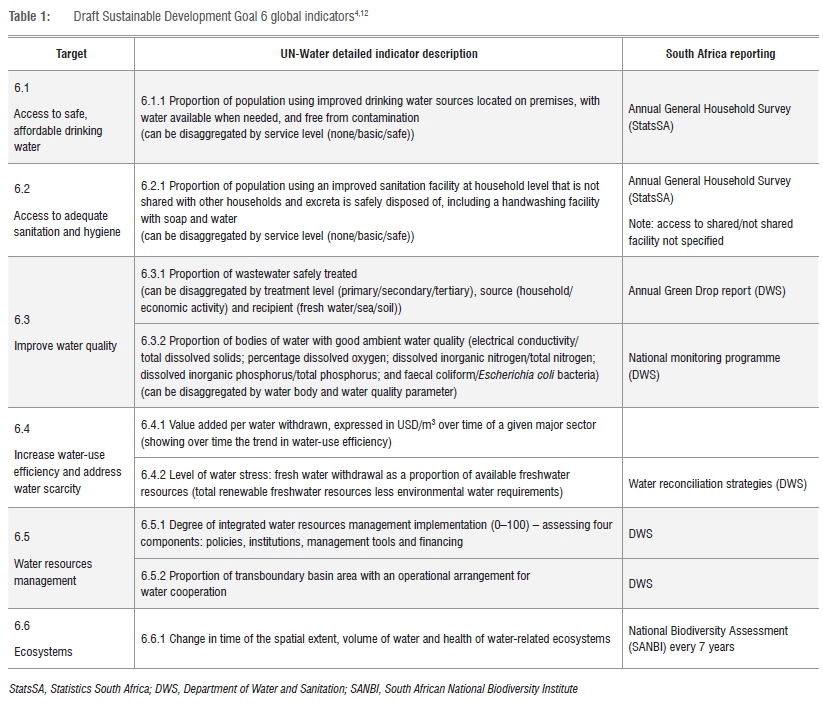
Since the approval of 'Agenda 2030 for Sustainable Development' and its Sustainable Development Goals (SDGs) by the United Nations (UN) General Assembly in September 20151, the UN Inter-Agency and Expert Group (IAEG) on SDGs has developed 241 global indicators across the 169 targets and 17 goals2. The SDGs build upon the Millennium Development Goals but have a much broader vision, seeking to end poverty and hunger, protect the planet from degradation, ensure prosperity for all, and foster peaceful, just and inclusive societies.1 Equity is at the heart of the SDGs and the aim is to 'leave no-one behind'. SDG 6 is summarised as 'Water and sanitation for all'. The six main targets cover access to safe drinking water (6.1), access to sanitation (6.2), water quality (6.3), water-use efficiency and scarcity (6.4), water resources management (6.5) and water-related ecosystems (6.6), while the means of implementation targets cover official development assistance (6.a) and participation of local communities in management (6.b). Nine global indicators have been defined by the IAEG for the main targets and IAEG, together with UN-Water, are developing indicator guidelines and methodologies to support national governments and to facilitate the sharing and comparison of data both within and across countries and over time.3 The methodologies are undergoing pilot testing to incorporate lessons learnt at the country level4 and the global indicators will be complemented by regional and national indicators developed by Member States1.
Achieving SDG 6 is important for other SDGs as water is a fundamental enabler of sustainable development and economic growth, is essential for food security, health and sanitation, and is a basic human right.5 Water resources are under pressure as a result of population growth, water-intensive economic growth, pollution and a changing climate.6 According to the International Food Policy Research Institute, under a business-as-usual scenario, 45% of the global gross domestic product (GDP), 52% of the world's population and 40% of grain production could be at risk as a consequence of water stress by 2050.7 The UN World Water Development Report 20167 estimated that 1.35 billion jobs are heavily water-dependent while 1.15 billion jobs are moderately water-dependent; thus 78% of the current global workforce depends on water for their livelihood.
SDG 6 is particularly important for South Africa. The water supply sector has become increasingly important for economic growth over the past three decades8 as surface water resources (72% of supply) are rapidly approaching full utilisation9. South Africa is one of the driest countries in the world with low and highly variable rainfall, erratic run-off and high evaporation.9 More than 60% of river flow arises from only 20% of the land area requiring large-scale inter-basin transfers.9 At the same time, poverty, unemployment and inequality are significant problems in South Africa: almost 46% of the population are unable to meet their basic needs10, the broad unemployment rate is 37%11 and the Gini index of income inequality is 0.65 - one of the highest in the world10. The relationships between water and development are therefore very important.
Table 1 shows current reporting in South Africa on the main six SDG 6 targets. The obvious gap appears in SDG target 6.4, which is, by 2030, substantially increase water-use efficiency across all sectors and ensure sustainable withdrawals and supply of fresh water to address water scarcity and substantially reduce the number of people suffering from water scarcity. Indicator 6.4.1 - which measures change in water-use efficiency over time - is of specific concern, which is not unsurprising as there is a lack of data globally in this area.7,12 In the most recent version of the step-by-step methodology for indicator 6.4.1, UN-Water define the indicator as 'the value added per water withdrawn, expressed in USD/m3 over time of a given major sector (showing over time the trend in water-use efficiency)'12.
Three major sectors are defined by the International Standard Industrial Classification of All Economic Activities (ISIC): agriculture, forestry and fishing (ISIC A), mining and quarrying, manufacturing, construction and energy (ISIC B,C,D,F) and all service sectors (ISIC 36-39, 45-99). The indicator assesses the impact of economic growth on water resource utilisation rather than water productivity.12 The South African Department of Water and Sanitation (DWS) does not measure water-use efficiency across sectors, although steps are being taken in this direction. In a recent study for the Berg Water Management Area (WMA) Resource Classification project13, the gross value add (GVA) was calculated for eight high-level industry sectors and for sub-sectors that benefit from aquatic ecosystems. However, GVA per volume of water used only covers one aspect of water-use efficiency, and focuses on businesses and industries. As people and equity are at the heart of the SDGs, it is important to also measure the degree to which water use benefits individuals and households and contributes to their development.
In this paper, additional indicators for SDG 6.4 on water-use efficiency are proposed, based on a case study of the social and economic benefits of water in the Berg WMA in South Africa. These are 'residential per capita water use', 'municipal water losses', 'heavily water-dependent jobs per volume of water used' and 'heavily water-dependent income per volume of water used'.
Context - the Berg Water Management Area
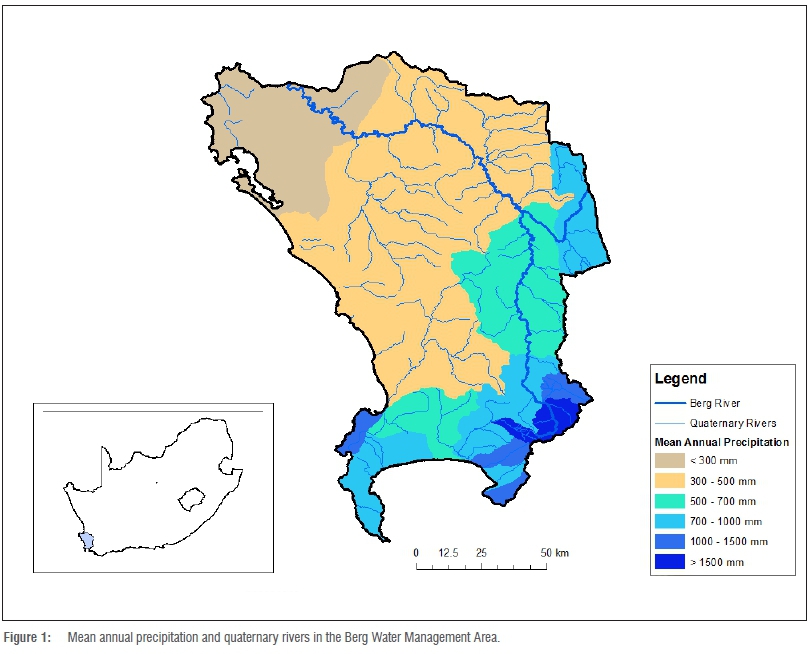
South Africa's national DWS previously divided the country into 19 Water Management Areas (WMAs), each containing a large river system.14 The Berg WMA, in the southwestern corner of the Western Cape Province, is named after the 285-km-long Berg River.15 Although it is now part of the Olifants-Berg WMA (one of nine new WMAs established in 2013), it is still referred to as such in government assessments.13 Rainfall ranges from over 3000 mm/a in the southeast mountains to less than 300 mm/a in the west and northwest coastal plain (Figure 1). The natural mean annual run-off (MAR) is 1094 million cubic metres per year (Mm3/a) -2.2% of the national total, although the present day mean annual run-off is 784 Mm3/a; 65 Mm3/a of groundwater resources are being utilised.13 The Falkenmark indicator for the Berg WMA is 193 cubic metres per person per year (m3/c/a) compared with 921 m3/c/a for South Africa (using Census 2011 population figures), thus classifying both areas as water scarce. The Berg WMA is home to the Cape Fynbos, a unique floral kingdom with World Heritage status, and the Berg River Estuary, which is of major conservation importance for birdlife.16
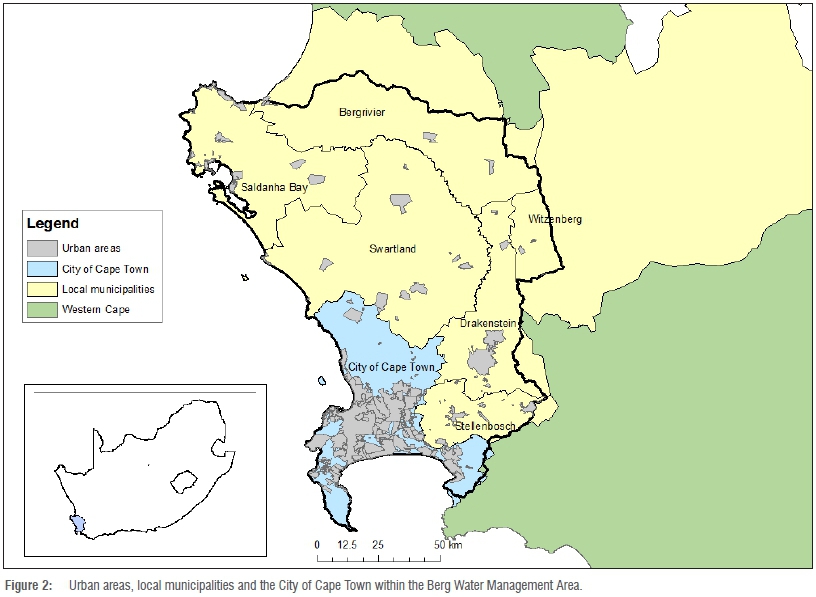
The Berg WMA includes the City of Cape Town metropole, the southern part of the West Coast district municipality and the western part of the Cape Winelands district municipality. There are 45 towns in the Berg WMA situated within six local municipalities (LM): Saldanha Bay LM (97% urban), Swartland LM (72% urban), Drakenstein LM (85% urban), Stellenbosch LM (77% urban), the southern half of the Bergrivier LM (60% urban) and the western corner of Witzenberg LM (54% urban) (Figure 2). Over 4.5 million people live in the Berg wMa, with 87% being in the City of Cape Town.17 In the Berg WMA, 79% of people have access to piped water in their dwelling and 92% have access to a flush toilet, compared with national figures of 46% and 57%, respectively.
The City of Cape Town contributes 71% of the Western Cape Province's GDP and is an important contributor to the economic growth in the area.18 Economic activity in the Berg WMA is diverse; it includes tourism, agriculture, wine-making, food processing, manufacturing, fisheries, commercial forestry, financial services, ITC, nuclear power generation, hydropower generation and port operations.13 The Saldanha Bay Industrial Development Zone, a Special Economic Zone, aims to be a world-class marine engineering hub focused on the international oil and gas sector and related services and support industries.19
The Berg River is a heavily utilised system with an annual water demand of 690 Mm3/a, which is shared between residential and industrial users (52%), irrigation (43%) and afforestation and alien vegetation (5%).13 The Western Cape Water Supply System serves 74% of the Berg WMA requirements (12)13 and facilitates water transfers between rivers, including from the Breede-Gouritz WMA to the Berg River. Demand in the Western Cape Water Supply System is expected to exceed supply in the year 2022, although plans are in place to increase supply through the Berg River-Voëlvlei Dam augmentation, large-scale water re-use, large-scale Table Mountain Group Aquifer development, and desalination of seawater.20 The increasing cost of water may constrain economic growth in the future.21
Methods
The proposed SDG 6.4 indicators 'residential per capita water use', 'municipal water losses', 'heavily water-dependent jobs per cubic metre of water used' and 'heavily water-dependent income per cubic metre of water used' are described below.
Residential per capita water use
Measuring residential per capita water use addresses both water-use efficiency and equity. The National Water Act of 199822established the basic human needs reserve, which has been defined as 25 litres per capita per day (L/c/d) or 6000 litres per household per month. The World Health Organization recommends a minimum of 50 L/c/d for basic health, and 100 L/c/d in a country like South Africa with high TB and HIV/Aids rates.23 Residential water-use data are not publicly available, but municipal water accounts for all towns in the Berg WMA24-28 and the City of Cape Town were obtained for this study. The municipal accounts report bulk water supply, treated water supply, water losses, and water use by sector. The water use excludes the water losses so is a fairly accurate measure of end-use. The residential per capita water use was calculated using residential use data for the audit year July 2011 to June 2012 and Census 2011 population data, collected by Statistics South Africa (StatsSA) in October 2011, and stored in the SuperCross database.17 In the case of Jamestown and Raithby, the DWS All Town Studies29,30 were used as these towns do not have their own municipal accounts. For the privately owned De Hoek mine village, the Riebeek West mine village residential per capita use figure was used.
Municipal water losses
Reducing water losses is a focus area for water-use efficiency strategies. Municipal water use accounts record the physical losses of raw water through bulk distribution and water treatment (i.e. the difference between raw water and treated water supply) and the losses of treated water through internal distribution (i.e. the difference between treated water supply and billed metered consumption). Most towns in the Berg WMA receive treated water, therefore the water losses quoted are for internal distribution only.
Water-dependent jobs and income
Water-use efficiency implies maximising output per unit of water. This output could be measured as gross value added, income or jobs. A few attempts have been made to determine water-use efficiency in the Western Cape and the Berg WMA.13,31,32 These attempts have been limited to a single sector (agriculture or agriprocessing) or to general industry categories such as 'Agriculture, Hunting, Forestry and Fishing' and 'Manufacturing', which include jobs with a wide range of water dependence. Using the general industry categories does not allow analysis of heavily water-dependent jobs, moderately water-dependent jobs, and jobs in other sectors. This challenge is addressed in this paper by using the microdata provided by StatsSA in the Census 2011 '10% sample' which provides employment figures for 263 different industry variables. The census data also provide the income bracket for each job. By combining water-use data and census data, 'jobs per million cubic metres water used in heavily water-dependent sectors' and 'total annual income per cubic metre water used in heavily water-dependent sectors' can be calculated.
The national census of 2011 was conducted in October 2011 for all 51 770 560 South African residents.33 All persons aged 15 and older were asked about their employment status, employment industry and occupation. Unfortunately, the industry and occupation data are not included in StatsSA's SuperCross database. Instead, StatsSA has provided the Census 2011 '10% sample', which includes anonymised data for individuals in about 10% of all households and collective quarters. StatsSA do not provide publicly available information on how the sampling was done but it is understood that they did systematic sampling on the households and then included individuals from the selected households. The '10% sample' includes (among many other variables) the employment industry, occupation, income and local municipality for individuals.
In the Berg WMA, the '10% sample' includes 132 564 employed people -8.4% of the actual employed population. For this study, the 263 industry variables were grouped into sub-sectors related to their dependence on water as defined by the UN.7 Agriculture, forestry, inland fisheries, mining and resource extraction, energy and water supply, agriprocessing, and manufacturing of textiles are defined as heavily water-dependent sectors. Manufacturing/transformation of wood products, rubber, plastics, metals and chemicals, and construction and transport are defined as moderately water-dependent sectors. All other sectors have low water dependence. Using the 10% sample, the percentage of jobs in each heavily water-dependent and moderately water-dependent sector were calculated per municipality. Here, the ratio of sector jobs to total jobs in the '10% sample' and the total number of jobs in the full Census 2011 were used to estimate the actual number of jobs per sector and municipality. The income of each worker was aggregated to calculate a total annual income per sector and municipality. As income is reported as an income bracket, not actual income, the median income of the bracket specified per person was used. The minimum and maximum total annual income were also calculated using the lower and upper ranges of the specified bracket. The income results will be underestimates as they exclude 6% of jobs with 'unspecified' income.
Further analysis of water-dependent jobs is limited by water-use data. The municipal accounts record water use for industrial/business/ commercial, municipal, farm and 'other' sectors, but the exact industries and sub-sectors are unknown. The DWS database of all registered water use - called Water Authorisation Registration and Management System (WARMS) - specifies 11 water-use sectors: irrigation, livestock watering, aquaculture, industry urban, industry non-urban, other urban, mining, power generation, water supply service, recreation and schedule 1. It also records customer name, water source and geographical location, which enables identification of the sector in most cases and the municipality. In this study, the latest WARMS database was obtained from DWS in April 2016. A total of 6089 registered water uses in the Berg WMA were analysed and the total WARMS water volumes for the heavily water-dependent sectors (agriculture, freshwater aquaculture, mining and agriprocessing) were calculated for each municipality. Power generation was excluded as the operations do not use fresh water. In addition, grey literature on heavy water users in the Berg WMA was reviewed to determine the water use and workforce. This review identified steel processing in Saldanha34 as a major water user.
The jobs and income analysis from the '10% sample' was combined with the water use analysis to calculate best estimates for the five heavily water-dependent sectors for the two indicators 'jobs per volume water used' and 'total annual income per volume water used'. The details for each sector are described below.
Agriculture
There are 2540 active registered water uses for irrigation and 89 for livestock watering in WARMS, with total water allocations of 387 650 971 m3/a and 3 715 023 m3/a, respectively. In addition, towns supply 1 304 352 m3/a to farms. The total annual water use for agriculture is therefore 392 670 356 m3/a. There are 4314 jobs in the '10% sample' with industry variables for 'crop farming', 'animal farming', 'mixed farming', 'agricultural and animal husbandry services' and 'organic fertiliser production'. As this is 3.3% of jobs in the 10% sample, it was estimated that there were 40 465 jobs in agriculture in 2011. Jobs and income were analysed for the six LMs and the City of Cape Town.
Freshwater aquaculture
There are 16 active registered water uses for freshwater aquaculture in WARMS with a total of 2 404 565 m3/a. They are located near Paarl, Franschhoek and Tulbagh and are likely to be for trout farming in mountain streams. There are 19 jobs in the '10% sample' with the industry variable for 'fish hatcheries and fish farms' located in the Drakenstein and Witzenberg LMs. As this figure is 0.1% of jobs in the 10% sample, it was estimated that there were 42 690 jobs in freshwater aquaculture in 2011. Jobs and income were analysed for the two LMs.
Mining
There are only two mines in the Berg WMA, both operated by PPC Ltd: De Hoek Mine in the Bergrivier LM and Riebeek West Mine in the Swartland LM. Together they have a registered water use of 1 276 526 m3/a in WARMS and a workforce of 400 in their limestone mines and cement factories.35 The PPC mines have associated mine villages, which are recorded as separate main places (towns and suburbs defined for census collection) in Census 2011 with 324 employed people. One can assume that all these people work on the mine sites. There are 61 quarries in the Berg WMA36, but there is very limited information on their water use and jobs. In WARMS, there are seven registered water uses for quarries, ranging from 6000 m3/a to 134 000 m3/a, although the designation is usually 'industry urban' and not 'mining' so it is uncertain what the water is used for. The '10% sample' under-samples mining and quarrying with only two employed persons in Bergrivier LM and eight in Swartland LM. It is assumed that the two mine villages were not included in the sample. Given these constraints, the jobs and income analysis was limited to the two PPC mine villages, but extrapolated for the additional PPC mine employees who live off-site.
Steel processing
Saldanha Works, part of ArcelorMittal South Africa, is an export-focused steel plant near the Saldanha port that produces 1.2 Mt/a of hot rolled coil from iron ore. The plant has 568 employees.37 It does not appear in WARMS so it was assumed that it uses municipal water from Saldanha Bay LM. It consumes 8 million litres of water per day34 - 2920 million litres per year or 2 920 000 m3/a. Each employee therefore benefits from 5157 m3/a or 14 128 litres per day. Therefore, there are 195 jobs per million cubic metres per year. As the employees cannot be identified in the census records, no income analysis could be done.
Agriprocessing
Agriprocessing is a combination of different activities that transform agricultural products into useable items. The Western Cape Department of Agriculture provides the location and name of all agriprocessing facilities in the province in its online tool, CapeFarmMapper.38 The Berg WMA has 12 red meat abattoirs, 8 white meat abattoirs, 129 agriprocessing plants, 137 dairies, 5 fruit packers, 4 cool chain facilities, 117 packhouses and 591 cellars - a total of 1003 agriprocessing facilities. In 2015, the Western Cape Department of Environmental Affairs and Development Planning (DeA&DP) assessed the water use of seven priority agriprocessing sectors - fruit juice, wine and brandy, olive oil, essential oils, dairies, poultry abattoirs and livestock abattoirs - using CapeFarmMapper, a literature review and interviews.32 Based on a limited sample size, they estimated the water use of each sector in litres per unit. The WARMS database also provides information on water use, and for this study 57 active registered water uses were assessed, totalling 5 896 885 m3/a for 1 brewery, 1 tannery, 7 food and beverage producers and 23 wine cellars. As neither source covers all agriprocessing facilities, a literature survey was undertaken to fill in any gaps to estimate total annual water use per sub-sector per municipality.
For breweries, the single brewery WARMS licence and an estimated average water use of 385 m3/a for 60 craft breweries39 based on production figures40 and SABMiller's figure of 8.55 litres of water required to produce one litre of beer41 were used. For wine cellars, production figures42 and DEA&DP's estimate of 3.9 litres of water use per litre of wine produced were used. For dairies, production figures43 and DEA&DP's estimate of 3.6 litres of water per litre of dairy product were used. For food and beverage processing, the average water volume for the six plants in WARMS was multiplied by the number of plants in CapeFarmMapper. For tanneries, the single WARMS licence of 55 000 m3/a was used. For white meat abattoirs, the number of abattoirs in CapeFarmMapper, an average number of birds per facility, and DEA&DP's estimate of 16.7 litres of water per bird were used. For red meat abattoirs, the number of abattoirs in CapeFarmMapper, an average number of animals per facility, and an estimate of 50 litres of water per animal were used. All these figures exclude the water required to farm or transport the required agricultural inputs - both food and pastures. All the figures have significant uncertainty because of the very limited data on actual water use in individual agriprocessing facilities and therefore averages were used extensively.
Overall, 3594 agriprocessing jobs with the industry variables 301 to 306 in the six LMs and the City of Cape Town in the census '10% sample' were analysed. These jobs make up 3.9% of jobs in the 10% sample; therefore, there were an estimated 40 340 jobs in agriprocessing in 2011 in the Berg WMA.
Results
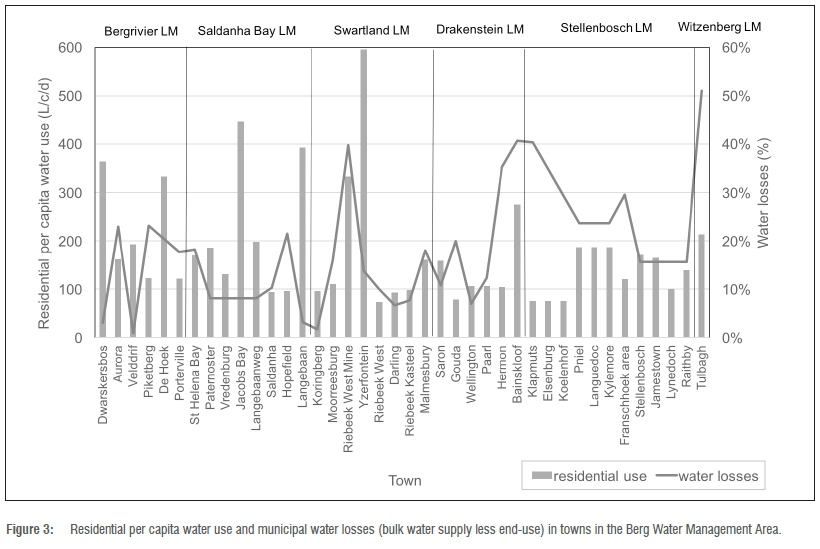
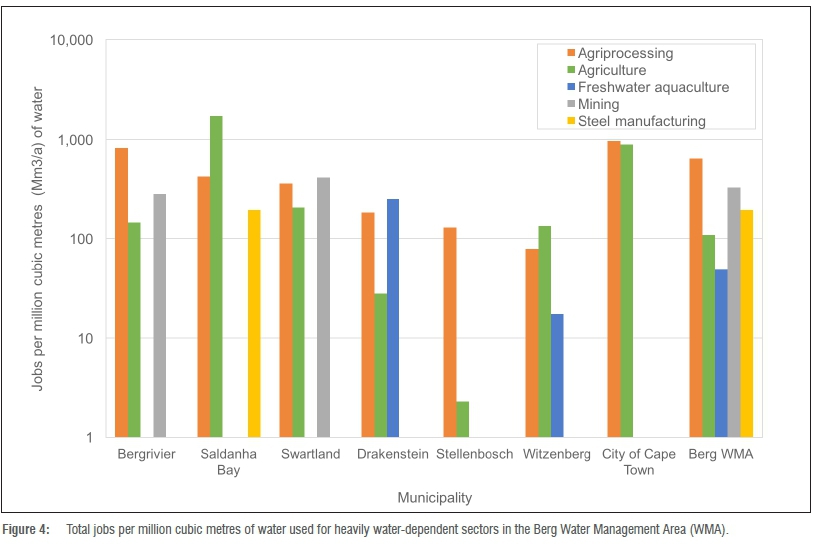
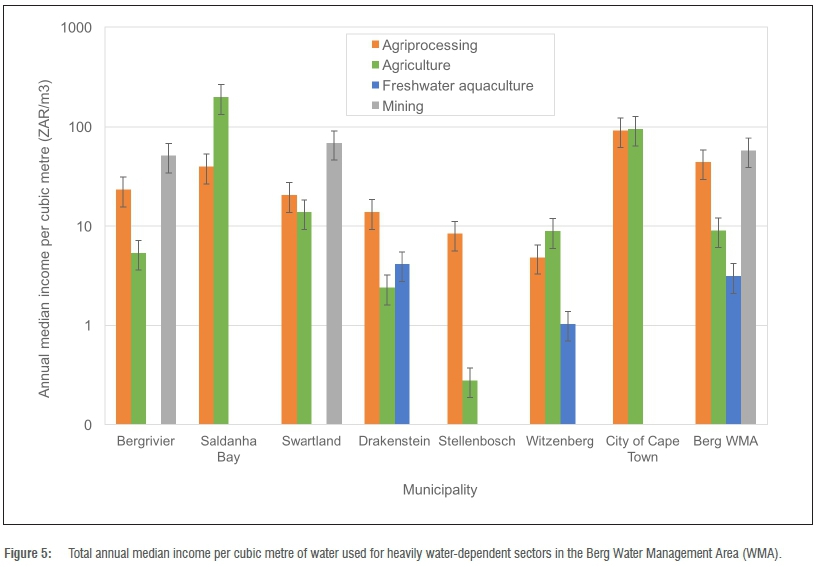
Table 2 provides summarised data for the four indicators described above for the Berg WMA and its municipalities, while Figure 3 plots residential water use and water losses at the town level, highlighting local variability. Figure 4 and Figure 5 show comparisons for estimated 'jobs per million cubic metre of water use' and 'median income per cubic metre of water use', respectively, among heavily water-dependent sectors across municipalities in the Berg WMA. Figure 5's error bars show that income could range from the lower to the upper end of the census income brackets. The underlying town- and municipal-level data used in the figures are provided in the supplementary material (Supplementary tables 1-6).
In addition, Supplementary table 7 provides municipal-level data for moderately water-dependent jobs per sector. These results show that, although at the municipal level residential water use is within the targetedn range, 11 towns are below the recommended minimum target of 100 L/c/d and 6 towns are above the proposed maximum target of 300 L/c/d. Similarly, although municipal-level water losses are all below 20%, they can reach over 50% at the town level. Residential per capita water use ranges significantly from 73 L/c/d (in Riebeek West) to 596 L/c/d (in Yzerfontein) and water losses range from 1% (in Velddrif) to 51% (in Tulbagh) at town level. The jobs and income vary significantly across municipalities and sectors but, overall, agriprocessing produces the most jobs (634 jobs/Mm3) while mining produces the most income per unit of water used (ZAR57.52/m3). The City of Cape Town and Saldanha Bay LM produce the most jobs and income per unit of water used.
Discussion
In this study, data on residential water use, municipal water losses, and jobs and income per unit of water used have been determined for the Berg WMA, its six local municipalities and its metropole, the City of Cape Town. These data have provided a case study for potential additional indicators to measure water-use efficiency in SDG 6.4. They have also provided an insight into the variability that can be found at different spatial scales and levels. This approach supports the SDG requirement to disaggregate data by geographical location and other factors.
Water-use efficiency and equity through jobs and income
South Africa faces the 'triple challenge' of poverty, unemployment and inequality. Despite significant progress on social development since 1994, there has been little improvement in these three areas.44 One of the main aims of this paper was to expand the concept of water-use efficiency to include jobs and income, and thus include individuals and households into efficiency considerations. Unfortunately, currently available water data are not sufficient to calculate accurate figures for jobs and income per unit of water, although the results provide the most comprehensive assessment to date and illustrate how these figures can be calculated in the future. The analysis would be greatly improved if StatsSA released the full industry Census 2011 data set (rather than only the 10% sample) and if heavy water users were required to report their annual water use figures. Accurate water-use data are most needed for agriculture and agriprocessing.
Water allocations to heavily water-dependent sectors create jobs and provide an income for the employees. The results show that 9% of jobs in the Berg WMA are heavily dependent on water and 16% are moderately dependent on water. This is largely influenced by the City of Cape Town, which accounts for 87% of the population, and water-dependence is much higher in the more rural Bergrivier LM (50% heavily dependent, 9% moderately dependent) and Swartland LM (31% heavily dependent, 11% moderately dependent). The biggest heavily water-dependent user by far is irrigated agriculture, followed by food processing, although there is significant uncertainty in the water-use data for agriprocessing. The jobs analysis shows that agriprocessing produces the most jobs per volume water used in the Berg WMA at 633 jobs/Mm3, followed by mining (326 jobs/Mm3), steel processing (195 jobs/Mm3), agriculture (109 jobs/ Mm3) and aquaculture (49 jobs/Mm3). The figures can vary significantly across municipalities within agriculture (from 2 to 1712 jobs/Mm3) and agriprocessing (from 79 to 965 jobs/Mm3). This variation is as a result of the diversity in the type of farming and crops farmed, and diversity in the type of agriprocessing facility. Water allocation decisions therefore should be made for specific sub-sectors and regions rather than for agriculture or agriprocessing as whole sectors. The two sectors are also directly linked so that the water allocated to agriculture supports jobs in both agriculture and agriprocessing.
The income analysis shows that mining produces the highest income per cubic metre of water used in the Berg WMA at ZAR57.52/m3, followed by agriprocessing at ZAR43.73/m3, agriculture at ZAR9.07/m3 and freshwater aquaculture at ZAR5.20/m3. Again, there is significant variation across the municipalities and significant uncertainty in the agriprocessing figures. Comparing the income analysis to the jobs analysis shows that some sectors, like mining, generate a few high-paying jobs, while other sectors, like agriculture, generate many lower-paying jobs. The water allocated to each sector therefore has different benefits and outcomes for the socio-economic well-being of the area. While jobs and income measure the benefit of water allocation to individual people, it is important to also measure the gross value add of different sectors as this measures the benefit to the region and the country through economic growth and indirectly to poverty reduction through social grants and service delivery.
The allocation of water resources to different areas and sectors will influence the potential for job creation and economic growth in the region. As the population grows and water resources come under increasing pressure, creating jobs with low dependence on water may become a priority or necessity. This change may have a positive relative impact on the City of Cape Town, as it is dominated by the low water use service industry, but a negative relative impact on small towns that rely on heavy water users like agriculture and mining. Water allocation decisions therefore must consider the long-term future of all residents. This consideration will require much better data collection on water use, employment and income in different sectors, GIS-based tools to facilitate spatial analysis, scenario development to analyse possible effects of different water allocation decisions, and stakeholder engagement with affected communities and businesses.
SDG 6 indicators and data disaggregation
While SDG 6.4.1 on water-use efficiency is described by the IAEG and UN-Water as 'the value added per water withdrawn in USD/m3 over time of a given major sector (showing over time the trend in water-use efficiency)', this description only covers one aspect of water-use efficiency and focuses on businesses and industries. In this paper, the focus is on people and social development - examining how the allocation and use of water resources benefit individuals and households. For this reason, additional SDG 6.4 indicators are proposed on residential water use, and jobs and income per unit of water used by different industries. An indicator on water losses is included as it affects the water supply available to households. SDG indicator 6.4.1 is a new indicator with no pre-existing data or experience, hence no target has been set by the IAEG, and UN-Water argues that 'its strongest meaning appears when its values are compared over time'12. Comparing the data for the four additional indicators described in this paper would produce useful insights into the change in allocation and use of water in the Berg WMA over time. This comparison would require a similar analysis of Census 2001 and the annual town water use accounts for the 2001/2002 period.
A requirement of the SDGs is that data are disaggregated by gender, race, geographical location and other context-specific factors so that inequality is measured in all its forms. The IAEG propose that SDG 6.1 and 6.2 could be disaggregated by service level (safe/basic/none) (see Table 1), but they could also be disaggregated by geographical location, race and gender. The SDG 6.4 indicators proposed in this study can be disaggregated by geographical location, as illustrated. The jobs and income indicators can be disaggregated by race, gender and income bracket, if the individual census data records in the 10% sample are used. This analysis would be very useful in showing who in society is benefitting most from water used by agriculture and industry.
Data visualisation of water for sustainable development
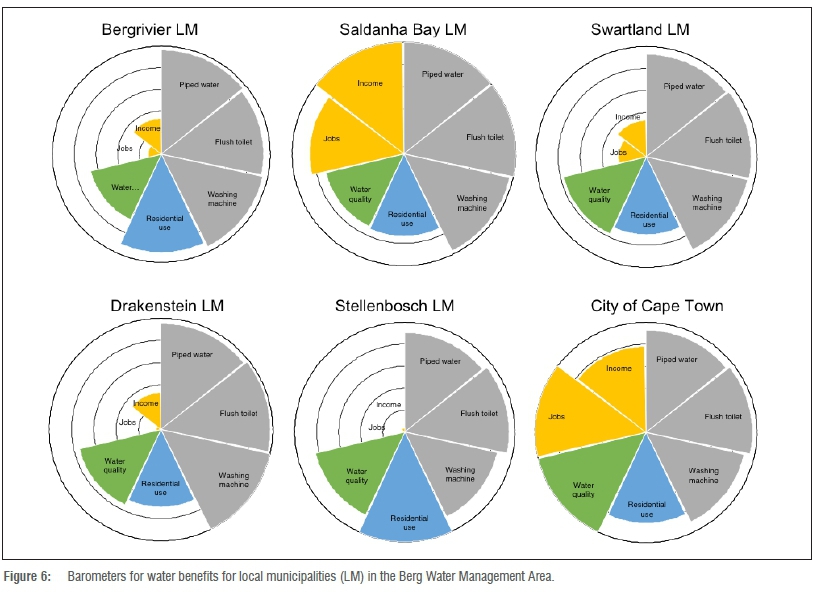
The Sustainable Development Knowledge Network has developed and published a SDG Index to visualise the annual SDG status of each country.45 They use a radar plot for each country to compare progress on the 17 goals, and to compare countries. The outer limit of the radar plot represents the highest score achieved by any country measured. SDG 6 is included as a single wedge in the radar plot. There would be value in developing a similar radar plot for SDG 6 itself to show comparative progress towards the individual targets. The data gathered in this case study are used to illustrate what this plot may look like. Figure 6 plots drinking water access in dwellings (SDG 6.1), household access to a flush toilet (SDG 6.2), drinking water quality (Blue Drop Score, 0-100), household ownership of a washing machine, jobs per million cubic metres of water used (proposed SDG 6.4), and income per cubic metre of water used (proposed SDG 6.4) in the municipalities of the Berg WMA. The underlying data are provided in Supplementary table 8. All these indicators relate to the direct and indirect individual benefits of water resources and their allocation and use in the region. This plot is a powerful visual tool that can quickly highlight variations and inequalities in social well-being and access to natural resources. Figure 6 shows that there is very little variation in access to drinking water and sanitation but significant variation in water-use efficiency across the Berg WMA. Thus, although most people have access to piped water, they do not all have access to the benefits of water resources. This variation can entrench social inequalities and hinder sustainable development.
Conclusion
Measuring how water contributes to sustainable development is an important goal of the SDGs, particularly for a water-scarce developing country such as South Africa. Appropriate indicators can support decision-making and highlight key issues on inequality, unemployment and sustainability. In this paper, additional indicators for SDG 6.4 on water-use efficiency are proposed that focus on how individuals and households benefit from allocations and the use of water resources. The results for the Berg WMA, in the southwest corner of South Africa, show a significant range in water-use efficiencies which have important implications for water allocation decisions. By making water-use efficiency about people as well as industries, the question of the equity of water allocations is raised.
This approach to measuring the socio-economic benefits of water use is relevant for other countries seeking to measure the role that water plays in achieving inclusive sustainable development, and could be included in the final SDG 6 indicator suite.
Acknowledgements
This research was funded by the School of Geography and the Environment, University of Oxford. We thank the following people for their assistance with data collection: Jaco Human at iX engineers; Cornelius Riemann at Umvoto; Claire Pengelly and Pieter Janse van Vuuren at GreenCape; Helen Seyler at delta-h; Lynn Woolfrey and Takwanisa Machemedze at DataFirst UCT; Jane Turpie, Marthinus van der Walt and Jacob Muller at UCT; Jacyntha Twynam and Julius Okinor at WesGro; and Kersti Hickley and Leandre September at the City of Cape Town. We also thank John Dearing and the two anonymous reviewers for their helpful review.
Authors' contributions
M.J.C. was responsible for the conceptualisation, methodology, data collection, data analysis, data curation, writing the initial draft and writing revisions; R.M.B. was responsible for the conceptualisation, student supervision and writing revisions; J.D.S.C. was responsible for the conceptualisation, methodology and writing revisions; and M.G.N. was responsible for the conceptualisation, student supervision and writing revisions.
References
1. United Nations General Assembly. Transforming our world: The 2030 agenda for sustainable development. New York: United Nations General Assembly; 2015. [ Links ]
2. IAEG-SDGs. Tier classification for global SDG indicators [document on the Internet]. c2016 [cited 2017 Mar 27]. Available from: https://unstats.un.org/sdgs/files/meetings/iaeg-sdgs-meeting-05/Tier_Classification_of_SDG_ Indicators_21_Dec_2016.pdf [ Links ]
3. United Nations Water. Integrated monitoring guide for SDG 6: Targets and global indicators. Geneva: United Nations Water; 2016. [ Links ]
4. United Nations Water. How to use the Integrated Monitoring Guide for SDG 6 (draft 20 April 2016). Geneva: United Nations; 2016. [ Links ]
5. United Nations General Assembly. Resolution adopted by the General Assembly on 28 July 2010 64/292. The human right to water and sanitation [document on the Internet]. c2010 [cited 2016 Nov 02]. Available from: https://www.un.org/es/comun/docs/?symbol=A/RES/64/292&lang=E [ Links ]
6. United Nations High Level Panel on Water. UN High Level Panel on Water action plan [document on the Internet]. c2016 [cited 2016 Nov 02]. Available from: https://sustainabledevelopment.un.org/HLPWater [ Links ]
7. United Nations World Water Assessment Programme. The United Nations World Water development report 2016: Water and jobs. Paris: UNESCO; 2016. [ Links ]
8. Burrows LR, Botha AFP Explaining the changing input-output multipliers in South African: 1980-2010. In: Proceedings of the Biennial Conference of the Economic Society of South Africa; 2013 September 25-27; Bloemfontein, South Africa. Pretoria: Economic Society of South Africa; 2013. p. 1-33. [ Links ]
9. South African Department of Water Affairs (DWA). National Water Resource Strategy June 2013. 2nd edition. Pretoria: DWA; 2013. [ Links ]
10. South African Department of Planning, Monitoring and Evaluation (DPME). Development indicators 2014. Pretoria: DPME; 2015. [ Links ]
11. Statistics South Africa. Statistical release P0211: Quarterly Labour Force Survey - Quarter 4: 2016. Pretoria: Statistics South Africa; 2017. [ Links ]
12. United Nations Water. Step-by-step monitoring methodology for Indicator 6.4.1 on water-use efficiency. Version 2017-03-10 [homepage on the Internet]. c2017 [cited 2017 June 28]. Available from: http://www.sdg6monitoring.org/news/indicators/641 [ Links ]
13. South African Department of Water and Sanitation (DWS). Determination of water resource classes and associated resource quality objectives for the Berg Catchment. Status quo. Pretoria: DWS; 2016. [ Links ]
14. South African Department of Water Affairs and Forestry (DWAF). National Water Resource Strategy. Pretoria: DWAF; 2004. [ Links ]
15. South African Department of Water Affairs and Forestry (DWAF). National Water Resource Strategy: Appendix D. Pretoria: DWAF; 2004. p. D.1-D19.4. [ Links ]
16. South African Department of Water Affairs and Forestry (DWAF). Proposal for the establishment of the Berg Catchment Management Agency. Pretoria: DWAF; 2007. [ Links ]
17. Statistics South Africa. SuperCross census 2011. Version 1. Pretoria: Statistics South Africa; 2016. [ Links ]
18. Western Cape Provisional Treasury. Municipal economic review and outlook 2016. Cape Town: Western Cape Provincial Treasury; 2016. [ Links ]
19. Saldanha Bay Industrial Development Zone [homepage on the Internet]. c2017 [cited 2017 Feb 20]. Available from: http://www.sbidz.co.za [ Links ]
20. South African Department of Water and Sanitation (DWS). Support to the continuation of the Water Reconciliation Strategy for the Western Cape Water Supply System (WCWSS): Status report October 2014. Pretoria: DWS; 2014. Available from: https://www.dwa.gov.za/Projects/RS_WC_WSS/Docs/WCWSSStatus Report Oct2014 Final.pdf [ Links ]
21. Seyler H. Water as a constraint on economic development: 2014-2015 Research project progress report. Cape Town: GreenCape; 2015. [ Links ]
22. Republic of South Africa. National Water Act. Act No 36 of 1998. [ Links ]
23. Howard G, Bartram J. Domestic water quantity, service level and health. Geneva: World Health Organisation; 2003. [ Links ]
24. Worley Parsons. Bergrivier Municipality annual WSDP performance and water services audit report for 2014/15. Cape Town: Bergrivier Municipality and Worley Parsons; 2015. [ Links ]
25. Worley Parsons. Drakenstein Municipality annual WSDP performance and water services audit report for 2014/15. Cape Town: Drakenstein Municipality and Worley Parsons; 2015. [ Links ]
26. Worley Parsons. Saldanha Bay Municipality annual WSDP performance and water services audit report for 2011/2012. Cape Town: Saldanha Bay Municipality and Worley Parsons; 2012. [ Links ]
27. Worley Parsons. Stellenbosch Municipality annual WSDP performance and water services audit report for 2010/211. Cape Town: Stellenbosch Municipality and Worley Parsons; 2012. [ Links ]
28. Worley Parsons. Swartland Municipality annual WSDP performance and water services audit report for 2014/15. Cape Town: Swartland Municipality and Worley Parsons; 2015. [ Links ]
29. South African Department of Water Affairs (DWA), Umvoto. Reconciliation strategy for Jamestown. Pretoria: DWA; 2008. [ Links ]
30. South African Department of Water Affairs (DWA), Umvoto. Reconciliation strategy for Raithby. Pretoria: DWA; 2008. [ Links ]
31. South African Department of Water Affairs (DWA). First level monitoring and status quo assessment for monitoring water allocation reform in South Africa. Pretoria: DWA; 2013. [ Links ]
32. Western Cape Government. Water infrastructure and opportunities for agriculture and agri-processing in the Western Cape. Cape Town: Western Cape Government Department of Environmental Affairs and Development Planning; 2015. [ Links ]
33. Statistics South Africa. Census 2011 metadata report no. 03-01-47. Pretoria: Statistics South Africa; 2012. [ Links ]
34. ArcelorMittal. ArcelorMittal Saldanha Works Analyst visit [document on the Internet]. c2011 [cited 2016 Dec 02]. Available from: http://www.arcelormittalsa.com/InvestorRelations/Presentations.aspx [ Links ]
35. PPC. PPC Investor site visit Western Cape 25 March 2011 presentation [document on the Internet]. c2011 [cited 2016 Oct 12]. Available from: http://ppc.co.za/investors/Investor-westernCape1.pdf [ Links ]
36. South African Department of Minerals and Energy (DME). Operating mines and quarries and mineral processing plants in the Republic of South Africa, 2006. Pretoria: DME; 2006. [ Links ]
37. ArcelorMittal. Saldanha Works overview [document on the Internet]. c2016 [cited 2016 Dec 01]. Available from: http://www.arcelormittalsa.com/Operations/SaldanhaWorks/Overview.aspx [ Links ]
38. Western Cape Department of Agriculture. CapeFarmMapper 2.0 [homepage on the Internet]. c2016 [cited 2016 Nov 09]. Available from: http://gis.elsenburg.com/apps/cfm/ [ Links ]
39. CraftBru. Map of SA craft breweries [homepage on the Internet]. c2017 [cited 2017 Feb 04]. Available from: http://craftbru.com/breweries/south-africa/map/ [ Links ]
40. Brown J. The rise of the craft breweries. City Press [Internet]. 2016 Feb 05; Available from: http://city7press.news24.com/Business/the7rise7of7the7craft?breweries?20160205 [ Links ]
41. SABMiller, WWF-UK. Water footprinting: Identifying and addressing water risks in the value chain. Woking, UK: SABMiller Plc and WWF-UK; 2009. [ Links ]
42. South African Wine Industry Statistics (SAWIS). 2016 SA wine industry statistics Nr 40. Paarl: SAWIS; 2016. [ Links ]
43. South African Department of Agriculture, Forestry and Fisheries (DAFF). A profile of the South African dairy market value chain. Pretoria: DAFF; 2014. [ Links ]
44. Cole MJ, Bailey RM, New MG. Tracking sustainable development with a national barometer for South Africa using a downscaled "safe and just space" framework. Proc Natl Acad Sci USA. 2014;111(42):E4399-1408. http://dx.doi.org/10.1073/pnas.1400985111 [ Links ]
45. Sachs J, Schmidt-Traub G, Kroll C, Durand-Delacre D, Teksoz K. SDG Index & dashboards - Global report. New York: Bertelsmann Stiftung and Sustainable Development Solutions Network (SDSN); 2016. [ Links ]
 Correspondence:
Megan Cole
Email: meganjcole@gmail.com
Received: 28 Apr. 2017
Revised: 24 Aug. 2017
Accepted: 29 Oct. 2017
Published: 27 Mar. 2018
FUNDING: University of Oxford

