


Services on Demand
Article
 English (pdf)
 Article in xml format
 Article references
Indicators

Related links
-
 Cited by Google
 -
 Similars in Google
Share

 Permalink
South African Journal of Science
On-line version ISSN 1996-7489
Print version ISSN 0038-2353
S. Afr. j. sci. vol.114 n.3-4 Pretoria Mar./Apr. 2018
http://dx.doi.org/10.17159/sajs.2018/20170155
REVIEW ARTICLE
Sclerotinia sclerotiorum disease prediction: A review and potential applications in South Africa
Lisa A. Rothmann; Neal W. McLaren
Department of Plant Sciences, University of the Free State, Bloemfontein, South Africa
ABSTRACT
Sclerotinia sclerotiorum is a predominant plant pathogen, with host crops of agricultural and economic importance internationally. South African host crops of importance include canola, soybean and sunflower, which contribute significantly to the South African economy. This significance emphasises the importance of effective disease management strategies, including rotation with non-host crops, planting cultivars with a degree of tolerance, and using relevant cultural and chemical practices. The sporadic nature of disease outbreaks caused by Sclerotinia spp. can complicate fungicide application timing as a result of the pathogen's interaction with the host and environment. The use of prediction modelling for diseases caused by Sclerotinia spp. can contribute to increased fungicide application efficacy and a reduction in the number of unnecessary sprays. Predictive modelling is based upon the collection and statistical analysis of multi-locality and multi-seasonal, pathogen, disease and weather data. Incorporating the complexity of disease initiation and development into such models is dependent on selecting the correct statistical tools to interpret appropriate data, which can be used to develop a model that is accurate, precise and reliable. Internationally, forecasting models for diseases caused by Sclerotinia spp. exist and are applied commercially for multiple Sclerotinia spp. on important agricultural crops. The application of these models in a South African context has been limited but provides promise for effective disease intervention technologies. This review provides a platform to raise awareness of the potential applications of plant disease epidemiology and the use of statistics and mathematical modelling in agricultural systems. Plant disease forecasts are an important part of the future for sustainable and economically viable agronomic decisions.
SIGNIFICANCE:
• Optimisation of plant disease management through ensuring that fungicide applications coincide with disease-favourable conditions, thus targeting the disease more strategically.
• The use of mathematical and statistical models to quantify the interactions among the host, pathogen and environment and predict future outbreaks of the disease.
• The study of temporal and spatial interactions among the host, pathogen and environment on plant disease behaviour.
Keywords: Sclerotinia spp.; prediction models; plant disease epidemiology; fungicides; economic optimisation
Introduction
Sclerotinia sclerotiorum Lib. (de Bary) has the potential to cause disease in more than 400 plant species.1 Internationally, economically important host crops of S. sclerotiorum include canola, dry bean, lettuce, peanut, soybean and sunflower.2 In South Africa, primary risk crops are soybean and sunflower, with an increasing risk in canola.3 The most prominent sign of Sclerotinia spp. is white cottony mycelium growing on infected plant tissues, with subsequent production of large melanised hyphal masses, called sclerotia. Symptoms associated with Sclerotinia diseases include a watery soft rot or wilting that can cause the collapse and death of host plants.2
Yield losses caused by S. sclerotiorum, particularly on canola in Sweden, the United Kingdom and Germany, may reach between 50% and 70%.4,5 Canola is the third most valuable crop in Canada, where production has been severely affected by S. sclerotiorum.6In sunflowers, Sclerotinia head rot has been responsible for USD200 million damage annually in America.1 In 2003, an estimated loss of USD1.9 million in the state of North Dakota (United States of America) was incurred as a result of Sclerotinia white mold on dry bean.7 In South Africa during 2014, the effects of Sclerotinia stem rot of canola gained more attention as a consequence of the greater prevalence of the disease during that season compared to previous years.8 Sunflower and soybean epidemics causing up to 60% severity and 65% yield losses, respectively, were recorded in South Africa over the 2013/2014 season.9
The economic importance of many of the crops affected by Sclerotinia spp. emphasises the importance of effective disease management strategies. Management of these diseases through rotation with non-host crops is limited by the extensive host range and duration of survival of sclerotia in soil. Agronomic management decisions - such as cultivar selection, proper irrigation management, planting dates and plant density - can also contribute to lowering disease severity.4,10,11 The use of tillage practices in fields previously infested with S. sclerotiorum, to manage diseases caused by S. sclerotiorum, remains a point of contention.9Coniothyrium minitans is used as a biological control agent for fields previously infested with S. sclerotiorum, and is commercially available in South Africa.9 However, timely fungicide applications, at critical host growth stages, can provide the most effective prevention measure for Sclerotinia diseases. Currently, there are a limited number of preventative registered active ingredients in South Africa for fungicide use on peas and sunflower; these include benomyl and procymidone.12 However, the cost of fungicides and their application in addition to the potential need for multiple applications are constraints to the wider use of chemical control.3,8,9
The development of statistical or mathematical models for the management of plant diseases, through providing decision tools for prophylactic intervention and timely applications of fungicides, is based upon understanding the spatial and temporal aspects of plant disease epidemics. The sporadic nature and seasonal variation in Sclerotinia diseases complicates the development and validation of forecasting models. Current applications of disease models include forecasting disease initiation and severity, crop losses, pathogen dispersal and the timing of intervention technologies.13 This review provides a platform to indicate the potential of predictive models for S. sclerotiorum in a global context and to promote economically viable Sclerotinia management strategies in South Africa.
Epidemiology of diseases caused by Sclerotinia spp.
Sclerotinia sclerotiorum infection of plants is largely driven by environmental variables which affect sclerotium survival and ascospore production.2 In order to understand interactions within and among variables vital for the generation of effective disease prediction, a discussion of these determinants must precede a review of disease prediction models.
Formation and germination of sclerotia
A key life-cycle component of S. sclerotiorum is the sclerotium, the primary survival propagule. The prevention of formation, survival or germination of sclerotia is a primary disease control strategy.14 Significant variation among S. sclerotiorum strains and, thus, varying sclerotial development and germination responses among strains, has been recorded.15 However, in South Africa, low recombination frequencies have been recorded and strong similarities between isolates within and across provinces has been reported, suggesting that the population is young and developing.16 Sclerotia can survive in the soil for 3 to 10 years. However, their survival is dependent on numerous factors, including Sclerotinia species, sclerotial size and shape, soil type and chemistry, soil microbial populations likely to degrade sclerotia, previous crops planted and climatic conditions.4,16-19 Sclerotia have two germination mechanisms which initiate the processes of plant infection: carpogenic germination and myceliogenic germination.1 These processes allow the pathogen to act as an air- and soil-borne pathogen, respectively.20 The complex nature of influences causing either carpogenic or myceliogenic germination has not been determined absolutely and, thus, confounds progress in research and model development.
Carpogenic germination
Carpogenic germination of sclerotia results in stipe initiation followed by apothecia formation, responsible for ascospore release.1 As a result, airborne inoculum is produced, facilitating the spread to, and the infection of, aerial tissues of host plants. Forcible discharge of ascospores is thought to be as a result of moisture tension, and atmospheric relative humidity (RH) fluctuations, allowing ascospores to travel distances ranging from 10 mm to over 100 m.1,21 Thus, ascospores are not only found in the field in which the host crop is produced or infected.16,18 Preconditioning of sclerotia is required to activate dormant sclerotia to germinate carpogenically. The duration of optimum conditions and variation among factors influencing preconditioning have resulted in the requirements for preconditioning being based on general assumptions. For example, it is assumed that sclerotium preconditioning usually occurs during winter or the non-cropping season.2 In most cases, freezing is non-essential, although temperatures between 4 °C and 20 °C are sufficient to trigger carpogenic germination.2
The interaction between RH and air temperature is pivotal to the formation of apothecia, while soil temperature and moisture influence sclerotial germination responses.1,11 Atmospheric temperatures ranging from 5 °C to 25 °C with high RH (not quantified in the literature cited) for approximately 10 days promote the development of apothecia.2,18 When RH is at an optimum and air temperatures are >30 °C or <5 °C, increased incubation time and reduced carpogenic germination rate have been recorded, despite optimum RH.19 Soil temperatures <10 °C and >35 °C significantly reduce sclerotial survival and carpogenic germination. Soil moisture >30% is favourable for apothecia formation.2,11 Sclerotia in the upper 20 mm to 30 mm of the soil profile are regarded as competent epidemiologically; stipes at a depth >30 mm are rare under natural conditions, and stipes deeper than 30 mm cannot reach the sunlight needed for apothecial development.11 Soil moisture in the upper 30 mm varies greatly as a result of surface weather conditions, notably air temperature, RH and wind as well as the growth stage of the crop. The latter is related to crop canopy density - a denser canopy increases RH and, therefore, soil moisture in the top 30 mm.18 Cook et al.22 found that sclerotia at >30 mm burial depths remained under exogenous dormancy, largely because of reduced soil moisture fluctuations which served as an anti-sclerotium germination stimulus.
The total time required for the formation of stipes to the initial dispersal of ascospores is approximately 3-1 weeks.7 Once released, ascospores are viable for approximately 17 hours but, if conducive conditions are not present, host tissue infection will not occur.23 Larger sclerotia produce greater numbers of apothecia and, thus, greater amounts of ascospores.2 Sunflower head rot and canola and soybean stem rot are driven by carpogenic germination.24,25
Myceliogenic germination
Myceliogenic germination forms hyphae and mycelium from sclerotia, and is responsible for the direct sub-terrain infection of host plants, resulting in basal stem rots. The maximum distance between sclerotia and the host plant for infection to occur is 20 mm.26 Colonisation of organic matter as an energy source, for the formation of mycelium and subsequent infection, is considered the germination trigger.16,18
Sclerotinia sclerotiorum regulates myceliogenic germination through sclerotial melanisation.1 Incompletely melanised sclerotia are prone to reduced survival as a result of increased microbial degradation, sensitivity to adverse conditions and the absence of dormancy.1,24 Myceliogenic germination will occur when a minimum of 12 hours of moderate temperatures (20-25 °C) with high RH (>80%) occurs.2,27 However, drying of sclerotia prior to higher soil moisture is known to trigger germination.18 Soil moisture fluctuations between 30% and 100% field capacity promotes myceliogenic germination and host infection. Myceliogenic germination plays a major role in the disease cycle of Sclerotinia sunflower basal stalk rot and wilt and soybean basal stem rot.24,25
Infection process
Infection by ascospores occurs most frequently once flowering has commenced, as petals provide an exogenous source of nutrients and a path to infection. However, infection may take place before flowering on mechanically damaged or necrotic tissues.28 Approximately 48-72 hours of continuous leaf wetness, RH >85% and temperatures of 2025 °C are required for infection by ascospores.5,18 However, infection by ascospores and subsequent disease development have been recorded at RH as low as 25% and soil moisture of 30%.2,29 Mycelium is more tolerant to desiccation than ascospores and thus is more tolerant at lower RH.7 Once infection has been initiated, S. sclerotiorum has the ability to remain inactive (latent) in host tissue in the absence of free moisture, resulting in delayed or arrested lesion development until favourable moisture levels re-occur.30
It is evident that survival, inoculum production and infection of plants by S. sclerotiorum involves numerous stimuli and pathogen responses to weather conditions, agronomic activities and host growth stages during critical phases of pathogen survival and growth. These variables need to be considered during model development to ensure the accuracy and precision of disease predictions.
Prediction models used for Sclerotinia spp.
In Europe, the management of Sclerotinia stem rot in winter canola is based on prophylactic fungicide sprays at full bloom as resistant cultivars are not available.31 However, field experiments between 1981 and 2004 indicated that fungicide sprays were only 27-33% cost-effective.31
Bearing in mind the high cost of chemical applications, especially in view of the cost of procimydone within South Africa, this level of fungicide efficacy causes significant economic risk to producers.12 The introduction of Sclerotinia risk assessment methods can benefit producers through the identification of intervention thresholds for optimising the timing of management strategies.32 Models used to forecast diseases caused by Sclerotinia spp. vary in complexity from relatively low input point system models to more complex, multivariate systems. The following is a brief overview of the types of models, their applications and potential uses in a South African context.
Risk point systems
Risk point systems for diseases caused by Sclerotinia spp. have been developed for canola in Canada33, Germany34 and Denmark35. Prediction using the risk point system of Ahlers34, for example, provided an accuracy of approximately 60% with a prevailing overestimation of disease incidence. An overestimation of disease risk will result in the unnecessary applications of fungicides and, thus, yield the model redundant. A similar Swedish risk point system was evaluated and calibrated to yield the model presented in Table 1.4

The Swedish risk point system was developed for spring sown canola in Sweden, using field-specific weather parameters and agricultural production practice data.4 The only input requiring routine effort is the regional risk analysis for apothecium development, for which naturally produced sclerotia are placed in canola fields during spring, and monitored weekly to record the average number of apothecia developing from 100 sclerotia in each region.
The principle of risk point models is that potential answers are allocated weighted points based on the relationship between each risk factor and disease severity as observed in field evaluation trials. The Swedish risk point model evaluates fields at canola growth stage 65, i.e. flowering. The factors 'number of years since last oilseed rape crop' and 'disease incidence in last host crop' take sclerotial build-up and survival into consideration and thus primary inoculum pressure; 'crop density' takes into account the canopy microclimate; 'rain in the last 2 weeks' and 'weather forecast' take into account meso-climate; and 'regional risk for apothecium development (per 100 sclerotia)' provides the model with the risk of primary inoculum in specific regions. The points are totalled, and a fungicide application recommendation is made. If risk points are <40 then a fungicide application is not recommended. The area of unknown risk is between 40 and 50 points. If the risk points are >50 then a severe incidence of canola Sclerotinia stem rot is expected, and spraying is recommended. Twengstrom et al.4 evaluated the accuracy of the risk point system at multiple sites over two seasons. The model correctly identified 75% of fields that required fungicide application. A 16% error occurred in which spraying was recommended but was not required.
During a 4-year trial, Foster et al.36 monitored carrot crops, microclimate and pathogen variables in Canada to identify variables associated with white mold onset. Based on the relationships among variables and the number of apothecia/ascospores, the percentage of soil surface coverage by canopy growth (CG), mean daily soil moisture potential (soil matrix potential, SMP), and daily maximum or mean soil temperature (ST) were selected to develop algorithms to predict inoculum and, thus, disease risk. Crop closure at 100%, when one or two plants had collapsed leaves and 70-80% of plants were senescing, activated the forecasting system as a critical crop threshold was met. Initial apothecia observations were always after canopy closure, explaining the percentage soil surface shade in Table 2. The soil matrix potential and ST were included as microclimate factors as they were highly correlated (p=0.01) with initial ascospore occurrence (Table 2). The contribution of each level of selected crop and climate factors for any given day was described on a risk point system on a scale of zero to three - the higher the value, the higher the contribution to risk.

The risk algorithms were constructed to generate 7-day severity index values (SDSi). The models were as follows:
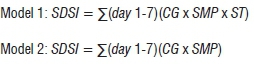
Once the crop threshold had been satisfied, the critical microclimate thresholds were the mean daily SMP of -40 kPa and mean ST of <25 °C. Model 2 is ideal for situations in which soil temperature data cannot be readily obtained, as they are excluded from the model.
Foster et al.36 were able to reduce the number of fungicide applications, without compromising the degree of control provided, by using the calendar-based applications using Model 1. Model 1 was made available to Ontario carrot producers in 2006, therefore only Model 1 risk levels are discussed. Risk levels were as follows: (1) those in which the SDSI ranged from 0 to 32, ascospores were present but less than critical threshold for disease development, thus risk was present but management was not required; (2) SDSI ranged from 33 to 44 and ascospores were present and greater than critical threshold, thus the risk of disease was present and intervention could be required; (3) SDSI ranged from 45 to 63 and ascospore numbers were greater than critical threshold, indicating disease management practices should be applied as disease was likely to develop. Within-field ascospore numbers were measured on plates containing amended potato dextrose agar (PDA) selective to Sclerotinia species, as spore traps. The plates were placed on the bed of the carrot crop canopy for three consecutive hours in the mornings at each sampling site. The critical threshold was set at 10 colony forming units (CFU) per plate.37
The model developed by Foster et al.36 is based on the same risk point premise as that of the Swedish risk point system; however, it takes into account more specific microclimate quantifications and the use of ascospore monitoring. The development of the algorithm was dependent on environmental variables being measured within a distance of 4.7 km from each field, and the authors suggested a limit of 5 km for the effective application of the models. A limitation, however, of both Models 1 and 2 is that of the labour-intensive and time-consuming process (approximately 3 days delay) of collecting and counting the CFUs, potentially resulting in the window of opportunity for fungicide applications being missed.37
The advantages of using relatively simple risk point tables to forecast when to apply fungicides are that they are easy to utilise by growers, have a quick and effective result distribution, are an inexpensive system and this method does not require the use of elaborate scientific equipment. This forecasting method allows for planning and cost-effective management in the agricultural industry.4
Prediction models based on petal infestation
Gugel and Morrall32 identified a positive linear relationship between percentage petal infestation (PPI) of early bloom canola crops by asco-spores of S. sclerotiorum and disease incidence (DI), although the regression R values, an indicator of the goodness of fit of the model, were generally low. The model was based on the assumption that petal infestation reflects inoculum potential. Infected petals were found even when apothecia were not observed, indicating that extrinsically produced inoculum could also be recorded using this method.32,38
A forecast was derived from a prediction curve associated with the above regression model, where <45% mean percentage petal infestation (MPPI) corresponded with a low risk of disease, i.e. <20% mean disease incidence (MDI); 45-90% MPPI indicated moderate disease risk associated with a 20-40% MDI, and high disease risk correlated with MPPI > 90% i.e. MDI >40%.6 In subsequent trials, Turkington et al.6 re-evaluated this relationship and the feasibility of using PPI as a forecasting tool in canola fields in Canada from 1985 to 1990. During the study, crop canopy density and timing of flowering were identified as valuable variables to determine MPPI, and thus MDI. They used arcsine-transformed MDI (TMDI) to meet the assumptions required for the regression analysis:

where Y=TMDI, β0= intercept, β1= slope, X1 = MPPI and e = error.
Canola canopy density was assessed qualitatively by rating crops as light, moderate or heavy in canopy. The inclusion of the canopy density correctly forecasted 73% of the disease risk over a 6-year period. However, the general tendency was that forecasting for disease risk below 45% was the most accurate.41 The assumption of moisture being related to crop canopy density proved limiting, and the inclusion of weather data and sampling throughout the flowering period was to be followed in future studies to allow for more reliable and accurate forecasting of disease risk.6
Turkington and Morrall39 speculated that petal infestation and disease risk may fluctuate in relation to changing conditions during flowering as a result of canopy density. Canopy density was quantified by measuring crop height, stem thickness, percentage light penetrated and leaf area index. Weather variables included temperature, RH and leaf wetness. Each of the canopy density variables correlated significantly with MDI. Assessments of petal infestation were conducted during early, full and late bloom; the MDI was significantly positively correlated with petal infestation at full and late bloom, and accounted for 98% of the variation in TMDI. This was associated with the increase in RH, daily leaf wetness, and the amount and pattern of rainfall during canopy closure, indicating that the relationship between MPPI and MDI is defined by the weather conditions during flowering. The addition of these variables to the existing model correctly forecasted disease incidence in 73% of 343 crops studied over a 6-year period. Disease incidence that was underestimated or overestimated in any field could be explained by the changes in PPI in below or above average canopy densities over the flowering period. The inclusion of petal infestation levels over the duration of the flowering period, as well as canopy density, increased the forecasting accuracy to 99%. Research conducted by Del Rio40 supported the above model as weather conditions and the effect of crop microenvironment ultimately determine the relationships between disease incidence and petal infestation. This is correlated to the presence of sclerotia in the upper 20-30 mm of the soil profile, which are affected by the canopy microclimate.11
Canola flowers are most susceptible to infection by S. sclerotiorum when diurnal fluctuations - in RH, temperature and wind - occur and flowers have been fully opened for at least 2 days but are not near the point of wilting.6 In the evening RH increases, while RH decreases during the day; increasing temperature and wind speed also result in a decrease in RH. These fluctuations affect the release of ascospores, but if the reduction in RH is too great, the 'drought effect' could decrease ascospore release. Wet petals or petals collected prior to heavy rain could result in an underestimation of disease because of the requirement of moisture for the release of ascospores.6 Late bloom infections could prove a limitation to the model, as disease would have advanced and caused significant yield losses, thus fungicide applications would not be an advantage to producers. Furthermore, the abscission of leaves and resultant changes in the canopy density and microenvironment could halt stem infection. However, fungicides applied after early bloom may not be economically viable and, thus, late bloom infections may be associated with the risk of reduced fungicide efficacy. Further limitations may include equipment cost and expertise for monitoring equipment at multiple assessments, the variation in the ability of farmers to monitor variables associated with canopy density accurately and weather variables at infection. Thus, the use of a qualitative checklist including 'overcast, frequent rainfall and moderate temperatures' provided an indication of the risk of canola stem rot and thus the application of fungicides, but not a definitive forecast of when disease would be present in the field.39
Bom and Boland41 found that the inclusion of soil moisture (SM) with petal infestation provided a stronger prediction model than petal infestation alone. The best prediction was achieved when a critical soil moisture content (SMc') of -10 or -15 kPa was used in combination with petal infestation data. Fields with greater disease incidence (>20%) and a lower critical SMc' had the greater number of correct predictions of disease risk, in contrast to fields with limited disease incidence (<20%) in which disease risk was predicted correctly in fewer fields.36,41
Petal infestation, in canola crops, was recorded in various regions of Switzerland over 10 years, but severe Sclerotinia stem rot was observed only in years in which air temperature >12 °C between early and full bloom (growth stages BBCH 61 to 65).42 This temperature threshold was believed to account for the poor correlation between the infection of petals with S. sclerotiorum and the severity of disease recorded in previous studies. Gladders et al.43 evaluated the incidence of Sclerotinia on petals of canola in England. Inoculum was considered limiting for disease development. In other areas, petal infestation was much greater (>50% was the threshold) and subsequent Sclerotinia stem rot incidence warranted disease control measures. Analysis of data (personal observation, Gladders et al.43) indicated an exponential relationship between petal infestation (X) and Sclerotinia stem rot severity (Y) where Y = 0.44X171 (R = 0.78).
Initial studies to determine the incidence of petal infestation were dependent on grow-out tests on amended Sclerotinia selective PDA medium.44,45 More recently, PPI quantification has been based on serological46,47 and polymerase chain reaction (PCR) methods48, and commercial test kits are available. The PPI model developed by Gugel and Morall32 and amended by Turkington and Morrall6,39 is a practical on-site model which farmers can conduct and apply themselves as Sclerotinia selective PDA kits and instructions are provided.
Prediction models based on carpogenic germination
Sclerotinia sclerotiorum causes lettuce drop which, in England, accounted for GBP9.5 million in losses at the farmgate in 2001.11 A model to forecast disease risk using carpogenic germination of sclerotia was developed and evaluated.49 This model is dependent on soil temperature and soil water potential as independent variables. The temperature components take into account temperature effects on sclerotia pre-conditioning for carpogenic germination. The assumption is that sclerotial pre-conditioning is a prerequisite for carpogenic germination and thus implied disease risk.11
The rates of pre-conditioning and germination were represented as follows:

where Rc is the rate of conditioning; T is soil temperature; and a, b and k are constants.
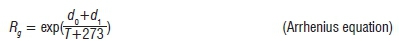
where Rg is the rate of sclerotium carpogenic germination; d0 and d1 are constants; and T is soil temperature.
The model developed by Clarkson et al.11 supported research completed by Phillips50 which stated that pre-conditioning of sclerotia by lower temperature resulted in more rapid sclerotium germination. Sclerotia not exposed to 4 °C conditioning, took more than 75 days to germinate, and less than 50% germinated. This indicates that temperature fluctuations can affect disease predictions. Optimum temperatures of 18 °C to 20 °C are required for the completion of the germination process within 30 to 50 days, when the soil has a water potential threshold of -100 kPa. A decrease in germination frequency occurs as temperatures approach 25 °C, with no germination at temperatures >26 °C and soil water potentials >-300 kPa.
Disease forecasting models, particularly those based on predicting critical inoculum potential, can have many sources of variation, including the pathogen isolates as well as the environment. However, the above models (exponential and Arrhenius equations) accurately predicted the germination or non-germination of sclerotia at approximately 80% of 64 sites. Errors associated with 'carpogenic germination' models, especially those associated with soil water potential, have limited the reliability of outcomes, because of the model's sensitivity to soil water potential. The above model is not yet complete as numerous issues must still be resolved, although Clarkson et al.49 believe that the approach of predicting initial inoculum present in the field is promising for future effective prediction of Sclerotinia lettuce drop.
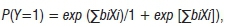
Probability regression models
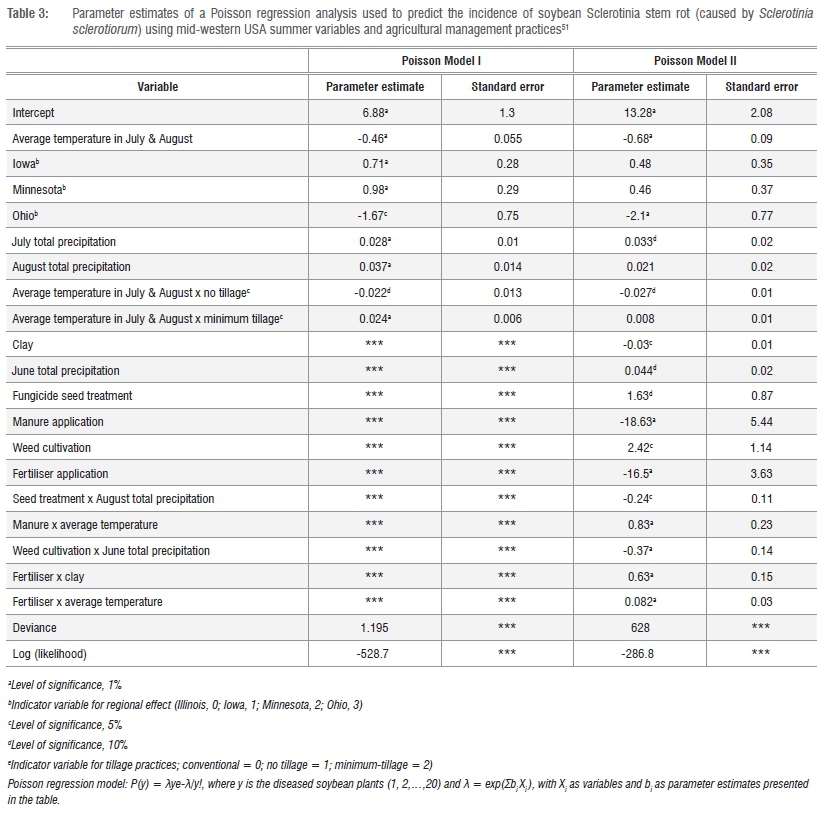
Logistic and Poisson regression models were developed by Mila et al.51 to calculate the prevalence and incidence, respectively, of Sclerotinia stem rot on soybeans. The percentage of infested fields in a region and the percentage of infected plants per field defined prevalence and incidence, respectively. Logistic regression can be applied when the target variable is qualitative with two categories, e.g. disease and no disease. Poisson regression is used in the study of rare events when the responses take on the form of counts. Sclerotinia stem rot was only found in 85 of the 1545 fields sampled, thus the occurrence of the disease can be considered a rare event.51 The input variables for the models include soil conditions, agronomic practices and weather variables, i.e. temperature and rainfall. Tillage practices (i.e. conservation, minimum and conventional tillage) and soil texture were also recorded.
The development of the logistic prevalence model was divided into two parts. Model I dealt with the mid-western USA spring conditions (April) and Model II dealt with summer (July and August). The logistic regression analysis was used to identify significant relationships among environmental and disease variables:
where bi are parameters to be estimated and Xi are covariates or predictors.
The logistic regression for Model I was:
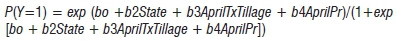
where:
Y (no, 0; yes, 1) = disease presence in a field
AprilT = mean temperature in April (°C) and AprilPr = total precipitation in April (cm)
Tillage (conventional, 0; no tillage, 1; minimum tillage, 2) = indicator variable for tillage practices
State (Illinois, 0; Iowa, 1; Minnesota, 2; Ohio, 3) = indicator variable for regional effects.
The logistic regression for Model II was:
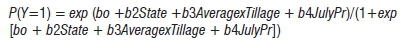
where:
Y (no, 0; yes, 1) = disease presence in a field
Average = mean temperature for July and August (°C)
JulyPr = total precipitation in July (em)
Tillage (conventional, 0; no tillage, 1; minimum tillage, 2) = indicator variable for tillage practices
State (Illinois, 0; Iowa, 1; Minnesota, 2; Ohio, 3) = indicator variable for regional effects.
Soil tillage influenced carpogenic germination, with conservation tillage promoting a greater DI of Sclerotinia stem rot, and ploughing decreasing the frequency of sclerotial germination through the relationship between tillage and soil moisture. Surface residues retained through conservation, minimum and conventional tillage were 30%, 15-30% and <15%, respectively.48
Strong R2values indicated that the models had good predictive accuracy with R2 = 0.65 and R2 = 0.71 for Models I and II, respectively. The models suggested that pre-season regional prevalence prediction of the risk could be feasible. The prediction values with spring (April) temperatures, where low temperature and precipitation increased the regional risk, were related to sclerotia pre-conditioning necessary for subsequent apothecial development.11,49 However, based on previous epidemiological studies (see above) and the significant positive correlation between spring and summer temperatures with DI, Mila et al.51 suggested that Model II was more reliable scientifically and could be used to explain the Sclerotinia stem rot epidemics on a regional scale. The restricted number of observations used to develop the models was a limitation as the Sclerotinia stem rot prevalence was overestimated in regions in which the observed prevalence was low.
The Poisson regression analysis was:

where  and bi and X are the parameters to be estimated and the covariates or predictors, respectively.
This equation was used to quantify the relationship between independent variables and in-field S. sclerotiorum incidence. More agronomic practices were also incorporated in the Poisson regression analysis, i.e. the use of fungicide-treated seed, weed management, use and type of manure and fertiliser applications (Table 3).
R2-values for this model were low, illustrated when estimated incidences were plotted against the observed incidences and yielded a R2=0.065. The authors speculated that field specific information was not sufficiently integrated into the model, i.e. cultivars may have differed in susceptibility, microclimate variables were not quantified, and ascospore inoculum was not quantified. Under South African conditions, variation in stability of soybean cultivar responses to the disease have been reported and therefore a genetic coefficient to quantify genotype response to potential disease risk may be required when developing a South African Sclerotinia prediction model (sensu McLaren and Craven52). Nonetheless, the procedures and principle of using logistic and Poisson regression provide a useful approach to modelling Sclerotinia stem rot.51
Harikrishnan and Del Rio7 repeated the logistic regression method to develop a probability model for white mold of dry bean in North Dakota. They increased the resolution of disease measurement (250 fields surveyed from 2003 to 2005) and site-specific environmental data (maximum distance from a weather station was 20 km). Disease incidences ranged from 0 to 96%. Weather parameters recorded from May to August yearly included monthly total precipitation, number of rainy days and mean minimum air temperature (°C). A spray threshold of >20% disease incidence was used. Regression parameters are presented in Table 4. Although several forms of the model were evaluated and yielded R values >75%, epidemiological significant predictors were selected. These included total rainfall (mm) in the first half of June, average minimum surface temperature (°C) in July and number of rainy days in August. The final singular model was highly sensitive (97%), specific (85%) and had a strong R (0.85) associated with the model's overall statistical accuracy.
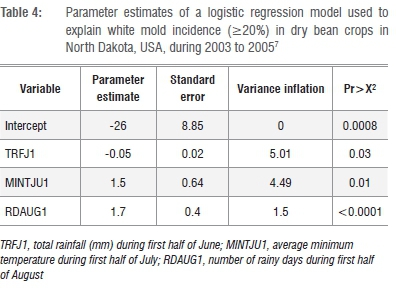
A limitation of the model7 was the overestimation of white mold incidence when disease incidence was <20%, although the model resulted in good accuracy when disease levels were >20%. The authors speculated that the addition of more variables or still greater resolution of disease assessment could be considered to improve accuracy of the model.
Crop-loss-related forecasting model
Koch et al.5 developed a crop-loss-related model known as SkleroPro for winter sown canola in Germany. Although the model was developed in Germany, it has been applied widely in other parts of Europe. Interactions between DI and weather parameters, between DI and agronomic practices, and between DI and the changing price of the commodity in relation to yield gains associated with the cost of fungicide applications were evaluated.5
The SkleroPro structure and components are shown in Figure 1. The model runs from GS55 (mid-bud stage) to GS68 (end of flowering, initiation of pod formation), when it was too late for the probability of yield gain from fungicide application.31 Hourly air temperature (T), precipitation (Precip), RH (measured hourly 2 m above the ground) and sunshine hours (Sun) per day are collected from the nearest weather station. These data are used in the computation of within-canopy temperature (T-Cpy) and RH (RH-Cpy). In order for the crop-loss model to give site-specific recommendations, the date of bud stage (GS55) and crop rotation information, i.e. 2, 3 or >3-year cycles (CropR), need to be provided by the canola producers. The inclusion of crop rotation cycles was pivotal to SkleroPro as it proved to be the strongest site-specific factor influencing the disease. The crop development stage (ONTO) is calculated by the multiplication of the growth function (ESF) by the temperature function (TES). This calculation is initiated at the GS55 stage and predicts the GS58 to GS68 using prevailing weather data. This model was developed by the German Meteorological Service.5 The equations are illustrated below:

ONTO=TES X ESF; where
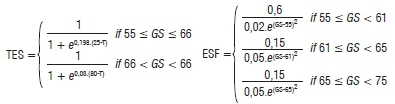
where T = temperature (°C) and GS = growth stage provided by the producer.
The regional risk model is initiated when late-bud stage (GS58) is predicted by the ONTO function, indicating that senescing tissue is present and, thus, initiating a risk of Sclerotinia stem rot. The primary determinant for stem rot initiation is the accumulation of infection hours (Inh). An index (INFEST) is calculated to ensure that the infection hours occur during weather conditions conducive for disease development, i.e. 7 to 11 °C and 80-86% RH, where the optimum temperature for disease development is 18 °C. If the INFEST index indicated the Inh are during suitable conditions and >23 hours after the critical crop growth stage, GS58, a regional risk for stem rot is assumed.5 The INFEST equation is illustrated below:

where T = temperature and RH = relative humidity.
If the regional risk warning is delivered, the hours greater than the 23-hour threshold are accumulated (InhSum), which delivers the site-specific risk forecasts and fungicide application recommendations by calculating the economic damage threshold (Inhi), illustrated below:
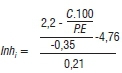
where Inhi = economic damage threshold; C= spray costs; P= produce price; E= expected yield; which are provided by the producer.
Site-specific information required to calculate the Inhi includes the expected yield, commodity price and fungicide application costs. If the Inhi value is greater than the InhSum value, a 'yes' recommendation to spray is delivered to the producer. Routine fungicide applications at GS65 are effective for disease management; however, site-specific recommendations during GS61 to GS69 add economic value for producers by taking advantage of the window of opportunity for maximising efficacy against stem rot infections.5
In a retrospective evaluation of the model, Koch et al.5 reported a 70% accuracy, with 24% of predictions overestimating DI and 6% underestimating DI. Only 53% of sprays made to routinely sprayed (comprising five applications) fields were justified economically. The model reduced unnecessary fungicide sprays by 39% compared with routine spray applications. During the 2005 season, only 9% of the routine sprays proved to be justified economically, representing a saving of 75% of sprays had the model been applied commercially.5 This model proved reliable as a crop-loss forecast model with a field, site and time specificity with regard to fungicide application recommendations. SkleroPro became available online in 2006, through the Information System for Integrated Plant Production (ISIP).5
Conclusion
Although the predictive models described here focused on canola, dry bean, lettuce and soybean, the models form a basis for the development of risk assessment for diseases caused by Sclerotinia sclerotiorum on crops important to South African agriculture. Most of the models are built from the same basic driving variables that are restructured and recalibrated for the relevant crops, localities and purposes. The models demonstrate the importance and potential value of crop disease prediction models in the optimisation of timing intervention practices for disease management. Some of the above models have contributed to optimising fungicide application efficiency and have reduced the number of fungicide applications, thus mitigating environmental damage and reducing fungicide resistance build-up.53,54 An important consideration is the number of variables included in the models and the need for a balance between what is practical in the field versus disease risk prediction accuracy. Evident from this review is that this balance has not yet been reached and additional improvements are required for many models to meet these desired characteristics for adoption by farmers. The sporadic nature of diseases caused by Sclerotinia spp. complicates the validation of models. As a result, many producers have been reluctant to implement such decision-support tools, because of a lack of reliability, the need for too many input variables, and a lack of infrastructure to deliver such tools to the agricultural industry.
The generation of S. sclerotiorum predictive risk models for South African circumstances will require local monitoring of the disease and the collection of weather and agronomic data from multiple localities and seasons. The Crop Estimates Committee (from the Department of Agriculture, Forestry and Fisheries) has been conducting Sclerotinia surveys with South African producers over the last decade and weather data can be provided by multiple reliable sources. The use of local S. sclerotiorum epidemiological knowledge and data could serve towards development of a forecasting model for South African canola, soybean and sunflower producers.16,52
The epidemiology of diseases caused by Sclerotinia species is still not fully understood on all possible host crops; therefore, more predictive models can potentially be developed and made available commercially. Predictive forecasts are potentially an important part of the future for economically viable agronomic decisions. Furthermore, it is clear that the models need to be locality-specific with adaptions required before a model can be applied to an area. Therefore, this review reveals opportunities for future research in South Africa for developing S. sclerotiorum forecasting models on susceptible crops of importance grown through the diverse production practices in this region of the world.
Acknowledgements
The financial assistance of the South African National Research Foundation (NRF) towards this research is hereby acknowledged. The work is based on the research supported in part by the NRF (grant number 111288 ). Opinions expressed and conclusions arrived at, are those of the author and are not necessarily to be attributed to the NRF.
Authors' contributions
L.A.R. was responsible for the conceptualisation, funding acquisition, data curation, data collection and writing the initial draft. N.W.M. was responsible for the conceptualisation, funding acquisition, critically reviewing the writing and student supervision.
References
1. Bolton MD, Thomma BPHJ, Nelson BD. Sclerotinia sclerotiorum (Lib.) de Bary: Biology and molecular traits of cosmopolitan pathology. Mol Plant Pathol. 2006;7:1-16. https://doi.org/10.1111/j.1364-3703.2005.00316.x [ Links ]
2. Saharan GS, Mehta N. Sclerotinia diseases of crop plants: Biology, ecology and disease management. Dordrecht: Springer; 2008. https://doi.org/10.1007/978-1-4020-8408-9 [ Links ]
3. Ramusi M, Flett B. Sclerotinia disease of sunflower: A devastating pathogen. Pretoria: GrainSA; 2015 [updated 2017]. Available from: http://www.grainsa.co.za/sclerotinia-disease-of-sunflower:-a-devastating-pathogen [ Links ]
4. Twengström E, Sigvald R, Svensson C, Yuen J. Forecasting Sclerotinia stem rot in spring sown oilseed rape. Crop Prot. 1998;17:405-411. https://doi.org/10.1016/S0261-2194(98)00035-0 [ Links ]
5. Koch S, Dunker S, Kleinhenz B, Rõhrig M, Tiedemann A. A crop loss model for Sclerotinia stem rot in winter sown oilseed rape. Phytopathology. 2007;97:1186-1194. https://doi.org/10.1094/PHYTO-97-9-1186 [ Links ]
6. Turkington TK, Morrall RAA, Gugel RK. Use of petal infestation to forecast Sclerotinia stem rot of canola: Evaluation of early bloom sampling, 1985-90. Can J Plant Pathol. 1991;13:50-59. http://dx.doi.org/10.1080/07060669109500965 [ Links ]
7. Harikrishnan R, Del Rio LEA. Logistic regression model to predict the risk of white mold incidence on dry bean in North Dakota. Plant Dis. 2008;92:42-46. https://doi.org/10.1094/PDIS-92-1-0042 [ Links ]
8. GrainSA. Canola - Cut Sclerotinia stem rot down to size. Pretoria: GrainSA; 2016 [updated 2017]. Available from: http://www.grainsa.co.za/canola-cut-sclerotinia-stem-rot-down-to-size [ Links ]
9. Crave M, Ramusi M, Flett B. Sclerotinia - a disease of note in numerous crops. Oilseeds Focus. 2016 March;6-7. Available from: https://www.proteinresearch.net/imgs/newsletters/oilseeds-focus/2016/oilseeds-focus-vol-2-no-2-march-2016.pdf [ Links ]
10. Boland GJ, Hall R. Epidemiology of Sclerotinia stem rot of soybean in Ontario. Phytopathology. 1988;78:1241-1245. https://doi.org/10.1094/Phyto-78-1241 [ Links ]
11. Clarkson JP, Phelps K, Whipps JM, Young CS, Smith JA, Watling M. Forecasting Sclerotinia disease on lettuce: Toward developing a prediction model for carpogenic germination of Sclerotinia. Phytopathology. 2004;94:268-279. https://doi.org/10.1094/PHYTO.2004.94.3.268 [ Links ]
12. CropLife. South African Agricultural Remedies Database: Registered fungicides. Centurion: CropLife South Africa; 2015. Available from: http://croplife.co.za/images/croplife/home/Fungicides.pdf, [ Links ]
13. Campbell CL, Madden, LV. Introduction to plant disease epidemiology. New York: Wiley; 1990. [ Links ]
14. Le Tourneau D. Morphology, cytology and physiology of Sclerotinia spp. in culture. Phytopathology. 1979;69:887-890. https://doi.org/10.1094/Phyto-69-887 [ Links ]
15. Foley ME, Dogramaci M, Underwood W. A re-evaluation of myceliogenic germination of sclerotia for Sclerotinia sclerotiorum strain Sun-87 [abstract]. Paper presented at: National Sclerotinia Initiative 2016 Annual Meeting; 2016 January 20-22; Bloomington, MN, USA. Minneapolis, MN: United States Department of Agriculture; 2016. [ Links ]
16. Steyn C. Soybean response to rust and Sclerotinia stem rot under different biotic and abiotic conditions [thesis]. Bloemfontein: University of the Free State, 2015. Available from: http://scholar.ufs.ac.za:8080/xmlui/bitstream/handle/11660/2321/SteynC.pdf?sequence=1 [ Links ]
17. Purdy LH. Sclerotinia sclerotiorum: History, disease and symptomatology, host range, geographic distribution and impact. Phytopathology. 1979;69:875-880. https://doi.org/10.1094/Phyto-69-875 [ Links ]
18. Abawi GS, Grogan RG. Epidemiology of diseases caused by Sclerotinia species. Phytopathology. 1979;69:899-904. https://doi.org/10.1094/Phyto-69-899 [ Links ]
19. Dillard HR, Grogan RG. Relationship between sclerotial spatial pattern and density of Sclerotinia minor and the incidence of lettuce drop. Phytopathology. 1985;75:90-94. https://doi.org/10.1094/Phyto-75-90 [ Links ]
20. Hao JJ, Subarao KV Duniway JM. Germination of Sclerotinia minor and S. sclerotiorum sclerotia under various soil moisture and temperature combinations. Phytopathology. 2003;93:443-450. https://doi.org/10.1094/PHYTO.2003.93.4.443 [ Links ]
21. Steadman JR. White mold - A serious yield limiting disease of bean. Plant Dis.1983;67:346-350. https://doi.org/10.1094/PD-67-346 [ Links ]
22. Cook GE, Steadman JR, Boosalis MG. Survival of Whetzelinia sclerotiorum and initial infection of dry edible beans in western Nebraska. Phytopathology. 1975;65:250-255. https://doi.org/10.1094/Phyto-65-250 [ Links ]
23. Becka D, Prokinová E, Simka J, Cihláf P Becková L, Bokor P et al. Use of petal test in early-flowering varieties of oilseed rape (Brassica napus L.) for predicting the infection pressure of Sclerotinia sclerotiorum (Lib.) de Bary. Crop Prot. 2016;80:127-131. https://doi.org/10.1016/j.cropro.2015.11.006 [ Links ]
24. Huang HC, Dueck J. Wilt of sunflower from infection by mycelia-germinating sclerotia of Sclerotinia sclerotiorum. Can J Plant Pathol. 1980;2:47-52. http://dx.doi.org/10.1080/07060668009501437 [ Links ]
25. Huang HC. Factors affecting myceliogenic germination of sclerotia of Sclerotinia sclerotiorum. Phytopathology. 1985;75:433-437. https://doi.org/10.1094/Phyto-75-433 [ Links ]
26. Ferreira SA, Boley RA. Sclerotinia sclerotiorum. Hawaii: Crop Knowledge Master; 1992. Available from: www.extento.hawaii.edu/kbase/crop/Type/s_scler.htm [ Links ]
27. Dow RL, Porter DM, Powell NL. Effect of environmental factors on Sclerotinia minor and Sclerotinia blight of peanut. Phytopathology. 1988;78:672-676.https://doi.org/10.1094/Phyto-78-672 [ Links ]
28. Hegedus DD, Rimmer SR. Sclerotinia sclerotiorum: When 'to be or not to be' a pathogen? FEMS Microbiol Lett. 2005;251:177-184. https://doi.org/10.1016/j.femsle.2005.07.040 [ Links ]
29. Harikrishnan R, Del Rio LE. Influence of temperature, relative humidity, ascospore concentration, and length of drying of colonized dry bean flowers on white mold development. Plant Dis. 2006;90:946-950. https://doi.org/10.1094/PD-90-0946 [ Links ]
30. Tu JC. Management of white mold of white beans in Ontario. Plant Dis. 1989;73:281-285. https://doi.org/10.1094/PD-73-0281 [ Links ]
31. Dunker S, Von Tiedemann A. Disease yield loss analysis for Sclerotinia stem rot in winter oilseed rape. IOBC. 2004;19:59-65. [ Links ]
32. Gugel RK, Morrall RAA. Inoculum-disease relationships in Sclerotinia stem rot of rapeseed in Saskatchewan. Can J Plant Pathol. 1986;8:89-96. http://dx.doi.org/10.1080/07060668609501848 [ Links ]
33. Thomas P. Sclerotinia stem rot checklist. In: Canola growers manual. Winnipeg: Canola Council of Canada; 1984. p. 1053-1055. [ Links ]
34. Ahlers D. Integrated plant protection for fungus diseases in oilseed rape. Gesunde Pflanzen. 1989;41:306-311. [ Links ]
35. Jakobsen HL. Erfaringer med varsling for knoldbaegersvamp i Danmark 1986-91. [Experiences with monitoring of Sclerotinia in Denmark]. Nordiska Jordbruksforskares Forening (NJF) Seminar; 1991; Copenhagen, Denmark. p. 225-230. [ Links ]
36. Foster AJ, Kora C, McDonald MR, Boland GJ. Development and validation of a disease forecasting model for Sclerotinia rot of carrot. Can J Plant Pathol. 2011;33:187-201. http://dx.doi.org/10.1080/07060661.2011.563753 [ Links ]
37. Kora C, McDonald MR, Boland GJ. Epidemiology of Sclerotinia rot of carrot caused by Sclerotinia sclerotiorum. Can J Plant Pathol. 2005;27:245-258. http://dx.doi.org/10.1080/07060660509507222 [ Links ]
38. Morrall RAA, Dueck J. Epidemiology of Sclerotinia stem rot of rapeseed in Saskatchewan. Can J Plant Pathol. 1982;4:161-168. http://dx.doi.org/10.1080/07060668209501319 [ Links ]
39. Turkington TK, Morrall PAA. Use of petal infestation to forecast Sclerotinia stem rot of canola: The influence of inoculum variation over the flowering period and canopy density. Phytopathology. 1993;83:682-689. https://doi.org/10.1094/Phyto-83-682 [ Links ]
40. Del Rio LE. Development of a forecasting model to establish risk of Sclerotinia stem rot development on canola in North Dakota. Phytopathology. 2010;100:184. [ Links ]
41. Bom M, Boland GJ. Evaluation of disease forecasting variables for Sclerotinia stem rot (Sclerotinia sclerotiorum) of canola. Can J Plant Sci. 2000;80:889-898. https://doi.org/10.4141/P99-071 [ Links ]
42. Gindrat D, Frei P, Vullioud P, Pellet D. Prediction of Sclerotinia stem rot on oilseed rape in Switzerland. Rev Suisse Agric. 2003;35:225-231. [ Links ]
43. Gladders P, Ginsburg D, Smith JA. Sclerotinia in oilseed rape: A review of the 2007 epidemic in England. Cambridge: Home-Grown Cereals Authority; 2008. Available from: http://cereals-2.ahdb.org.uk/publications/documents/cropresearch/PR433_Final_Project_Report.pdf [ Links ]
44. Morrall RAA, Rogers RB, Rude SV. Improved techniques of controlling Sclerotinia stem rot of canola (oilseed rape) with fungicides in western Canada. Mededelingen van de Faculteit Landbouwwetenschappen Rijksuniversiteit,Gent (Belgium). 1989;54:643-649. [ Links ]
45. Morton JG, Hall R. Factors determining the efficacy of chemical control of white mold in white bean. Can J Plant Pathol. 1989;11:297-302. http://dx.doi.org/10.1080/07060668909501116 [ Links ]
46. Jamaux I, Spire D. Development of a polyclonal antibody-based immunoassay for the early detection of Sclerotinia sclerotiorum in rapeseed petals. Plant Pathol. 1994;43:847-862. https://doi.org/10.1111/j.1365-3059.1994.tb01629.x [ Links ]
47. Lefol C, Morrall RAA. Immunofluorescent staining of Sclerotinia ascospores on canola petals. Can J Plant Pathol. 1996;18:237-241. http://dx.doi.org/10.1080/07060669609500618 [ Links ]
48. Qinab L, Fua Y Xiea J, Chenga J, Jiangab D, Liab G, et al. A nested-PCR method for rapid detection of Sclerotinia sclerotiorum on petals of oilseed rape (Brassica napus). Plant Pathol. 2011;60:271-277. https://doi.org/10.1111/j.1365-3059.2010.02372.x [ Links ]
49. Clarkson JP, Phelps K, Whipps JM, Young CS, Smith JA, Watling M. Forecasting Sclerotinia diseases on lettuce: A predictive model for carpogenic germination of Sclerotinia sclerotiorum. Phytopathology. 2007;97:621-631. https://doi.org/10.1094/PHYTO-97-5-0621 [ Links ]
50. Phillips AJL. Carpogenic germination of sclerotia of Sclerotinia sclerotiorum: A review. Phytophylactica. 1987;19:279-283. [ Links ]
51. Mila AL, Carriquiry AL, Yang XB. Logistic regression modelling of prevalence of soybean Sclerotinia stem rot in north-central region of United States. Phytopathology. 2004;94:102-110. https://doi.org/10.1094/PHYTO.2004.94.1.102 [ Links ]
52. McLaren NW, Craven M. Evaluation of soybean cultivars for resistance to Sclerotinia stalk rot in South Africa. Crop Prot. 2008;27:231-235. https://doi.org/10.1016/j.cropro.2007.05.010 [ Links ]
53. Fry WE. Integrated control of potato late blight-effects of polygenic resistance and techniques of timing fungicide applications. Phytopathology. 1977;67:415-120. https://doi.org/10.1094/Phyto-67-415 [ Links ]
54. Prandini A, Sigolo S, Filippi L, Battilani P Piva GF. Review of predictive models for Fusarium head blight and related mycotoxin contamination in wheat. Food Chem Toxicol. 2009;47:927-931. https://doi.org/10.1016/j.fct.2008.06.010 [ Links ]
 Correspondence:
Lisa Rothmann
Email: coetzeeLA@ufs.ac.za
Received: 11 May 2017
Revised: 08 Nov. 2017
Accepted: 30 Nov. 2017
Published: 27 Mar. 2018
FUNDING: National Research Foundation (South Africa)

