


Serviços Personalizados
Artigo
 Inglês (pdf)
 Artigo em XML
 Referências do artigo
Indicadores

Links relacionados
-
 Citado por Google
 -
 Similares em Google
Compartilhar

 Permalink
South African Journal of Science
versão On-line ISSN 1996-7489
versão impressa ISSN 0038-2353
S. Afr. j. sci. vol.114 no.1-2 Pretoria Jan./Fev. 2018
http://dx.doi.org/10.17159/sajs.2018/20170052
RESEARCH ARTICLE
Black living standards in South Africa before democracy: New evidence from height
Bokang MpetaI; Johan FourieI; Kris InwoodII
IDepartment of Economics, Stellenbosch University, Stellenbosch, South Africa
IIDepartment of Economics, University of Guelph, Guelph, Canada
ABSTRACT
Very little income or wage data were systematically recorded about the living standards of South Africa's black majority during much of the 20th century. We used four data sets to provide an alternative measure of living standards - namely stature - to document, for the first time, living standards of black South Africans over the course of the 20th century. We found evidence to suggest that living standards in the first three decades of the century were particularly poor, perhaps because of the increasingly repressive labour policies in urban areas and famine and land expropriation that weighed especially heavily on the Basotho. The decade following South Africa's departure from the gold standard, a higher international gold price and the demand for manufactured goods from South Africa as a consequence of World War II seem to have benefitted both black and white South Africans. The data also allowed us to disaggregate by ethnicity within the black population group, revealing levels of inequality within race groups that have been neglected in the literature. Finally, we compared black and white living standards, and revealed the large and widening levels of inequality that characterised 20th-century South Africa.
SIGNIFICANCE:
• We provide the first long-run estimates of black living standards in South Africa and evidence of inter-group differences in the effects of 20th-century events and policies.
Keywords: apartheid; anthropometric; 20th century; stature; colonialism
Introduction
The history of living standards in South Africa is complex but highly incomplete. For the period before democracy, we have at our disposal more individual-level statistical records of white descendants of European immigrants than of black South Africans, the indigenous, Bantu-speaking population that inhabited most of modern-day South Africa before the arrival of Europeans and who have since formed the majority of the population. Meticulous records documenting white living standards - including production, wealth, income and wage series - were kept from the beginning of settlement1-5, but comparable information for black South Africans, with few exceptions, is frequently missing or unrepresentative of the entire population. A different approach is thus necessary to provide a more complete picture of the evolution of South Africa's living standards before the advent of democracy.
Our alternative route considers the biological measure of height, or human stature, that is documented in four unique data sources. Adult stature is a sensitive indicator of childhood well-being because individuals cannot realise their potential for physical growth if they are encumbered by poor nutrition, exposure to disease or undue physical labour.6-8 Stature typically correlates with income and other measures of welfare except where the nature of economic change brings adverse consequences for child health.9,10 Average height rises with socio-economic class, because higher class status brings improvements in nutrition and access to medical care.11,12 Admittedly, the relationship between socio-economic status and average height may be confounded by factors such as high food prices, and unsanitary or congested living conditions as a result of industrialisation. Nevertheless, by analysing the mean height of a sample of black male South Africans over the 20th century, we shed light on the standard of living for a subsection of the population that has remained hidden for too long.
Our results address important questions in South African economic history. Were poor black living standards a result of apartheid-era policies, or did they worsen even before South Africa's most infamous era? When did white and black living standards diverge? Finally, and most difficultly, can we explain the level and trend within the black population over the 20th century?
Answering these questions complements the analyses of current-day inequalities that rely on modern surveys with limited recourse to the past.13,14 We already know, for example, that black men born towards the end of apartheid are on average at least 7 cm shorter than their white counterparts. This example is one of the highest within-country differences in the world, but we do not know when it emerged. A similar gap between white and coloured South Africans is known to extend to the start of the 20th century but as yet there is no comparable study of black South Africans.15
We used four unique sources of heights of South African men. Firstly, we examined a sample of black southern African men born between 1895 and 1927 who enlisted in the South African military between 1940 and 1945. Secondly, we considered a group of black men whose skeletons are archived in the Raymond A. Dart Collection of Human Skeletons in the School of Anatomical Sciences at the University of the Witwatersrand (WITS).16 Thirdly, we used the 1998 South African Demographic and Health Survey for men born after 1947. Lastly, we used the 2008 National Income Dynamics Study (NIDs) survey data for the heights of men born after 1958.17 Each of these sources required careful analysis of its origin and the implications for sample selection and inference.
Our results show that black living standards as measured by height improved little over the 20th century, in contrast to that of other South Africans and people in other countries, most of whom experienced considerable growth in physical size. But this finding does not imply that the heights of black men were unchanging. The events of the 20th century had varying effects in different periods and on different ethnic groups. The post-gold standard mining boom seems to have had large beneficial effects on black male heights, even though whites seem to have benefitted more. In particular, Sotho men experienced the most change (at first negative and later positive) in living standards, while that of Xhosa men remained constant throughout the century. The number of observations is limited but sufficient to provide the first quantitative evidence of the adverse effects of early colonial labour policies and a new long perspective on black living standards over the entire 20th century.
A brief history
The discovery of diamonds around 1870 transformed the economy of southern Africa. Men of all races flocked to Kimberley to dig for diamonds.18 The demand for labour meant salaries for young black men whose purchases of guns and ammunition, agricultural equipment and other sundries brought them influence and status back in their kingdoms.19 Discrimination soon followed with a prohibition on claim ownership by black men. A system of migrant labour that initially developed to limit wage increases in the diamond mines was extended to gold mining following discoveries on the Witwatersrand two decades later. By the end of the 19th century, white miners earned eight times as much as black miners.20 Repressive and discriminatory labour practices in the early 20th century institutionalised the wage gap.21 A 'colour bar', for example, essentially reserved skilled and semi-skilled jobs for white workers.22 The consequences for physical health were stark: infant mortality in the Cape Colony among black Africans and coloureds was twice the level of that among whites.23
An erosion of agricultural incomes and thus bargaining power for non-agricultural work reinforced the effect of labour laws. Locusts, drought, rinderpest and wheat blight during the 1890s all but decimated subsistence agriculture and further drove down black bargaining power.24 Nevertheless, legislation remained the most serious peril. The 1913 Land Act - which prohibited, amongst other things, the ownership of land by blacks - had devastating effects on the prospects of black farmers, forcing many into the non-agricultural job market.25 In July 1913, Sol Plaatje undertook to investigate and publicise effects of the Native Land Act.26Plaatje reported that in the Cape Province, the Act drove many black farmers to 'overcrowded locations' with poor sanitation.2* 149) Grazing ground was limited, which led to the loss of cattle - an important source of nutrition and a crucial store of value. Not surprisingly, a series of medical studies confirmed extensive malnourishment among black Africans.27-29
Yet some improvement was underway. By the late 1930s, infant mortality among black Africans and coloureds was declining, and real wages for black miners returned to pre-World War I levels.20,23 Admittedly, mining remained relatively unhealthy, especially for black workers.30,31 The gains in welfare, instead, reflect South Africa's departure from the gold standard in December 1932, which initiated a gold boom and a rise in mining's share of GDP from 15.6% in 1930 to 21.3% in 1933. Real GDP per capita increased to 5.1% annually during the 1930s compared with 2.2% in the previous decade.32 Fedderke and Simkins33 argue that the stimulus of World War II extended the boom triggered by rising gold prices. Black workers benefitted as mining was their largest employer after agriculture and the war-time diversion of white men created new opportunities for black as well as female labour.
The National Party's electoral victory in 1948 and the imposition of even more repressive policies changed the fortunes of black South Africans again. The 1951 Bantu Authorities Act and the 1959 Promotion of Black Self-Government Act, for example, had devastating consequences for blacks living in the new homelands. Not surprisingly, qualitative and quantitative evidence points to a marked increase in malnutrition among black Africans in the 1950s.34 These and other apartheid-era policies -including unbalanced spending on education, health and pensions for different racial groups - entrenched stark inequalities in income, living standards and life expectancy.35 Yet already by the 1970s, social spending on black South Africans, mostly with the purpose of allaying black unrest, began to increase rapidly, with likely positive effects for black living standards.36
Despite ample evidence of race-based inequality over the 20th century, trends in black living standards are difficult to determine, as Nattrass and Seekings suggest:
It is not possible to identify precise levels and trends in poverty prior to the 1990s because the apartheid state made little or no effort to measure poverty among the black majority of the population, showing serious interest only in the living standards and conditions of white citizens.37(p.28)
As a result, no single indicator is available to construct a clear picture of the evolution of black living standards over the course of the entire 20th century. A directly comparable measure such as height can help in this regard.
Sources of height evidence
There is a long tradition of using height to monitor human welfare and the biological standard of living.11,38 While genetic characteristics explain about 80% of stature variation within most populations, it is clear that nutrition, energy expenditure and disease exposure during childhood influence the ability of individuals to realise their height potential. A considerable body of literature now shows that environmental and socio-economic conditions rather than genetics explain most of the variation in height across societies, or even groups within a society.10,38-40 Heights have also been used to study living standards in other African countries, like Kenya, Ghana and Côte d'Ivoire.40-42 In a recent analysis of individuals born between 1951 and 1992 in 39 developing countries, Akachi and Canning43 found that a 1-cm gain in cohort height was associated with a 6% increase in income per capita and a 1.25-year increase in life expectancy.
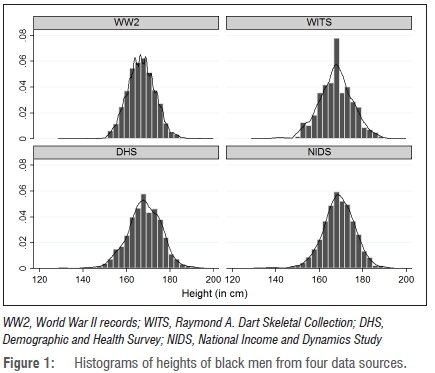
We used four data sets to investigate black living standards in 20th-century South Africa. Data describing 8172 black military recruits in World War II includes men born between 1895 and 1927 in and around South Africa. A smaller set of 500 observations was compiled from cadavers from the WITS collection with birth years between 1897 and 1980. The Demographic and Health Survey measured the height of 2777 black South African men in 1998. Finally, the first wave of the NIDS included 2886 black men born between 1958 and 1990. Table 1 provides summary statistics for the four samples.
Although the average height across the samples is similar - increasing from 167.1 cm to 168.8 cm over the century - each sample represents a different subset of the population. We need to know what kind of men enlisted in the military in order to compare with the other samples and make inferences about the entire population. Similar selection issues apply to men whose cadavers are recorded. The Demographic and Health Survey is restricted to a subpopulation of men who are in a household with a woman aged 15 to 49. The NIDS data are largely representative of the black male population, although the small sample size creates some imprecision at lower aggregate level. These selection issues are discussed below. Although our full sample includes men between the ages of 18 and 50, most of the analysis was done on those between the ages of 23 and 50. This age selection is because almost nobody grows taller beyond the age of 23 and men older than 50 years may start to shrink.44 We undertook the analysis for men 18-50 years and again for men 23-50 years. See Supplementary figure 1 in the supplementary material for a visual comparison.
We transcribed a randomly selected 14% of enlistment records for World War II black soldiers, totalling 9128 records of which 8172 had minimally useful information. During the war these men worked in construction, as telephone operators or drivers, or fulfilled other non-combatant roles.45 Figure 1 shows that there was little or no evidence of truncation at a minimum height (not surprisingly for non-combatants). Nevertheless, the standard deviation is smaller than in the other samples, suggesting a preference for men of a certain height. As long as this truncation is not skewed, which it does not appear to be, our use of average height is unaffected. Some military enlistments tended to recruit men who were otherwise unemployed, and hence were more likely to have grown up in resource-poor households and to be shorter than average.
This does not appear to be the case here. The black soldiers reported a wide range of pre-war occupations. Subsistence agriculture is under-represented but in other respects the occupational profile reflects the diversity of work undertaken by black men at the time.
Our second source was the Raymond A. Dart Collection of Human Skeletons at the University of the Witwatersrand, derived from 2605 bodies that were otherwise unclaimed from regional (southern African) hospitals. Most (76%) of the skeletons are of black southern Africans, and most (71%) are male individuals.16 Although most of the men died between the ages of 20 and 70 - the reason for death is often included -we limited the sample to 500 skeletal measures describing men between the ages of 18 and 50 years. The WITS collection is not demographically representative, but it has the advantage of identifying ethnicity, place of birth and cause of death recorded over an extended time span.16 Although this sample is small, it shows no evidence of truncation at either side of the distribution. The mean and standard deviation of height are similar to that of the NIDS data, which are nationally representative.
Because the principal aim of the South African Demographic and Health Survey was to produce reliable demographic estimates, it included a stratified sample of approximately 12 000 women between the ages of 15 and 49. In addition to the main survey of households and women, however, an adult health module was administered to a sample of adults, including men, aged 15 and over in half of the households selected for the main survey. The survey, therefore, only includes men that are members of a household in which a woman between the ages of 15 and 49 resides. This criterion may have introduced a bias in the sample, although the direction of any bias is unclear.
Our final sample comes from the 2008 NIDS, a nationally representative survey.17 We used data describing black men born after 1958 and before 1990. Several outliers indicate men who were implausibly short; we removed all outliers shorter than 125 cm - which is about four standard deviations from the mean. Figure 1 is a plot of the distribution of heights in the NIDS sample.
Black living standards in the 20th century
We first plotted the height of black men over the 20th century for each of the samples separately. Figure 2 shows the results for black South African men between 23 and 50 years of age. The grey area indicates the 95% confidence interval.
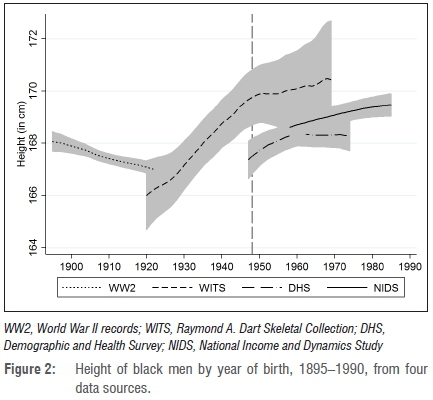
The World War II sample reflects a clear decline in living standards during the first two decades of the century. The small sample size of the WITS collection is reflected in the wide confidence intervals around the trend. Average height in the mid-1920s was nevertheless similar in both the World War II and WITS samples, at 167 cm.
The most obvious disconnect is between the WITS and Demographic and Health Survey samples in 1947, with a 2 cm difference. Both samples most likely suffer from a downward bias. Support for this downward bias in the Demographic and Health Survey sample is found when compared to the nationally representative NIDS data set. The WITS sample, however, seems to be upwardly biased in comparison to NIDS. The true average for 1947 is therefore likely somewhere in between these two samples, at just above 168 cm.
We combined the four sources into one series in Figure 3, which plots a locally smoothed polynomial (of bandwidth 8) of heights of black men by birth year (for men 23 years and older) across the 20th century. This figure is the first representation of male black living standards using micro-level evidence for such a long period.
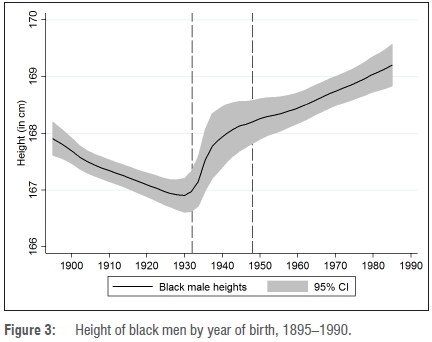
black workers, as noted above. Figure 3 shows a sharp turnaround around 1930, when heights of black men increased by around 1 cm in 10 years. The most likely explanation for this turnaround is South Africa's decision to leave the gold standard in December of 1932 (indicated by the first vertical line), which boosted production in the mines and with it employment for black men. This increase in heights seems to slow down after 1940. Although this rapid rise may be overstated because of a small sample size, there is no doubt that the heights of black men increased by at least 1 cm between 1930 and 1948, when the National Party won the elections and introduced its policy of apartheid (indicated by the second vertical line). The rise in the 1930s is somewhat less steep if the WITS sample is removed, but the general trend remains (see Supplementary figure 2). After 1948, heights of black men increased by another 1 cm until the mid-1980s, when our sample period ends.
Whether the samples are representative of the national population is just one of many possible selection biases when using height as a measure of living standards. Bodenhorn et al.46 caution that changing labour market conditions may influence a worker's decision to opt for military service. In particular, an increase in private sector wages may have diverted the strongest (i.e. tallest) from military service, thereby creating the appearance of stature decline in enlistment records. This kind of selection effect is not immediately relevant here because height and private sector real wages in 1930s South Africa moved in the same rather than opposite directions.
As a further check to determine whether we are not simply capturing 'class' effects, we restricted consideration to black men who worked in mining. The WITS data have no occupational detail so we instead assumed all deaths related to 'lung', 'pneumonia' or 'respiratory' diseases were mine workers, based on the strong correlation between these diseases and mining employment.47 The trend reflected the same pattern as above, although with larger confidence bands owing to the smaller sample size.
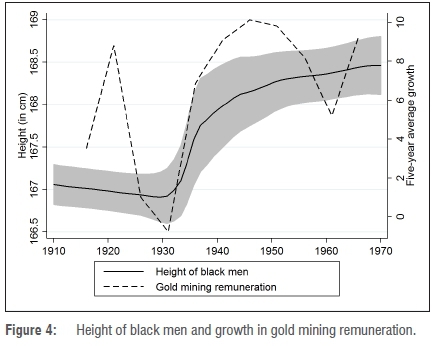
Figure 4 overlays remuneration in gold mining with the heights of black men by year of birth. A positive correlation is evident: employment and real wages in gold mining remuneration expanded significantly during the 1930s just as height increased. Rising mining profits also increased local municipal tax revenue. A part of this additional revenue was used to finance, in 1934, the construction of a new suburb - the southwestern township (Soweto), to improve the living conditions of mine workers.
Black men born during the late-19th century were on average 168 cm tall. Average height then fell by 1 cm to 167 cm over the course of the next three decades, suggesting a strong deterioration in living standards. A decline in height from 1910 to 1930 occurred during the introduction of increasingly more repressive and discriminatory legislation against
We posit that income growth for mine and other urbanised workers would have been key in improving health and nutritional outcomes for their children, which in turn contributed to the growing stature of men born in the 1930s. Admittedly, these are mere correlations. But, as Mariotti48 shows for South Africa in the 1970s, there is some evidence to causally link higher mining wages of fathers to improved stature of sons. We argue that the trend in remuneration is, in the least, supportive of our hypothesis that heights increased significantly during the 1930s because of an expanding mining and manufacturing sector. It was not only in mining in which employment opportunities for black workers improved. Terreblanche notes:
Although the creation of job opportunities for whites was an important justification for launching ESKOM and ISCOR, both deviated from this intention. Even before World War II both corporations were increasingly replacing whites with blacks, gaining significant control over their workforce and their ability to make profits.22(p344)
We emphasise the impact of the mining sector because it employed large numbers of black men throughout the 20th century. In 1911, 21.7% of adult black men in South Africa were employed in the mining sector.49 By 1996, mining still employed 12.8% of all adult black men.50 But by emphasising mining's contribution to the improvement in black living standards, we do not wish to dismiss other possible causes, including improvements in public health, urbanisation and general income levels. We hope that future research will be able to identify the economic significance of these and other causes.
Within-group dynamics
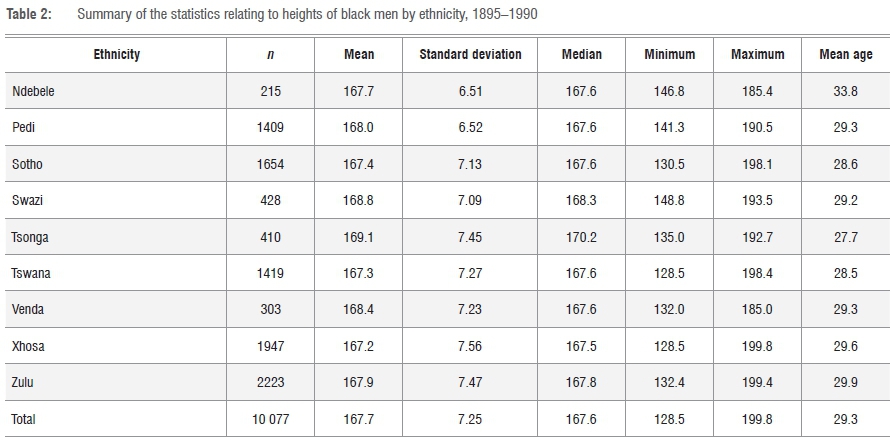
We move beyond these general trends to examine the diversity of well-being within the black population - a topic that has not received a lot of attention in South African economic history. Each of our sources identifies either the ethnicity or the language group of each individual. For this analysis we excluded records for which ethnicity is missing, or is simply indicated as 'black' or 'African'. Here, however, we included individuals born outside South Africa's borders if they shared the ethnicity of South Africans, like the Basotho of Lesotho. In the end, we classified nine black ethnic groups using contemporary classifications of those ethnicities: Ndebele, Pedi, Sotho, Swazi, Tsonga, Tswana, Venda, Xhosa and Zulu (Table 2).
There is some height variation between the different groups. The average gap over the century between the shortest, the Xhosa, and the tallest, the Tsonga, is almost 2 cm. These differences may be attributed, in part, to the distribution of observations by ethnicity across the century. All nine ethnicities are represented in each of the sources, although relative proportions differ. Xhosa and Zulu men, for example, are proportionally less important than Sotho in the sources describing the first half of the 20th century and greater than that of the Sotho in the second half of the century. Accordingly, we describe in Figure 5, temporal change within each of three large groups: the Xhosa, Sotho and Zulu.
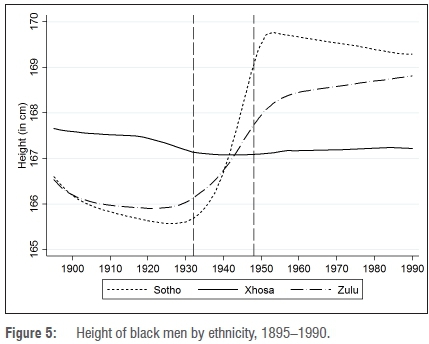
Figure 5 clearly shows that the three ethnicities experienced different patterns of change over the century. Heights of Xhosa men changed little over the 20th century, while the stature of Sotho men fell during the first three decades. The historical literature suggests two possible explanations for the divergence. Firstly, Sotho men in the early 20th century increasingly moved to urban areas around the mines of Johannesburg and to poorly remunerated employment requiring limited skills. Secondly, and perhaps more importantly, the great famine in Basutoland had long-lasting effects for the Sotho. Although there was some reprieve during the Anglo-Boer War as Basotho horses were in high demand by the British, disaster struck again in 1903, when food was imported into Basutoland for the first time. 'Lesotho, once the grain basket of the Cape Colony and the Orange Free State, was no longer self-sufficient in food production'51(p.81).
The ranking between the three ethnicities shown in Figure 5 changed after 1932, when South Africa left the gold standard and mining production soared, when the heights of Zulu men and especially Sotho men increased rapidly. This finding is not surprising; of the three groups, Sotho men would have been most likely to work in and around the mines and thus benefit from the increased labour opportunities and better living conditions available after the 1930s. Heights of Zulu men also increased significantly, and then flattened somewhat during the later period.
Black living standards in comparison
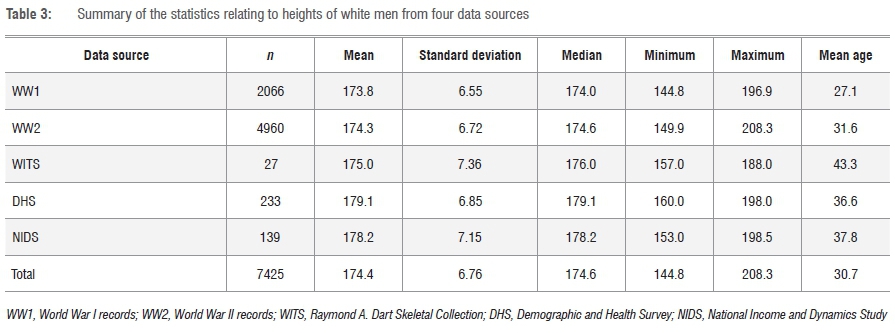
Black living standards did not evolve in isolation. We compared the trend in height for black and white men. We used the same four sources of data for whites, and in addition we used early 20th-century police and military data from World War I, the Cape Mounted Police, the South African Constabulary and attestations of 16 smaller forces. Fourie et al.52 describe this source. Supplementary figure 3 shows the number of observations by year. Some of these forces had a minimum height requirement, implying that the stature of these men may have been slightly greater than that of the general population. The effect of the minimum height requirements was limited because South African whites were tall relative to the minimum and, as is argued elsewhere, the requirements became less relevant over the course of the 20th century because of technological changes in warfare.53 Summary statistics are provided in Table 3.
Figure 6 compares heights of white and black men over the 20th century. Three things are immediately apparent. Firstly, whites were markedly taller than blacks throughout the 20th century. The confidence intervals at some stages are large owing to the few observations available to us, but the two lines never overlap. Secondly, the prodigious increase of the 1930s was not a unique experience for black workers. In fact, the heights of white men seem to have increased 3 cm over less than two decades, confirming the economy-wide impact of the mining and World War II booms. Unfortunately, it is hard to say more about this important experience given the few observations and explanatory variables for this period. Thirdly, the seeming decline of white stature during the apartheid era (in contrast to a small rise in the heights of black men) must be regarded with caution; the current sample size is insufficient to be confident about whites in this period.

Conclusions
Owing to the lack of adequate micro-level evidence, the living standards of black South Africans before democracy remain poorly understood. This paper contributes to filling this gap. We used four data sources on the heights of black South African men to confirm the experience of persistently poor living standards across the 20th century.
We found evidence to suggest that living standards in the first three decades of the century were particularly poor, perhaps as a result of the increasingly repressive labour policies in urban areas and famine and land expropriation that weighed especially heavily on the Basotho. The decade following South Africa's departure from the gold standard, a higher international gold price and the demand for manufactured goods from South Africa as a result of World War II seem to have benefitted both black and white South African men. Unfortunately this progress slowed down in the late 1940s, which coincided with the introduction of further repressive and discriminatory policies that comprised apartheid. Chief Albert Luthuli summarised the overall impact of these laws on black South Africans:
The past thirty years have seen the greatest number of Laws restricting our right and progress until today we have reached a stage where we have almost no rights at all: no adequate land for our occupation, our only asset, cattle, dwindling, no security of homes, no decent and remunerative employment, more restrictions to freedom of movement through passes, curfew regulations, influx control measures; in short we have witnessed in these years an intensification of our subjection to ensure and protect white supremacy.54(p233)
Our evidence attests to the importance of these comments and points to an important way in which the welfare of black South Africans stagnated as other populations were able to realise a considerable growth of physical stature during the second half of the 20th century.55 The slow increase in heights of black men during the second half of the 20th century suggests that economic growth, continued urbanisation, public health provision and the redistributive policies towards the end of the apartheid era, even if from a very low base, contributed to an improvement in black living standards.
The average trend in heights of black men masks important within-ethnic trends. Such inequalities within the black population have, as far as we know, not been adequately examined or explained. Our analysis of heights shows that, while the heights of Xhosa men remained relatively unaffected over the 20th century, those of Sotho men declined and then increased significantly during the 1930s. The decline, we posit, might be explained by the expropriation of land, and the increase by greater access to employment, even of semi-skilled and skilled positions.
These results allow us to compare black South African heights to those of white South Africans. The roots of the interracial inequality, we show, are not limited to South Africa's apartheid era, but lie deep in the history of segregation, exploitation and appropriation that characterised 19th and early 20th century South Africa.
And what about the future? What are the prospects for a convergence and reduction of the black-white stature gap? Is it possible that genetic inheritance perhaps via epigenetic pathways contributes to the patterns identified in this paper, thus reducing the prospects for improvement? From a biogenetic perspective, the question cannot be answered clearly because gene-level understanding of human stature remains incomplete.
A possible answer is to look for societies in which genetic inheritance is similar, but where there are large within-group differences that can only be attributed to socio-economic factors. Korea provides one example. Pak56 shows that while South and North Koreans born during the 1940s were of similar height, the adult heights of North Koreans in subsequent generations have stagnated while the heights of South Koreans have increased by 6 cm - the same gap as that between black and white men in South Africa at the start of the 20th century. Examples of different ethnic groups converging in heights as socio-economic conditions improve comes from the experience of Maori and white (Pãkehã) New Zealanders since World War II.57 While the height gap between the Maori and whites was 3 cm for those born during World War II, this gap disappeared for children born during the 1980s as a result of economic growth and better public health and other social policies. These and other population-level anthropometric studies point to the possibility, at least in the long run, for convergence of stature among different ethnic groups in South Africa.
Acknowledgements
This project is funded by the Elite Project Fund of the Faculty of Economic and Management Sciences at Stellenbosch University, the National Research Foundation's Thuthuka Programme (grant 87966) and Competitive Programme for Rated Researchers (grant 98921) and Economic Research Southern Africa. We thank Emmanuel Akyeampong, Gareth Austin, Joerg Baten, Rulof Burger, Michiel de Haas, Ewout Frankema, Holly Hanson, Martine Mariotti, Alexander Moradi, Johannes Norling, Nathan Nunn, Dieter von Fintel, Marisa von Fintel, Dmitri van den Bersselaar and participants at conferences and seminars at the following institutions: European Social History Conference (Valencia), Graduate Institute (Geneva), Workshop on African History and Economics (Harvard), African Economic History Workshop (Sussex) and the departmental seminars at Stellenbosch University and Mount Holyoke College.
Authors' contributions
B.M. was responsible for the initial analysis and results. J.F. was responsible for the final analysis and write-up. K.I. was responsible for the data collection and cleaning.
References
1. Du Plessis S, Du Plessis S. Happy in the service of the Company: The purchasing power of VOC salaries at the Cape in the 18th century. Econ Hist Dev Reg. 2012;27(1):125-149. https://doi.org/10.1080/20780389.2012.682398 [ Links ]
2. De Zwart P South African living standards in global perspective, 1835-1910. Econ Hist Dev Reg. 2011;26(1):49-74. https://doi.org/10.1080/20780389.2011.583003 [ Links ]
3. Mariotti M. Labour markets during apartheid in South Africa. Econ Hist Rev. 2012;65(3):1100-1122. https://doi.org/10.1111/j.1468-0289.2011.00621.x [ Links ]
4. Fourie J. The remarkable wealth of the Dutch Cape Colony: Measurements from eighteenth-century probate inventories. Econ Hist Rev. 2013;66(2):419-448. https://doi.org/10.1111/j.1468-0289.2012.00662.x [ Links ]
5. Fourie J, Von Fintel D. A history with evidence: Income inequality in the Dutch Cape colony. Econ Hist Dev Reg. 2011;26(1):16-48. https://doi.org/10.1080/20780389.2011.582990 [ Links ]
6. Bailey R, Hatton T, Inwood K. Health, height, and the household at the turn of the twentieth century. Econ Hist Rev. 2016;69(1):35-53. https://doi.org/10.1111/ehr.12099 [ Links ]
7. Komlos J. Access to food and the biological standard of living: Perspectives on the nutritional status of native Americans. Am Econ Rev. 2003;93(1):252-255. https://doi.org/10.1257/000282803321455250 [ Links ]
8. Baten J, Komlos J. Height and the standard of living. J Econ Hist. 1998;58(03):866-870. https://doi.org/10.1017/S0022050700021239 [ Links ]
9. Steckel RH. Heights and human welfare: Recent developments and new directions. Explor Econ Hist. 2009;46(1):1-23. https://doi.org/10.1016/j.eeh.2008.12.001 [ Links ]
10. Steckel RH. Stature and the standard of living. J Econ Lit. 1995;33(4):1903-1940. [ Links ]
11. Steckel RH. Height and per capita income. Hist Method. 1983;16(1):1-7. https://doi.org/10.1080/01615440.1983.10594092 [ Links ]
12. Komlos J, Lauderdale BE. The mysterious trend in American heights in the 20th century. Ann Hum Biol. 2007;34(2):206-215. https://doi.org/10.1080/03014460601116803 [ Links ]
13. Wilson F. Historical roots of inequality in South Africa. Econ Hist Dev Reg.2011;26(1):1-5. https://doi.org/10.1080/20780389.2011.583026 [ Links ]
14. Wittenberg M. Wages and wage inequality in South Africa 1994-2011: Part 2 - inequality measurement and trends. S Afr J Econ. 2017;85(2):298-318. https://doi.org/10.1111/saje.12147 [ Links ]
15. Inwood K, Masakure O. Poverty and physical well-being among the coloured population in South Africa. Econ Hist Dev Reg. 2013;28(2):56-82. https://doi.org/10.1080/20780389.2013.866382 [ Links ]
16. Dayal MR, Kegley AD, Strkalj G, Bidmos MA, Kuykendall KL. The history and composition of the Raymond A. Dart Collection of human skeletons at the University of the Witwatersrand, Johannesburg, South Africa. Am J Phys Anthropol. 2009;140(2):324-335. https://doi.org/10.1002/ajpa.21072 [ Links ]
17. Woolard I, Leibbrandt M, De Villiers L. The South African national income dynamics study: Design and methodological issues. Stud Econ Economet. 2010;34(3):7-24. [ Links ]
18. Etherington N, Harries P, Mbenga B. From colonial hegemonies to imperial conquest, 1840-1880. In: Hamilton C, Mbenga B, Ross R, editors. The Cambridge history of South Africa. Volume 1: From early times to 1885. New York: Cambridge University Press; 2010. p. 319-391. [ Links ]
19. Trapido S. Imperialism, settler identities, and colonial capitalism: The hundred-year origins of the 1899 South African War. In: Ross R, Mager A, Nasson B, editors. The Cambridge history of South Africa. Volume 2: 1885-1994. New York: Cambridge University Press; 2011. p. 66-101. https://doi.org/10.1017/CHOL9780521869836.005 [ Links ]
20. Wilson F. Labour in the South African gold mines 1911-1969. Cambridge: Cambridge University Press; 2011. [ Links ]
21. Marks S. Class, culture and consciousness in South Africa, 1880-1899. In: Ross R, Mager A, Nasson B, editors. The Cambridge history of South Africa. Volume 2: 1885-1994. New York: Cambridge University Press; 2011. p. 102-156. https://doi.org/10.1017/CHOL9780521869836.005 [ Links ]
22. Terreblanche SJ. A history of inequality in South Africa, 1652-2002. Pietermaritzburg: University of KwaZulu-Natal Press; 2002. [ Links ]
23. Simkins C, Van Heyningen E. Fertility, mortality, and migration in the Cape Colony, 1891-1904. Int J Afr Hist Stud. 1989;22(1):79-111. https://doi.org/10.2307/219225 [ Links ]
24. Nattrass N, Seekings J. The economy and poverty in the twentieth century. In: Ross R, Mager A, Nasson B, editors. The Cambridge history of South Africa. Volume 2: 1885-1994. New York: Cambridge University Press; 2011. p. 518-572. https://doi.org/10.1017/CHOL9780521869836.013 [ Links ]
25. Freund B. South Africa: The Union years, 1910-1948 - political and economic foundations. In: Ross R, Mager A, Nasson B, editors. The Cambridge history of South Africa. Volume 2: 1885-1994. New York: Cambridge University Press; 2011. p. 211-253. https://doi.org/10.1017/CHOL9780521869836.007 [ Links ]
26. Plaatje S. Native life In South Africa. 3rd ed. Johannesburg: Picador Africa; 2007. [ Links ]
27. Maynard G. Food deficiency states in African natives. Med J S Afr. 1918;14(3):271-272. [ Links ]
28. Fox CFW. Some nutritional problems among the Bantu in South Africa. S Afr Med J. 1939;13(3):87-95. [ Links ]
29. Brock JF, Lasky JM. The findings of the Cape Nutrition Survey. S Afr Med J. 1942;16(13):255-260. [ Links ]
30. Marks S. The silent scourge? Silicosis, respiratory diseases and gold mining in South Africa. J Ethn Migr Stud. 2006;32(4):569-589. https://doi.org/10.1080/13691830600609975 [ Links ]
31. Packard RM. White plague, black labor: Tuberculosis and the political economy of health and disease in South Africa. Los Angeles, CA: University of California Press; 1989. [ Links ]
32. South African Government. Gross domestic product at factor cost, 1910-1968. Report 09-10-01. Government Reports 1970. [ Links ]
33. Fedderke J, Simkins C. Economic growth in South Africa. Econ Hist Dev Reg. 2012;27(1):176-208. https://doi.org/10.1080/20780389.2012.682408 [ Links ]
34. Abramson JH, Slome C, Ward NT. Diet and health of a group of African agricultural workers in South Africa. Am J Clin Nutr. 1960;8(6):875-884. [ Links ]
35. Bromberger N. Government policies affecting the distribution of income, 1940-1980. In: Schrire R, editor. South Africa: Public policy perspectives. Cape Town: Juta; 1982. p. 165-203. [ Links ]
36. Van der Berg S. The transition from apartheid: Social spending shifts preceded political reform. Econ Hist Dev Reg. 2014;29(2):234-244. https://doi.org/10.1080/20780389.2014.955277 [ Links ]
37. Seekings J, Nattrass N. Policy, politics and poverty in South Africa. London: Springer; 2015. https://doi.org/10.1057/9781137452696 [ Links ]
38. Fogel RW, Engerman SL, Floud R, Friedman G, Margo RA, Sokoloff K, et al. Secular changes in American and British stature and nutrition. J Interdiscipl Hist. 1983;14(2):445-481. https://doi.org/10.2307/203716 [ Links ]
39. Baten J, Blum M. Growing tall but unequal: New findings and new background evidence on anthropometric welfare in 156 countries, 1810-1989. Econ Hist Dev Reg. 2012;27(suppl.1):S66-S85. https://doi.org/10.1080/20780389.2012.657489 [ Links ]
40. Moradi A. Towards an objective account of nutrition and health in colonial Kenya: A study of stature in African army recruits and civilians, 1880-1980. J Econ Hist. 2009;69(3):719-754. https://doi.org/10.1017/S0022050709001107 [ Links ]
41. Moradi A, Austin G, Baten J. Heights and development in a cash-crop colony: Living-standards in Ghana, 1870-1980. African Economic History Network. Working paper #7. 2013. [ Links ]
42. Cogneau D, Rouanet L. Living conditions in Côte D'Ivoire and Ghana, 19251985: What do survey data on height stature tell us? Econ Hist Dev Reg. 2011;26(2):55-82. https://doi.org/10.1080/20780389.2011.625240 [ Links ]
43. Akachi Y Canning D. Inferring the economic standard of living and health from cohort height: Evidence from modern populations in developing countries. Econ Hum Biol 2015;19:114-128. https://doi.org/10.1016/j.ehb.2015.08.005 [ Links ]
44. Moradi A, Baten J. Inequality in sub-Saharan Africa: New data and new insights from anthropometric estimates. World Dev. 2005;33(8):1233-1265. https://doi.org/10.1016/j.worlddev.2005.04.010 [ Links ]
45. Mohlamme JS. Soldiers without reward: Africans in South Africa's wars. Unknown publisher; 1995. [ Links ]
46. Bodenhorn H, Guinnane T, Mroz T. Sample-selection biases and the industrialization puzzle. J Econ Hist. 2017;77(1):171-207. https://doi.org/10.1017/S002205071700003 [ Links ]
47. Marks S. The silent scourge? Silicosis, respiratory disease and gold-mining in South Africa. J Ethn Migr Stud. 2006;32(4):569-589. https://doi.org/10.1080/13691830600609975 [ Links ]
48. Mariotti M. Father's employment and sons' stature: The long-run effects of a positive regional employment shock in South Africa's mining industry. Econ Dev Cult Change. 2015;63(3):485-514. https://doi.org/10.1086/679755 [ Links ]
49. South Africa. Census of the Union of South Africa 1911, UG32-1912. Pretoria: Government Printer; 1912. [ Links ]
50. Statistics South Africa. Census 2001: Primary tables South Africa, Census '96 and 2001 compared. Report no. 03/02/04. Pretoria: Statistics South Africa; 2004. [ Links ]
51. Eldredge EA. A South African kingdom: The pursuit of security in nineteenth-century Lesotho. Cambridge: Cambridge University Press; 2002. [ Links ]
52. Fourie J, Grundlingh A, Mariotti M. 'Poor South Africa! Will no nice English people ever come out here?'-The South African Constabulary of the Second South African War. J Imp Commonw Hist. 2017;45(4):580-606. [ Links ]
53. Fourie J, Inwood K, Mariotti M. Can historical changes in military technology explain the industrial growth puzzle? Mimeo. London: London School of Economics; 2014. [ Links ]
54. Luthuli A. Let my people go. Cape Town: Tafelberg; 2006. [ Links ]
55. Grasgruber P Sebera M, Hrazdíra E, Cacek J, Kalina T. Major correlates of male height: A study of 105 countries. Econ Hum Biol. 2016;21:172-195. https://doi.org/10.1016/j.ehb.2016.01.005 [ Links ]
56. Pak S. The biological standard of living in the two Koreas. Econ Hum Biol. 2004;2(3):511-521. https://doi.org/10.1016/j.ehb.2004.09.001 [ Links ]
57. Inwood K, Oxley L, Roberts E. Physical growth and ethnic inequality in New Zealand prisons, 1840-1975. Hist Fam. 2015;20(2):249-269. https://doi.org/10.1080/1081602X.2015.1006653 [ Links ]
 Correspondence:
Johan Fourie
Email: johanf@sun.ac.za
Received: 01 Mar. 2017
Revised: 29 June 2017
Accepted: 11 Sep. 2017
FUNDING: National Research Foundation (South Africa); South African Agency for Science and Technology Advancement; Economic Research Southern Africa

