


Servicios Personalizados
Articulo
 Inglés (pdf)
 Articulo en XML
 Referencias del artículo
Indicadores

Links relacionados
-
 Citado por Google
 -
 Similares en Google
Compartir

 Permalink
South African Journal of Science
versión On-line ISSN 1996-7489
versión impresa ISSN 0038-2353
S. Afr. j. sci. vol.113 no.11-12 Pretoria nov./dic. 2017
http://dx.doi.org/10.17159/sajs.2017/20170113
RESEARCH ARTICLE
Direct environmental impacts of solar power in two arid biomes: An initial investigation
Justine RudmanI; Paul GauchéII; Karen J. EslerI
IDepartment of Conservation Ecology and Entomology, Stellenbosch University, Stellenbosch, South Africa
IIDepartment of Industrial Engineering, Stellenbosch University, Stellenbosch, South Africa
ABSTRACT
According to recent national energy plans and policy documents, the number of renewable energy developments is expected to increase in South Africa, thus contributing to the diversification of the country's energy system. Consequently, numerous solar power developments are being deployed in the sunny arid interior - areas generally represented by the Nama-Karoo and Savanna Biomes. These developments come with a range of novel environmental impacts, providing opportunities for multidimensional exploratory research. Here, a mixed-method approach was used to identify and investigate possible environmental impacts associated with two types of solar power plants: concentrating solar power and photovoltaic. Structured interviews conducted with experts and experienced professionals, together with observations from site visits generated complementary findings. In addition to the risk of cumulative ecological impacts associated with individual solar plant developments, landscape impacts of multiple power plants and the direct impact on avifauna were found to be the most significant environmental impacts. These direct impacts appear to be most significant during the construction stage, which represents an intensive 10% of the total power plant lifespan. This investigation provides an early, broad and informative perspective on the experienced and expected impacts of solar power in South African arid regions as well as insights to possible future research areas.
SIGNIFICANCE:
•Solar power represents a large component of the needed diversification of South Africa's electricity system.
•Research on the environmental impacts of solar power developments in the arid biomes of South Africa still is relatively scarce.
•Increased energy developments in the arid biomes will require knowledge of the associated impacts for conservation planning.
•Identification of environmental impacts throughout solar power lifespans enables informed management.
Keywords: renewable energy; environmental impact assessment; Nama-Karoo; Savanna; mixed-method
Introduction
The arid biomes of South Africa host an increasing number of renewable energy projects as the country diversifies its primarily coal-dependent energy system.1 Generation capacities have been allocated to both concentrating solar power (CSP) and photovoltaic (PV) developments in the Integrated Resource Plan (IRP) of 20102 and the draft IRP update (IRP Update) of 2013, with solar power expected to represent an increasingly significant portion of renewable energy capacity3. Furthermore, the Renewable Energy Independent Power Producers Procurement Programme (REIPPPP) has awarded multiple CSP and PV projects, of which the majority are located in the arid Nama-Karoo and Savanna Biomes.4
Environmental impacts associated with individual solar power projects are currently being assessed through environmental impact assessments (EIAs) as governed by the National Environmental Management Act (Act no 107 of 1998).5 Internationally, there is increasing research on the environmental impacts of solar power, but the scope of such enquiries varies widely. Previous investigations on the impacts of the solar energy technologies include: life-cycle assessments6,7, studies on the landscape transformation and land-use efficiencies of development footprints8,9, water use requirements10,11, biodiversity and ecological implications8,12,13, and a further specific focus on impacts to avifauna14,15. These impacts could vary per technology type (e.g. parabolic trough plants, central receiver plants) and the associated power plant design.13
A strategic environmental assessment (SEA) has been the only study to investigate the environmental impacts on a larger geographical scale in South Africa than has been done through EIAs which focus on individual developments. This SEA also identified potential areas - dubbed renewable energy development zones (REDZ) - associated with optimal social, economic and environmental impacts from wind and PV power developments. Outcomes of a SEA are not mandated but are intended to guide the siting of projects and expedite environmental authorisations for PV and wind power developments. This SEA, however, excluded the identification of such areas for CSP16 - leaving a gap in the information for this solar power technology type.
Considering the relative novelty of solar power developments in the arid regions of South Africa and the introduction of a potentially wide variety of environmental impacts, the study of these impacts presents a dynamic space for multidisciplinary research.17 Exploration of this topic has been off to a slow start locally, but research conducted in other parts of the world can guide early research in the arid regions of South Africa.10,13
Focusing within the arid regions of South Africa, we identify and investigate initial direct environmental impacts from utility-scale CSP and PV projects located across the Nama-Karoo and Savanna Biomes. A mixed-method approach was followed, which included conducting structured interviews with experienced and knowledgeable individuals from diverse, yet relevant, backgrounds and affiliations; site visits to selected solar power plants; and spatial analysis using publically available data. The methods and results presented here were extracted from a more extensive study on the same topic, which includes a literature review that comprehensively covers the relevant policy, technological characteristics and environmental impacts.18
Methods
Study area
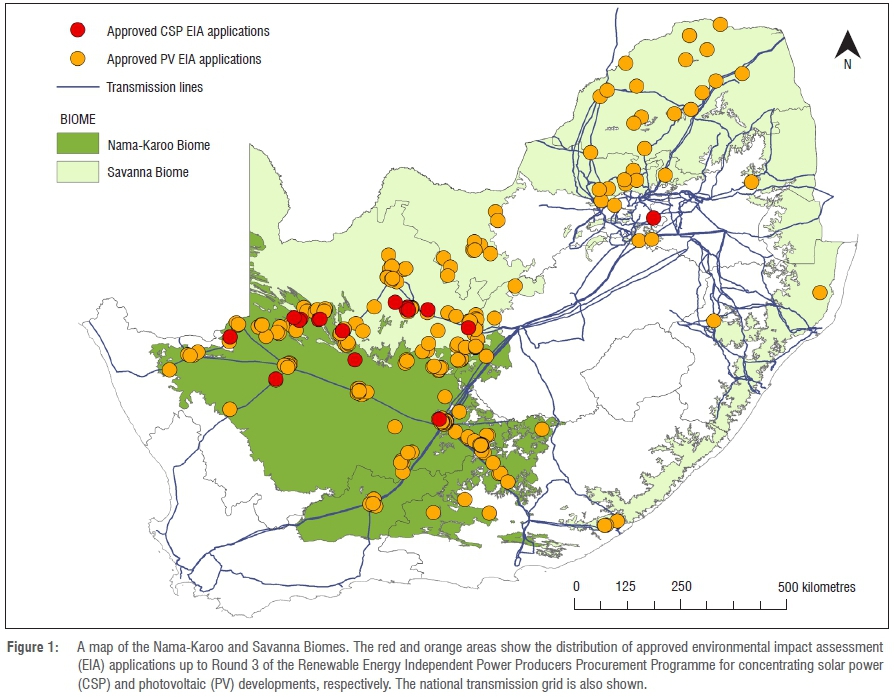
The availability of good solar resources and capacity on the national transmission grid are determining factors for where solar power developments are located, which explains why almost two thirds (62.5%) of existing PV power plants are located in the Northern Cape, with the rest distributed over five provinces. The proximity of the Orange River is an important consideration, particularly for the location of CSP projects in the study area, because of the need for water in the power cycles; this need contributes to the limited geographical distribution of CSP projects. Approved EIA applications for solar power developments in the Nama-Karoo and Savanna Biomes are shown in Figure 1.
Data collection and analysis
Structured interviews
Structured interviews were conducted from February to May 2016. Criterion19 and snowball sampling20 were used to identify interviewees from seven expert groups adhering to at least one of the following minimum criteria: (1) experience with or knowledge of the EIA process in South Africa and (2) experience with or knowledge of the environmental impacts of solar power developments. Ethical clearance was obtained before the start of the interview process from the Departmental Ethics Screening Committee of the Department of Conservation Ecology and Entomology and from the Research Ethics Committee of Stellenbosch University (proposal number SU-HSD-001751).
An interview form, written and presented in English, was designed to obtain qualitative and quantitative data. Prior to the interview, participants gave written consent for their participation and use of data in the study. A total of 20 interviews was conducted; some interviewees responded for both CSP and PV (n=5) and others for only CSP (n=14) or PV (n=11). Conducting interviews in person was the preferred method, but where circumstances prohibited, interviews were conducted telephonically or via Internet video conference. Responses to interview questions were directly recorded as text in an electronic copy of the interview form during the interview, which was then used as the transcript for analysis. Based on the nature of the responses obtained in the different sections of the interview form, the data were captured in Microsoft Excel or directly into the Computer Assisted Qualitative Data Analysis Software (CAQDAS) Atlas.ti 7®21 in preparation for analyses.
Qualitative data were subjected to content and thematic analysis using Atlas.ti and two cycles of coding of the responses, which were obtained from different sections of the interview form. Coding aims to define qualitative data and involves identifying and highlighting parts of text, pictures or recordings that resemble a similar theoretical or descriptive concept, which is referred to as code.22 During initial or open coding, responses to certain sections of the interview form were selected, after which a code was linked to each quotation. Second cycle coding involved the categorisation of codes based on predetermined subjects for discussion and patterns that emerged from open-ended sections of the interview forms. After the categorisation of codes into sub-themes or categories, content analysis was done, to prepare for thematic analysis.23 Thematic analysis entails the discussion of categories and responses/codes within categories with the highest frequency of occurrence.
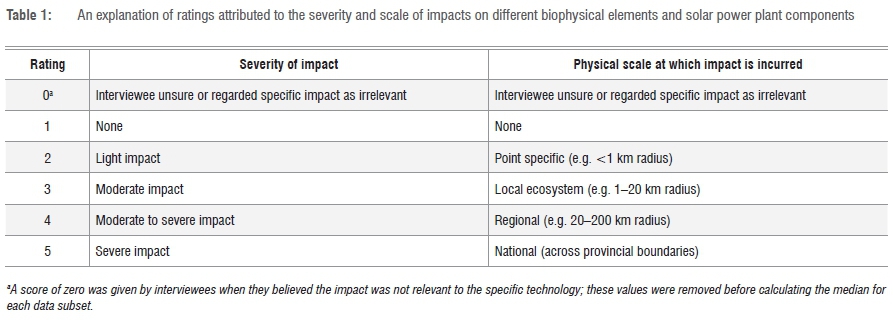
Quantitative analysis was limited to yes/no questions on the interview form and to a section in which ordinal data were obtained for ratings of the severity and physical scale of impacts during different stages of solar power developments. Ratings from zero to five were given, and their definitions are presented in Table 1. These ratings were given for the impacts of CSP and PV power plants on different biophysical elements and impacts from distinct solar power plant components on the biophysical environment as a collective.
Mann-Whitney U tests were used to compare ratings between the different stages of solar power development (construction and operation). The H0 assumed no difference between different development stages for both comparisons of (1) the impacts on biophysical environment and (2) the impacts by different solar power plant components. The calculated p-values were compared at a probability level of 0.05 to test for statistical significance24 in the ratings between the different development stages25. All statistical analyses were done using the Microsoft Excel statistical plugin, XLSTAT®.26
Site visits
Site visits were included to support the interview results within the context of the chosen biomes. The visited sites were widely distributed within these biomes, instead of focusing on impacts from individual power plants with limited distribution. Four PV plants and two CSP plants were visited in June 2016. The purpose of the site visits was to observe the status and environmental impacts of existing solar power developments through personal, on-site observations; interactive discussions; and photographic recording, where permitted. Hosts were informed of the purpose of the visit and agreed to share information accordingly. The agenda of a site visit included induction followed by a thorough tour of the development while discussions took place; each site visit lasted approximately 2-3 h per site. All notes that were made during the site visits were based on what was observed on site as well as on the experiences shared by site visit hosts. The locations of the power plants visited (Supplementary Figure 1) and descriptive information are included in the thesis on which this paper is based.18 Experience data obtained from six site visits to solar power plants were thus interpreted in the context of each unique power plant, and no additional analysis was done.
Spatial data collection
A spatial data set that summarises EIA applications for CSP and PV (hereafter, the EIA data set) was obtained from the South African Department of Environmental Affairs (DEA). The EIA data set was used as the primary reference for identifying areas where CSP and PV developments are taking place as well as which biomes are being impacted. To obtain a regional understanding of the impacts experienced from these developments, the EIA data set was used to investigate impacts on the landscape by using a combination of topic-specific spatial data sets. The majority of these data sets are publically available and/or obtained from researchers in government departments with permission (a summary of the spatial data sets is given in Supplementary Table 1).
All spatial and geographical data analyses were conducted using the geographical information systems software package ArcGIS®. Appropriate tools from ArcGIS were used to manipulate and combine data sets as well as to extract information that reveals insight into the impact of solar power developments across the Nama-Karoo and Savanna Biomes, using the solar power EIA application areas as the starting point.
Results
Interview results
Interviewees were categorised into seven expert groups (Table 2), which served as a representative sample of the greater knowledgeable, qualified and experienced population of experts.27,28 Not all interviewees disclosed their affiliations, but those who did were associated with one or more of the following entities: the Solar Thermal Energy Research Group at Stellenbosch University, BirdLife South Africa, Council for Scientific and Industrial Research, Eskom, the DEA, the South African National Energy Development Institute, World Wide Fund for Nature South Africa, Umvoto Africa (Pty) Ltd, the Plant Conservation Unit at the University of Cape Town, Simon Todd Consulting, Khi Solar One (Pty) Ltd (Abengoa), Golder Associates Africa (Pty) Ltd and Savannah Environmental (Pty) Ltd. The number of responses obtained from each expert group for CSP and PV is summarised in Table 2.

Through the coding and analyses of the interview data from all interviewees (n=20), responses were summarised into three prevailing themes (results for a fourth theme are excluded here).
Theme 1: Direct environmental impacts from solar power development
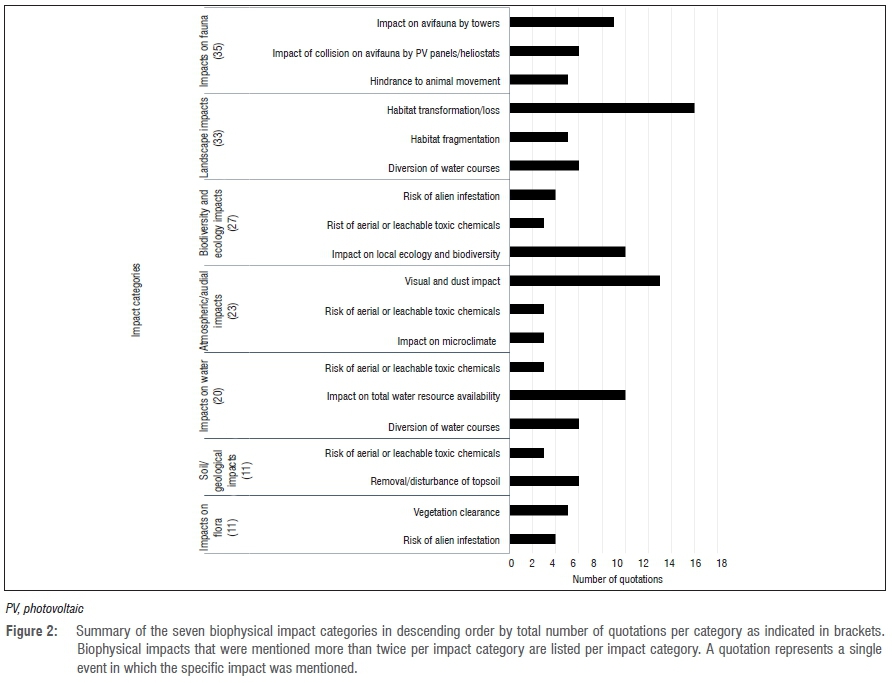
Interviewees were asked if they were aware of any adverse direct environmental impacts from solar power developments on the natural environment. To this question, 95% of interviewees (n=19) responded yes and 5% (n=1) responded no. Interviewees were then provided an opportunity to mention any known impacts related to solar power development. In total, 47 different impacts were coded in this section and grouped into seven biophysical impact categories, which are listed and described below:
1. Atmospheric and audial: Impacts include changes in albedo, microclimate, audial impact, light pollution and visual impact.
2. Biodiversity and ecology: Impacts mentioned as biodiversity or ecological impacts and impacts with potential to have an effect on the dynamics between biological and physical ecological proxies.
3. Fauna: All mentioned impacts with specific relevance to animals.
4. Flora: All mentioned impacts with specific relevance to plants or vegetation.
5. Landscape: Impacts on the land which transcend the boundaries of a development or refer to the impact of a development on the landscape.
6. Soil and/or geological impacts: Impacts by solar power developments on soil and/or the underlying geology.
7. Water: Resource quality and size-related impacts for both surface- and groundwater resources.
The frequencies with which the most common impacts were mentioned within the seven biophysical impact categories are shown in Figure 2. The impact on fauna with a particular focus on avifauna was found to be the most prominent impact category associated with solar power developments, followed by landscape impact and impacts on biodiversity and ecology. Of a seemingly lower concern, impacts on flora and soil or geological impacts were mentioned less frequently during the interviews. Within the given impact categories, specific impacts such as habitat transformation or loss, visual and dust impacts and impact on total water resource availability were frequently recorded.
Although the impact on water resources was not as frequently coded as that of impacts on fauna, the long-term impact of multiple CSP projects on water availability was a recorded concern for at least three interviewees. Regarding this concern, an interviewee who manages a team of environmental assessment practitioners (EAPs) shared that the water in the Orange River is largely allocated to other uses, and current predictions are that the Orange River is less than 10 years away from not being able to meet further development needs.
Although general impacts of solar power were recorded, interviewees were at liberty to mention specific impacts related to CSP or PV. Of these, the impact on avifauna from central receiver towers and avifauna collision impacts with PV panels or heliostats from central receiver plants were found to be the most frequently mentioned. The risk of toxicity of thermal oil used in parabolic trough plants and PV panels was also mentioned.
Regarding the numerical ratings obtained from interviewees, several interviewees commented that the ratings they gave (based on the scores and definitions given in Table 2) included the assumption that the needed management actions or plans are in place, i.e. if management plans were not in place, a higher rating might have been given.
The only CSP biophysical environment impacts (shown in Supplementary Figure 2) rated as having higher severity during operation were those on surface water usage and quality; birdlife; and visual impairment. The median rating for the severity of impacts on all other biophysical elements during construction was equal to or higher than that of operation. Ratings for the physical scale of impacts on these biophysical elements were found to be similar during the two stages in almost all cases except for groundwater quality, for which the median rating was higher during construction. Interestingly, for visual impact, the range of ratings for the physical scale of the impact was found to be the highest (minimum = 2, maximum = 4) during operation, indicating the uncertainty of the actual visual impact during CSP plant operation. The mean ratings for PV developments (also shown in Supplementary Figure 2) also indicate that the severity of impacts is the same for both stages or is higher during construction, again with the exception of visual impact which received a higher rating for the operational stage. For both CSP and PV, the highest severity ratings were received for the impacts on soil, vegetation and increased dust during construction.
The medians and ranges (minimum to maximum) of the ratings obtained were calculated for the severity and physical scale of the impacts from the various power plant components of CSP and PV power plant development (shown in Supplementary Figure 3). For CSP, the median rating was 2 for the majority of the power plant components for both severity and physical scale, with the exception of roads and the solar field for which impact severity was rated higher during both stages. The range of ratings received for the physical scale of impacts by substations and/or power lines was the largest of all power plant components for both development stages. The findings for the impacts by the various components of PV developments are similar to those of CSP developments, with the exception of evaporation ponds and energy storage facilities which are irrelevant for PV. The severity and scale of impacts by roads, substations and/or power lines and the solar field of PV developments were found to be generally higher than those of other power plant components during the construction stage. Components such as energy storage facilities, offices or on-site accommodation and temporary structures or scaffolding had the narrowest rating ranges (minimum = 1, maximum = 2; or minimum = 2, maximum = 3), indicating that the impacts from these components are fairly contained to the development footprint.
Table 3 summarises the p-values for (1) biophysical elements and (2) power plant components, for which a significant difference was found between the construction and operational stages. Here we see differences in impact severity between these two stages on almost all biophysical components for PV developments. No significant difference was found for the rated physical scale of biophysical impacts between the two development stages for PV. However, strong evidence of a significant difference between development stages was found for at least the physical scale of dust- and vegetation-related impacts from CSP developments. The results for the ratings of the power plant components show little consistency between CSP and PV developments. The only commonality is a significant difference between the two development stages in the impact severity of temporary structures.
Theme 2: Feedback and experience with EIA process
Feedback and comments regarding the current EIA process and the coverage of impacts from solar power projects in EIAs are given in this theme. Many responses to this section included suggestions for amendments to the EIA process and/or suggestions for minimising and managing impacts; the latter are not included here.
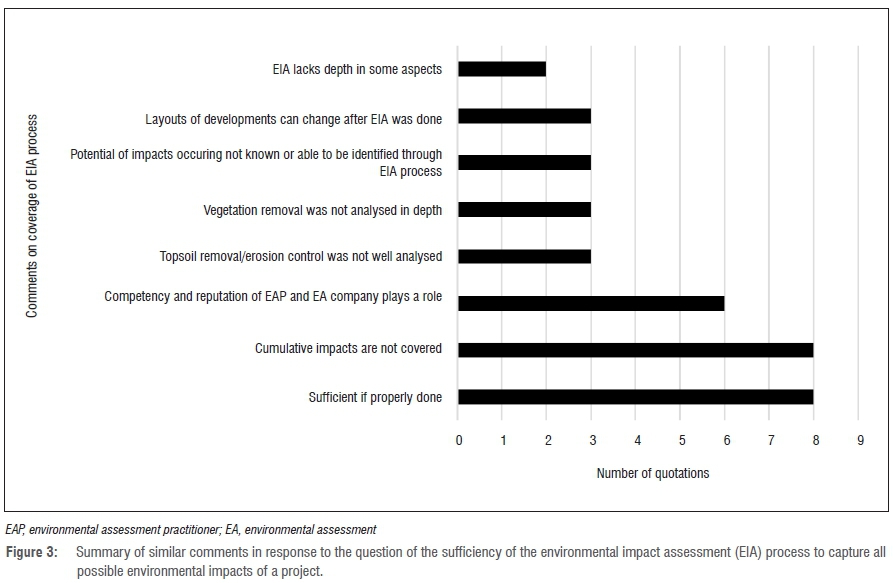
Further to listing impacts related to solar power developments (as indicated in Theme 1), interviewees were asked whether they think EIAs sufficiently cover all impacts of a project on the biophysical environment; the majority of interviewees replied yes (n=11), one interviewee was too unsure to answer, and the rest replied no (n=8). Three interviewees explicitly stated that all impacts are covered in detail. Some interviewees furthered their response with a comment, and those comments mentioned more than once are summarised in Figure 3.
Although the majority of the interviewees agreed that the current EIA process sufficiently covers all impacts of solar power developments, two of the most common responses, indicated in Figure 3, highlight EIA implementation as a key concern. These comments suggested that the aspects generally omitted in the EIA process are 'cumulative impacts' and 'analysing topsoil and vegetation removal in depth'. Two specific examples of negligible assessment of cumulative biophysical impacts were atmospheric pollution and insufficiently investigated resource requirements (e.g. water) prior to the start of a development.
An interviewee with prior practical experience of EIAs at solar power developments specifically mentioned the invasion of alien flora and the attraction of fauna to evaporation ponds as impacts that are not covered sufficiently during the operation stage of a power plant. Five interviewees said they think the impacts are described in detail for both development stages and/or no impacts are omitted in the EIAs.
Although EIA implementation was shown to be a concern, further comments indicate that, when properly implemented by competent EAPs and environmental consultancies, the EIA process is sufficient. Two respondents specifically commented that the legislation is sufficient, but implementation thereof and the follow-through from EIA to the environmental management plan from a legislative perspective during construction might be a weak area. An EAP from the Council for Scientific and Industrial Research commented that 'EAPs have a good understanding of impacts, but the assessment thereof is not reinforced by site visits'. An interviewee who has experience as an EAP and as a specialist commented positively on the thoroughness of the DEA to intervene when there is suspicion that an EIA may have been insufficiently completed.
An employer of an independent power developer with previous experience as an EAP described the central receiver plant, Khi Solar One, as a 'first child' from which many valuable lessons have been learnt. This response is similar to that from an employer at the DEA who openly stated that some of the impacts that might have been missed in the earlier projects' EIAs are a matter of 'learning as we go'.
During early stages of project planning and the EIA scoping phase, preliminary impacts of solar power plants are identified based on spatial biodiversity data sets. The quality and representativeness of these data sets are relevant to minimising impacts on the underlying biodiversity at a specific location. Questions about the biodiversity data sets used for this purpose were included in the interview form. Almost all interviewees (85%; n=17) claimed to know which data sets are being used for baseline studies prior to solar power developments. Although not all interviewees could recall the correct data set names, a trend was noticed in the frequently mentioned data set topics. The South African National Biodiversity Institute, the South African Department of Water Affairs and Sanitation, and the DEA were the three data sources mentioned most frequently. Interviewees who knew which data sets are being used were asked if existing field survey archives, spatial data sets and maps were sufficient to predict the impact of solar power developments in South Africa. To this question, 41% (n=7) replied yes and 59% (n=10) replied no. These responses were furthered by comments, amongst which the following three points were most frequently recorded:
• Current data sets and maps have insufficient resolution and/or are outdated, especially in arid regions, and need to be updated (n=14).
• Ground-truthing is necessary (verification of features represented in a spatial data set with field investigation) (n=10).
• A more strategic, tiered, systematic and cooperative approach is needed to keep data sets updated (n=4).
An EAP from the Council for Scientific and Industrial Research confirmed that '[m]uch of the information used in solar power EIAs has become generic, and should be more pertinent and relevant to the development site.' In a related comment, an interviewee with experience as a specialist in EIA application suggested that a mandatory requirement to submit field data collected for EIA purposes to the South African National Biodiversity Institute after a certain time period could aid in keeping national data sets updated.
Theme 3: Reference to SEA process
Throughout the interview process, mention was made of the SEA that was completed for wind and PV power. The feedback about the SEA process and the linkage to EIAs was limited to three specific points: (1) a perception that the outcomes of the first wind and solar SEA are not utilised to guide EIAs; (2) a view that the usefulness of the SEA is limited given that the distribution of renewable energy projects is in reality constrained by the existing transmission grid infrastructure; and (3) a suggestion that the SEA process must be improved and that CSP should be included in the new SEA being performed for PV and wind power.
Site visits
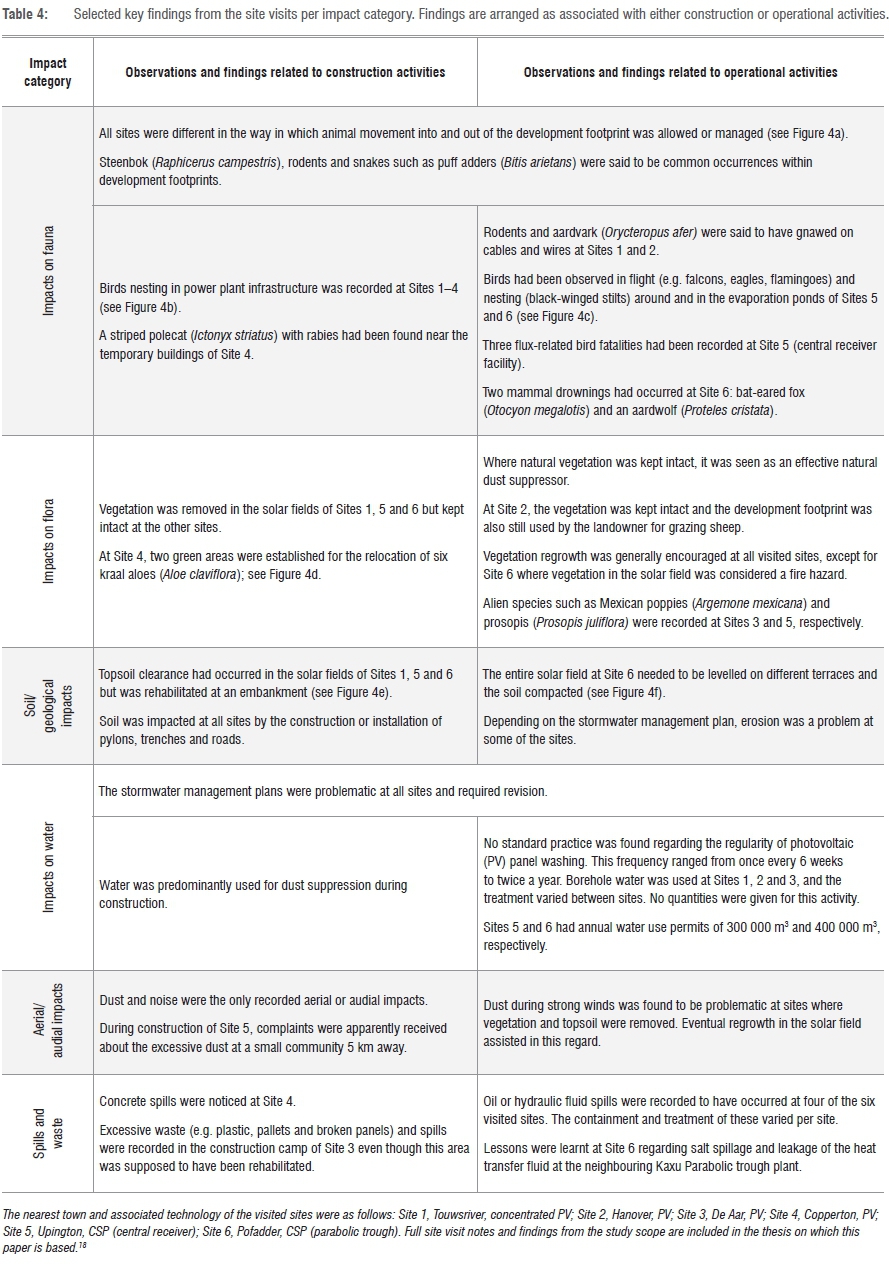
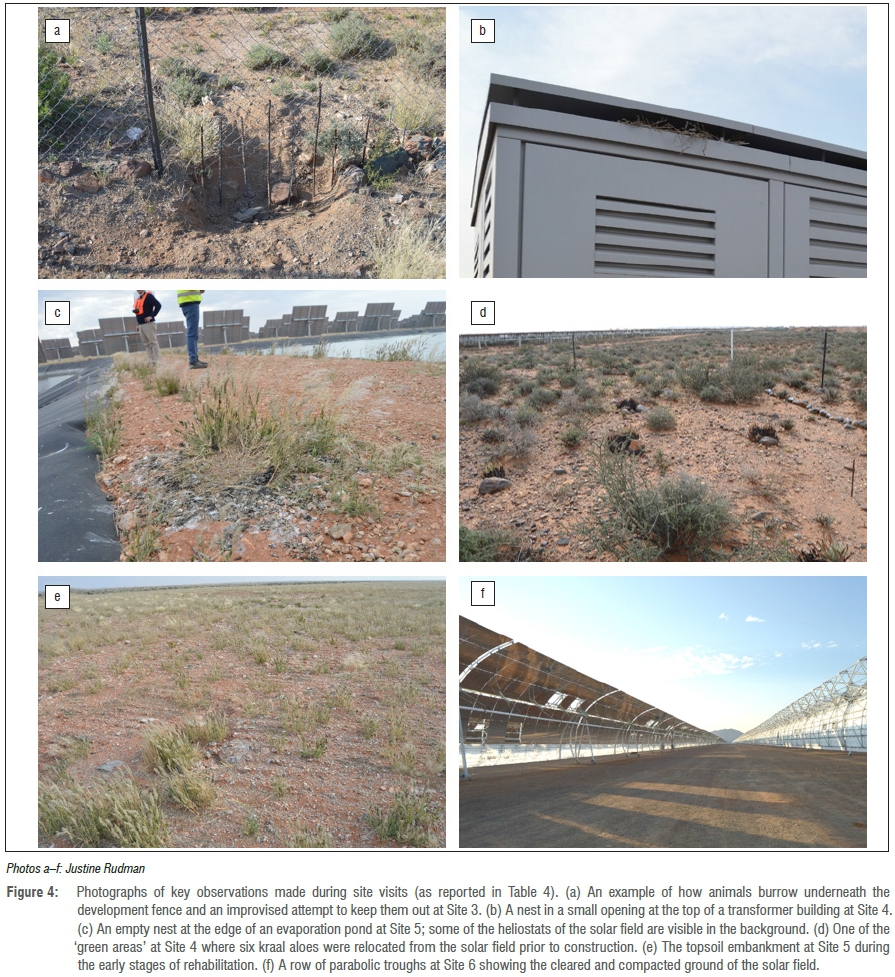
The observations, conversations and photographs recorded during the field trip were combined to offer a collection of in-field experience to support the results from the interview process. These findings largely correlate with the interview results, but site visits allowed for more specific insights regarding matters such as animal interactions and water impacts. With the exception of waste materials at sites still under construction and hydraulic fluid spills at Khi Solar One (Site 5), no unexpected adverse environmental impacts were observed during the site visits. Key findings from the site visits are summarised in Table 4 and supported by photographs of specific phenomena, presented in Figure 4, observed at different sites.
Spatial analysis
Areas under solar power development were extracted from the renewable energy EIA applications database for all projects up to the third round of the REIPPPP. Power plants with approved EIA applications were differentiated from those selected as preferred bidders of the REIPPPP. The projects with approved EIA applications comprise a larger surface area than those of the preferred bidders, highlighting how many EIAs have received approval in the study area. The preferred bidders are a limited number of projects committed for construction and operation and thus contribute to the cumulative direct environmental impacts. A subset of spatial data for solar power developments (all of which are approved solar power EIAs and preferred bidders) was used to quantify the cumulative affected area in the different biomes, vegetation types and other topic specific land uses.
Impacts on biomes and vegetation types
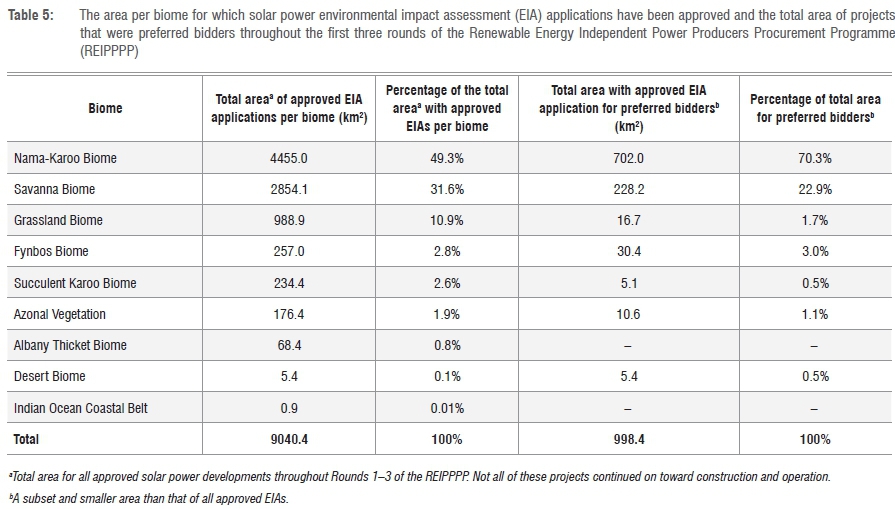
At the time of writing, projects had been approved for Round 3.5 and Round 4 of the REIPPPP, but the EIA data of these projects were not included in the latest data sets made available by the DEA at the time of analysis. Table 5 summarises the total area per biome for which (1) solar power EIA applications have been approved and (2) projects have been assigned to preferred bidders throughout the first three rounds of the REIPPPP. These results confirmed that the Nama-Karoo and Savanna Biomes have a clear majority proportion of area (70.32% and 22.85%, respectively) under development by preferred bidders' projects. In addition to the proportional impacts on biomes and vegetation types, land-cover data revealed that an estimated 95% of the area under solar power development was previously classified as 'low shrubland' and 'bare ground'.29
The total area of land under solar power development per vegetation type30 within the Nama-Karoo and Savanna Biomes was calculated. (A summary of the ten most affected vegetation types is presented in Supplementary Table 2). Indicating the total area per vegetation type in parentheses, the five most affected vegetation types by development footprints of preferred bidders were Bushmanland Arid Grassland (256.3 km2), Northern Upper Karoo (153.9 km2), Kalahari Karroid Shrubland (128.3 km2), Bushmanland Basin Shrubland (116.3 km2) and the Gordonia Duneveld (93.5 km2). The Bushmanland Arid Grassland and the Eastern Upper Karoo are the most targeted vegetation types for solar power development, and represent 26% and 15% of the preferred bidders' area, respectively. However, both types have a conservation status of 'least threatened'.30
Impact on protected areas and biodiversity planning areas
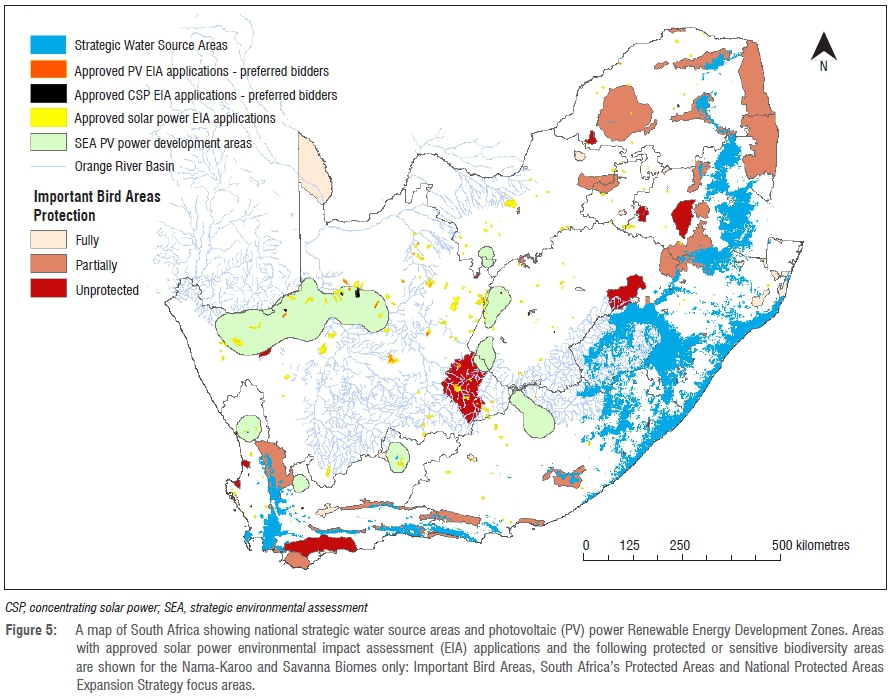
The likelihood that new developments are located in already-existing protected areas was assumed to be less than that in areas not yet protected, although areas of ecological significance have already been earmarked through the National Protected Area Expansion Strategy (NPAES) last updated in 2010.31 NPAES areas were allocated and identified by South African National Parks as intact and unfragmented areas of high importance for ecological persistence and biodiversity representation and suitable for the creation or expansion of large protected areas.31 It was found that the only areas overlapping with NPAES focus areas were those with approved EIA applications for PV developments and no preferred bidders. NPAES areas are shown in relation to the EIA applications areas in Figure 5.
Important Bird Areas (IBAs), as identified by BirdLife South Africa32, are classified as 'unprotected', 'partially protected' or 'fully protected' (Figure 5). A subset of the IBAs, which are located within the Nama-Karoo and Savanna Biomes, was analysed to determine what proportion of these areas has approved solar EIA applications and preferred bidders' developments located within them. No preferred bidders are located within fully protected IBAs, but 7.6 km2 and 168.8 km2 of CSP and PV developments, respectively, are located in unprotected IBAs. The unprotected IBAs that were identified as being affected by PV preferred bidders' developments in the Northern Cape are the Platberg-Karoo Conservancy, Mattheus-Gat Conservation Area and, in the North West Province, the partially protected Magaliesberg IBA. The unprotected IBA, Mattheus-Gat Conservation area, was identified as being affected by CSP developments of preferred bidders. Proximity of EIA applications to IBAs was also calculated, and it was found that approximately 88% of solar power developments are more than 10 km away from any IBA.
Overlap of CSP development areas and strategic water source areas was investigated, but no overlap in location was found (Figure 5).
Lastly, the areas identified with top PV development potential throughout the National SEA for wind and PV power as REDZ33 were analysed to determine how many approved EIA applications and preferred bidders' developments are located within these areas. Of the approved EIA applications for PV, 17% were located within the PV REDZ, and 8% of these projects were selected as preferred bidders. Of the total preferred bidders for PV developments, only 15% were located in a PV REDZ. The co-location of these areas with those of approved solar power EIA applications can be seen in Figure 5.
Footprint and distribution at increased capacity allocations
Capacity allocated to solar power projects in the REIPPPP represent approximately 19% and 18% of the allocations to PV (1899 MW of 9770 MW) and CSP (600 MW of 3300 MW) in the IRP Update Base Case scenario, respectively.3,34 Potential future affected areas can be calculated on the assumption that the land-use efficiency of these technologies remains constant and that the remaining 81% for PV and 82% for CSP will be located in similar and adjacent solar resource areas. The placement of the expected developments can be extrapolated to similar biophysical areas; that is, the variation of proportional distribution of projects within biomes may be minimised as indicated in Table 5. Limitations in these assumptions include unknown timing of when the area would be transformed, the unknown extent of transmission grid expansion and the assumption of consistent land-use efficiency for both CSP and PV projects. This extrapolation and calculation revealed that potential future areas under solar power development per biome will likely be relatively low, with the expected transformed footprint by 2030 at approximately 1.57% in the Nama-Karoo and 0.31% in the Savanna Biome.
Discussion
Studies of public perception and attitudes towards renewable energy technologies are present in the literature35-37, but experience of these technologies from professionals in the field is not as easy to find. Spatial analysis has been used for questions related to land-use efficiency of solar power developments38,39, but little work exists apart from the work of Fluri40 and the guidance provided through the identification of REDZ in the SEA completed for wind and PV power33. This study is an attempt at identifying the direct impacts of South African solar power developments.
Synthesis of findings
Most recorded responses from the interviews regarding the various impact categories, such as impact on avifauna and water consumption, are similar to the findings presented in a recent review paper by Hernandez et al.13 and a more detailed earlier overview presented by Tsoutsos et al.10 Numerical ratings further supported the findings from the content analysis (e.g. high median rating for the impact severity on birdlife and water usage during operation by CSP developments). Impacts similar to those assessed by Turney and Fthenakis12 - such as impacts to wildlife, wildlife habitat and geohydrological resources - were also recorded. The interview results contributed valuable insights during this first study within the Nama-Karoo and Savanna Biomes. However, the method and scope of this study provides a starting point to a multitude of potential future studies with deeper and narrower scopes in the same study area. Because of the widely acknowledged reality of these impacts, the study arguably provides an opportunity for context-specific description and management guidelines of these impacts within an ecological context of a development.
The concern for the impact of CSP on water resource availability together with the comment that cumulative impacts are not covered sufficiently in the EIA process highlights the need for strategic planning of water resource allocation to CSP. This need is specifically relevant around the Orange River Basin where water supply is known to be limited41; strategic planning of this kind is in accordance with the term at which power purchase agreements are signed with developers. Early acknowledgement of a possible risk of over-allocation of water resources provides a starting point for proper description and management of these impacts resulting from CSP developments around the vicinity of the Orange River.
In addition to the added value derived from observing impacts 'on-the-ground' during the site visits, the positive attitudes and practice at some sites were unexpected, pleasant findings. As mirrored in Theme 1 of the interview results, dust impact associated with vegetation and topsoil removal in the solar field was regarded as a major impact within the immediate environment of a solar power plant. Impacts associated with fauna, flora and water mostly appeared to be well planned for during the EIA phase, and when unanticipated impacts occurred - such as the nesting of birds in structures or buildings and the attraction of species to evaporation ponds - impromptu actions were implemented. These observations correlate with feedback on the coverage of the EIA process in which it was highlighted that the attraction of certain species to development footprints is not sufficiently covered in the EIA process. Although monitoring data collection is needed to confirm, this scenario is similar to the 'mega-trap' concept described by Kagan et al.15, in which solar power developments act as an ecological trap as a result of the creation of favourable areas which offer reproductive and foraging advances within the surrounding ecosystem.42
Exploring the impacts on fauna and habitat transformation in general combined with the feedback regarding the quality of biodiversity data sets used in the early stages of the EIA process justifies a clear concern, but it also creates a timeous opportunity. The timing in South Africa is ideal, considering that renewable energy developments are still in the early stages and there is a high potential to gain experience in these impacts. The opportunity lies in focusing on mapping the biodiversity, including specialist studies in planned development areas and developing best-practice guidelines that can proactively avoid impacts on species diversity as well as take into account seasonal migration of avifauna. The suggestion from interviewees that there be a strategic, cooperative approach to keeping these data updated is thus a relevant one. Furthermore, there may be significant potential to update data sets using the in-field data, which gets collected as part of the EIA process.
In addition to ensuring the use of representative data sets to avoid adverse impacts, identified direct impacts would be best supported with species-specific monitoring data to determine specific impact(s) on avifauna from solar power development. No such data were published or available to the public at the time of writing. Such monitoring data would support the impacts previously mentioned that are specific to CSP and PV, of which 'impacts on avifauna by CSP towers' and 'collison impact by PV panels or heliostats' were the most popular; these impacts are reflected in international studies as well.8,14,15 Furthermore, monitoring data of this nature could inform management and mitigation measures, regulations and the establishment of IBAs as has been done by BirdLife South Africa.32,43 However, no evidence based on South African data was available for any of these impacts as peer-reviewed studies.
Landscape outlook
The various environmental impacts associated with a single solar power development could be insignificant, but the landscape-wide accumulation of impacts is a possible concern. The findings from the interviews and site visits enabled us to identify a spectrum of impacts that occur at the solar power plant level; the spatial analysis assisted in investigating the distribution of these impacts across the Nama-Karoo and Savanna Biomes. All three of these data collection techniques and the findings of impacts on fauna, biodiversity and ecology, and landscape transformation link back to the importance of appropriate siting and mapping. The extreme importance of representative biodiversity data should thus be heavily stressed.44,45 Missing data risks putting in danger individuals and/or populations of species in ecosystems with limited geographical distributions as well as affecting the alpha and even beta diversity.46
An aspect weakly investigated in this paper is the assessment of the impacts from support infrastructure (e.g. power lines and access roads), which could result in widespread habitat transformation. Including analysis of such infrastructure spatial data, in combination with real incident data, would give further insight to the expected ecosystem-level landscape-scale impacts of supporting transport and access infrastructure associated with solar power plants.47,48
The motivation behind the wind and PV SEA is good in that it aims to identify areas as REDZ where significant adverse environmental impacts are minimised. Given that the SEA is based on national and local biodiversity data sets33, maintaining updated data sets is critical to guide proper location of solar power plants. Thus, if the location of new power plants are limited to the SEA-identified REDZ, one should be confident that significant adverse landscape impacts are unlikely to occur from the collective location of these power plants. Subsequently, the risk from cumulative impacts outside of the REDZ should theoretically be higher as such areas were deemed unsuitable to ensure development without significant adverse impacts through the SEA process. In addition, and in contrast to EIAs which are a legislative requirement, the findings of a SEA are primarily used to guide development and expedite environmental authorisations in predetermined areas. According to Therivel49, the ultimate aim of a SEA is 'to help protect the environment and promote sustainability'. However, considering that only 15% of PV projects are located within the REDZ, alongside the three points of feedback on SEA, throws into question the effectiveness of a SEA in fulfilling this aim. Furthermore, interviewees confirmed that an explanation is needed as to why CSP was not included in the SEA.
The total portion of affected area in the Nama-Karoo and Savanna Biomes under current REIPPPP projects is relatively low and was found to remain low even under a four-fold increase of solar generation capacity. Guided by the solar power capacity allocation in the IRP Update Base Case scenario, an approximated combined area representing 1.88% of the Nama-Karoo and Savanna Biomes is expected to be under solar power development by 2030, according to known projections. However, refinement is needed on the assumptions that were used for this analysis for a more reliable estimate. Similar projections and calculations on expected future solar power development would also assist with the consideration of trade-offs of renewable energy resources as a provisioning ecosystem service compared to the impact of such developments on other supporting ecosystem services.50
Conclusion
In light of available energy plans and policy documents, solar power developments are expected to increase in the arid biomes of South Africa. The increase of these developments in these arid areas provides a novel research field of which the findings can be used to inform future development. The relatively small footprints attributed to the two studied solar power technologies deployed in the respective biomes and the current EIA process seem to limit the severity of impacts as experienced and measured at the time of investigation. In addition, the most significant impacts appear to be associated with the construction stage of a development, which represents approximately 10% of the lifespan of a solar power plant. Experience from existing power plants suggests that certain impacts remain excluded from the EIA process, of which cumulative impacts are a key concern and need to be addressed. All aspects considered, a key recommendation is the collection and dissemination of impact monitoring data at multiple solar power plants to feed back into strategic planning for future project siting, which would increase knowledge of solar power development related impacts. This initial exploration provides several potential starting points for the collection of such data and further studies in the arid biomes.
Acknowledgements
We acknowledge financial support from the Centre of Renewable and Sustainable Energy Studies of Stellenbosch University and the National Research Foundation (South Africa), without which this study would not have been possible. We also are grateful for the valuable insights, contribution and time offered to this study by the interviewees and site visit hosts.
Authors' contributions
J.R.: study/project design; data collection; data analyses; conceptualisation and compilation of manuscript. P.G.: study/project supervision; assistance with data presentation; manuscript draft revision. K.J.E.: study/project supervision; manuscript draft revision.
References
1. Scholvin S. South Africa's energy policy: Constrained by nature and path dependency. J S Afr Stud. 2014;40(1):185-202. http://dx.doi.org/10.1080/03057070.2014.889361 [ Links ]
2. South African Department of Energy. Integrated resource plan for electricity 2010-2030 [document on the Internet]. c2011 [cited 2016 Dec 05]. [ Links ] Available from: http://www.energy.gov.za/IRP/irpfiles/IRP2010_2030_Final_Report_20110325.pdf
3. South African Department of Energy. Draft integrated resource plan for electricity 2010: Update [document on the Internet]. c2013 [cited 2016 Dec 05]. [ Links ] Available from: http://www.doe-irp.co.za/content/IRP2010_updatea.pdf
4. South African Department of Environmental Affairs. South African Renewable Energy EIA Application Database [database on the Internet]. c2016 [cited 2016 Mar 10]. [ Links ] Available from: http://egis.environment.gov.za/
5. National Environmental Management Act, Act no. 107 of 1998, Republic of South Africa. Available from: https://www.environment.gov.za/sites/default/files/legislations/nema_ impactassessment_g33306rg9314gon543.pdf [ Links ]
6. Burkhardt JJ 3rd, Heath GA, Turchi CS. Life cycle assessment of a parabolic trough concentrating solar power plant and the impacts of key design alternatives. Environ Sci Technol. 2011;45(6):2457-2464. http://dx.doi.org/10.1021/es1033266 [ Links ]
7. Hosenuzzaman M, Rahim NA, Selvaraj J, Hasanuzzaman M, Malek ABMA, Nahar A. Global prospects, progress, policies, and environmental impact of solar photovoltaic power generation. Renew Sustain Energy Rev. 2015;41:284-297. http://dx.doi.org/10.1016/j.rser.2014.08.046 [ Links ]
8. Lovich JE, Ennen JR. Wildlife conservation and solar energy development in the desert southwest, United States. Bioscience. 2011;61(12):982-992. http://dx.doi.org/10.1525/bio.2011.61.12.8 [ Links ]
9. Horner RM, Clark CE. Characterizing variability and reducing uncertainty in estimates of solar land use energy intensity. Renew Sustain Energy Rev. 2013;23:129-137. http://dx.doi.org/10.1016/j.rser.2013.01.014 [ Links ]
10. Tsoutsos T, Frantzeskaki N, Gekas V. Environmental impacts from the solar energy technologies. Energy Policy. 2005;33(3):289-296. http://dx.doi.org/10.1016/s0301-4215(03)00241-6 [ Links ]
11. Ravi S, Lobell DB, Field CB. Tradeoffs and synergies between biofuel production and large solar infrastructure in deserts. Environ Sci Technol. 2014;48(5):3021-3030. http://dx.doi.org/10.1021/es404950n [ Links ]
12. Turney D, Fthenakis V. Environmental impacts from the installation and operation of large-scale solar power plants. Renew Sustain Energy Rev. 2011;15(6):3261-3270. http://dx.doi.org/10.1016/j.rser.2011.04.023 [ Links ]
13. Hernandez RR, Easter SB, Murphy-Mariscal ML, Maestre FT, Tavassoli M, Allen EB, et al. Environmental impacts of utility-scale solar energy. Renew Sustain Energy Rev. 2014;29:766-779. http://dx.doi.org/10.1016/j.rser.2013.08.041 [ Links ]
14. McCrary MD, McKernan RL, Schreiber RW, Wagner WD, Sciarrotta TC. Avian mortality at a solar energy power plant. J Field Ornithol. 1986;57(2):135-141. [ Links ]
15. Kagan R, Viner T, Trail P, Espinoza E. Avian mortality at solar energy facilities in southern California: A preliminary analysis [document on the Internet]. c2014 [cited 2016 Jul 12]. [ Links ] Available from: http://alternativeenergy.procon.org/sourcefiles/avian-mortality-solar-energy-ivanpah-apr-2014.pdf
16. Council for Scientific and Industrial Research. Strategic environmental assessment for wind and solar PV energy in South Africa - renewable energy development zones (REDZs) [document on the Internet]. c2014 [cited 2016 Aug 22 ]. [ Links ] Available from: https://redzs.csir.co.za/
17. Milton SJ, Dean WRJ. Repairing compound damage in arid ecosystems - challenges and controversies. Trans R Soc S Afr. 2015;70(2):127-133. http://dx.doi.org/10.1080/0035919x.2015.1046971 [ Links ]
18. Rudman J. Investigating the direct environmental impacts of emerging solar power and shale gas developments in two arid biomes of South Africa [thesis]. Stellenbosch: Stellenbosch University; 2017. [ Links ]
19. Bryman A. Social research methods. 5th ed. Oxford: Oxford University Press; 2015. [ Links ]
20. Noy C. Sampling knowledge: The hermeneutics of snowball sampling in qualitative research. Int J Soc Res Methodol. 2008;11(4):327-344. http://dx.doi.org/10.1080/13645570701401305 [ Links ]
21. Friese S. ATLAS. ti 7 User guide and reference [document on the Internet]. c2014 [cited 2016 Mar 10 ]. [ Links ] Available from: https://www.researchgate.net/publication/264158353_ATLASti_7_User_guide_ and_reference
22. Gibbs GR. Thematic coding and categorizing. In:Gibbs GR, editor. Qualitative research kit: Analyzing qualitative data. London: SAGE; 2007. p. 28-55. Available from: http://methods.sagepub.com/book/analyzing-qualitative-data/n4.xml [ Links ]
23. Joffe H, Yardley L. Content and thematic analysis. In: Marks DF, Yardley L, editors. Research methods for clinical and health psychology. Thousand Oaks, CA: SAGE; 2004. p. 56-68. [ Links ]
24. Buskirk T. Significance level. In: Lavrakas P, editor. Encyclopedia of survey research methods. Thousand Oaks, CA: SAGE; 2008. p. 820. [ Links ]
25. Lavrakas P. p-Value. In: Lavrakas P, editor. Encyclopedia of survey research methods. Thousand Oaks, CA: SAGE; 2008. p.648. [ Links ]
26. Addinsoft. XLSTAT 2015 Help documentation [document on the Internet]. [ Links ] c2015 [cited 2016 Mar 10]. Available from: http://assistly-production.s3.amazonaws.com/211808/kb_article_attachments/71753/xlstat_help _EN_original.pdf?AWSAccessKeyId=AKIAJNSFWOZ6ZS2 3BMKQ&Expires=1474008646&Signature=DKBh6gCFVUESRwHY+JYVySua/h4=&response-content-disposition=filename='xlst
27. Babbie E. The practice of social research. 12th ed. Belmont, CA: Cengage; 2010. [ Links ]
28. Picardi CA, Masick KD. Research methods: Designing and constructing research methods with a real-world focus. Thousand Oaks, CA: SAGE; 2014. [ Links ]
29. GeoTerra Image. 2013-2014 GTI SA National Land-Cover [data set on the Internet]. c2014 [cited 2017 Jul 10]. [ Links ] Available from: http://bgis.sanbi.org/SpatialDataset/Detail/496
30. Mucina L, Rutherford MC, editors. The vegetation of South Africa. Pretoria: South African National Biodiversity Institute; 2006. [ Links ]
31. South African National Parks. National Protected Areas Expansion Strategy [data set on the Internet]. c2010 [cited 2016 Mar 10]. [ Links ] Available from: http://bgis.sanbi.org/SpatialDataset
32. BirdLife South Africa. Important Bird Areas [homepage on the Internet]. c2015 [cited 2016 Aug 11]. [ Links ] Available from: http://www.birdlife.org.za/conservation/important-bird-areas
33. Council for Scientific and Industrial Research. DEA National Strategic Environmental Assessment for the efficient and effective rollout of wind and solar photovoltaic energy [homepage on the Internet]. c2013 [cited 2016 Mar 10]. [ Links ] Available from: http://www.csir.co.za/nationalwindsolarsea/background.html
34. South African Department of Energy. Renewable Energy IPP Procurement Programme (REIPPPP), Bid Window 4 Preferred Bidders Announcement [homepage on the Internet]. [ Links ] c2015 [cited 2016 Aug 22]. Available from: http://www.ipprenewables.co.za/page/304#page/2183
35. Ek K. Public and private attitudes towards 'green' electricity: The case of Swedish wind power. Energy Policy. 2005;33(13):1677-1689. http://dx.doi.org/10.1016/j.enpol.2004.02.005 [ Links ]
36. Tsantopoulos G, Arabatzis G, Tampakis S. Public attitudes towards photovoltaic developments: Case study from Greece. Energy Policy. 2014;71:91-106. http://dx.doi.org/10.1016/j.enpol.2014.03.025 [ Links ]
37. Karlstrom H, Ryghaug M. Public attitudes towards renewable energy technologies in Norway. The role of party preferences. Energy Policy. 2014;67:656-663. http://dx.doi.org/10.1016/j.enpol.2013.11.049 [ Links ]
38. Hernandez RR, Hoffacker MK, Field CB. Land-use efficiency of big solar. Environ Sci Technol. 2014;48:1315-1323. http://dx.doi.org/10.1021/es4043726 [ Links ]
39. Hernandez RR, Hoffacker MK, Field CB. Efficient use of land to meet sustainable energy needs. Nat Clim Chang. 2015;(5):353-358. http://dx.doi.org/10.1038/nclimate2556 [ Links ]
40. Fluri TP. The potential of concentrating solar power in South Africa. Energy Policy. 2009;37(12):5075-5080. http://dx.doi.org/10.1016/j.enpol.2009.07.017 [ Links ]
41. South African Department of Water Affairs and Forestry. National Water Resource Strategy [document on the Internet]. c2004 [cited 2016 Mar 10]. [ Links ] Available from: https://www.dwa.gov.za/documents/Other/StrategicPlan/NWRS2-Final-email-version.pdf
42. Dwernychuk L, Boag D. Ducks nesting in association with gulls - an ecological trap? Can J Zool. 1972;50(5):559-563. http://dx.doi.org/10.1139/z72-076 [ Links ]
43. Smith HA. Guidelines to minimise the impact on birds of solar facilities and associated infrastructure in South Africa [homepage on the Internet]. c2012 [cited 2016 Jul 11]. [ Links ] Available from: http://www.the-eis.com/data/literature/Solarguidelines_version2.pdf
44. Reyers B, Rouget M, Jonas Z, Cowling RM, Driver A, Maze K, et al. Developing products for conservation decision-making: Lessons from a spatial biodiversity assessment for South Africa. Divers Distrib. 2007;13(5):608-619. http://dx.doi.org/10.1111/j.1472-4642.2007.00379.x [ Links ]
45. Mace GM, Norris K, Fitter AH. Biodiversity and ecosystem services: A multilayered relationship. Trends Ecol Evol. 2012;27(1):19-26. http://dx.doi.org/10.1016/j.tree.2011.08.006 [ Links ]
46. Schmitz OJ. Ecology and ecosystem conservation. Washington DC: Island Press; 2007. [ Links ]
47. Andrews A. Fragmentation of habitat by roads and utility corridors: A review. Aust Zool. 1990;26(3):130-141. [ Links ]
48. Hernandez R, Hoffacker M, Murphy-Mariscal M, Wu G, Allen H. Solar energy development impacts on land cover change and protected areas. Proc Natl Acad Sci USA. 2015;112(44):13579-13584. http://dx.doi.org/10.1073/pnas.1517656112 [ Links ]
49. Therivel R. Strategic environmental assessment in action. 2nd ed. New York: Routledge; 2012. [ Links ]
50. Reyers B, O'Farrel P, Cowling R, Egoh B, Le Maitre D, Vlok J. Ecosystem services, land-cover change, and stakeholders: Finding a sustainable foothold for a semiarid biodiversity hotspot. Ecol Soc. 2009;14(1):23. [ Links ]
 Correspondence:
Justine Rudman
Email: justine@sun.ac.za
Received: 11 Apr. 2017
Revised: 14 July 2017
Accepted: 28 July 2017
FUNDING: Centre of Renewable and Sustainable Energy Studies (Stellenbosch University); National Research Foundation (South Africa)
Supplementary Data
The supplementary data is available in pdf: [Supplementary data]

