


Services on Demand
Article
 English (pdf)
 Article in xml format
 Article references
Indicators

Related links
-
 Cited by Google
 -
 Similars in Google
Share

 Permalink
South African Journal of Science
On-line version ISSN 1996-7489
Print version ISSN 0038-2353
S. Afr. j. sci. vol.113 n.11-12 Pretoria Nov./Dec. 2017
http://dx.doi.org/10.17159/sajs.2017/20170020
RESEARCH ARTICLE
The rise and fall of dissolved phosphate in South African rivers
Neil J. Griffin
Unilever Centre for Environmental Water Quality, Institute for Water Research, Rhodes University, Grahamstown, South Africa
ABSTRACT
Eutrophication of water resources following nutrient loading is a global threat to water quality, and has been found to be one of the major threats to water quality in South Africa. Eutrophication is large-scale autotroph growth following nutrient enrichment and has several consequences, including loss of biodiversity, oxygen depletion, taste/odour generation and algal toxin production. Phosphate enrichment is often (but not always) the cause of freshwater eutrophication, and limitation of phosphate is commonly used as a means of controlling eutrophication. This study reports on a survey of trends in nutrient levels in South African freshwater resources. The research reported on here shows a significant decrease in dissolved phosphate levels in recent years, following a long period during which phosphate levels had been increasing with time. While changes in inorganic nitrogen were found, these changes did not match those in phosphate levels. Several potential causes of these changes were assessed, and it is concluded that no one cause can explain the changes observed. While the decrease in freshwater phosphate levels bodes well for water quality management, internal phosphorus cycling and other mechanisms are likely to mask the short-term impact of phosphate decreases.
SIGNIFICANCE:
• Eutrophication, caused by nutrient loading, is a threat to water quality.
• Phosphate levels in South African fresh water have risen steadily with time, but recently have shown a sharp decrease, which cannot easily be attributed to one phosphate source.
• The decrease has promise for eutrophication management but changes may not occur in the short term.
Keywords: eutrophication; nutrients; fresh water; pollution
Introduction
A number of studies have commented on global trends of increasing nutrient loads in fresh water that drive eutrophication of freshwater and coastal ecosystems.1,2 Eutrophication, recognised as a major threat to surface waters globally, is excessive autotroph growth consequent to nutrient enrichment.1 Eutrophication has a number of side effects with undesirable ecological and economic consequences that include increased autotroph biomass, species compositional shifts, reductions in biodiversity, potential production of algal toxins, oxygen depletion, and taste and odour production.
Nutrient enrichment effectively removes control over growth and production by limiting nutrients. Although the predominant paradigm suggests that freshwater systems are phosphorus-limited3,4, both nitrogen and phosphorus enrichment may increase growth in freshwater systems, and concomitant enrichment of nitrogen and phosphorus may have synergistic effects leading to the greatest increase in autotroph production5,6. Control of nitrogen in water resources is confounded by the potential of changes to available nitrogen forms and levels as a result of nitrogen cycling, among other factors. Although management of phosphorus levels may be modified by legacy phosphate and other mechanisms7,8, phosphate limitation is a common approach to managing eutrophication in fresh water. Nutrient limitation is a simple and obvious approach to eutrophication management, and has in some cases been successful.5
Nutrient sources that contribute to anthropogenic nutrient loading are many and broadly relate to waste disposal practices and land use and management practices. Globally, the major anthropogenic causes of eutrophication are sewage effluent disposal and agricultural land use management practices.5,9 Beyond anthropogenic causes, several geochemical and ecological factors affect the quantity and type of nutrients that may be available. As a result of anthropogenic changes, the global nitrogen and phosphorus cycles have increased by factors of about 1 and 4, respectively.10
Increasing eutrophication in South African freshwater ecosystems is no exception to the global trend, and a number of publications have expressed concern at the ongoing impact of eutrophication on local water resources.9,11,12-18 While nutrient levels in many catchments may be low at times, trends show an increase with time in levels of nutrients in most catchments, most particularly in the case of phosphate.9,19 Increased nutrient levels in South African rivers have been accompanied by increases in eutrophication of reservoirs in the country to the extent that, depending on estimates, half or more of the larger reservoirs in the country are eutrophic or hypertrophic.12,13,17,18 This level of eutrophication has severe ecological and economic consequences, and concerns have been raised regarding the capacity in South Africa for managing the situation.18
Despite a chemical water quality monitoring programme that monitors nutrients at hundreds of points across South Africa, there is relatively little published information on trends in nutrient levels with time. De Villiers and Thiart9 looked at trends in nitrate/nitrite and phosphate at points low in major catchments over the full data record. Trends in nitrate/nitrite varied from catchment to catchment, and all the statistically significant trends detected were towards decreasing levels of this nutrient. On the other hand, in all but 1 catchment of the 25 assessed, levels of phosphate were found to be increasing - in many cases at a statistically significant rate. This greater increase in phosphate levels is consistent with the change in nitrogen and phosphorus cycles reported by Falkowski et al.10
Since the promulgation of the 1 mg P/L standard for discharged effluent, most of the eutrophication management in South Africa has focused on phosphorus concentration management.12,18,20,21 Phosphate loading in South Africa has been associated with discharge of wastewater treatment works effluent19,22,23, urban run-off24,25, the use of phosphate-containing detergents12,18,26,27, mining28,29 and agricultural activity30,31.
Phosphorus loads from urban areas entering freshwater resources have particularly received considerable attention of late18 because primary and secondary treatment of wastewater removes very little phosphate32, and because South African wastewater treatment works do not focus on phosphorus removal18. In addition, a significant portion of the phosphorus in domestic wastewater derives from phosphate-containing laundry detergents26,27 which in many other countries have been banned or limited.
A recent analysis of temporal trends in water quality in two catchments noted an unexpected and sharp decrease in phosphate levels in river water since 2009.29 This decrease was noted at most sites in the study and largely seemed unrelated to catchment, geology, land use or relative position of the site along the length of the river. The decrease followed many years of increasing phosphate levels. The research described here aims to test whether this observation can be generalised to South Africa as a whole. This paper describes an assessment of historical and recent trends in phosphate and inorganic nitrogen across the country, with consideration of potential drivers.
Methods
Data on major nutrients in rivers and canals collected at the Department of Water and Sanitation's (DWS) 333 priority monitoring points were sourced from the Department's WMS database. Received data were then compiled into a single table (332 084 records from 1952 to 2015, sampling frequency varies but often fortnightly) and processed so that the data format requirements of the various statistical methods were met. Monitoring points without reasonably complete data records (taken as having records from at least 9 months of each year) were omitted from the analysis.
Left-censored data occur where the result is below the detection limit of the analytical approach, and are relatively common in water quality data.33 Phosphate levels in WMS data contain significant levels of left-censored data, and so appropriate statistical methods were required. Two approaches were selected for the analysis. In the first approach, pairwise tests were used to compare selected years using a paired Prentice-Wilcoxon test as recommended for paired censored data.34 In the second approach, quantiles in left-censored data were estimated for all years between the first and last year using an implementation of regression on order statistics as described by Helsel33. In the latter approach, quantiles were estimated by pooling all data nationally, with no consideration of particular catchment or location.
Assessment of data from Griffin et al.29 showed a general increase in phosphate levels from the start of the data record until around 2009, whereafter levels dropped sharply. Because the start of the data record at the 333 priority monitoring points varied, the start year for testing was selected as 1985, at which point nearly all points had routine monitoring in place. The mid-year for testing was selected as 2008, after levels had increased to near their peak. The last year for testing was selected as 2013, as this year was well after the decrease noted by Griffin et al.29, and the latest year in the data set for which data records were complete.
Data on nitrate/nitrite, ammonium and phosphate were selected for analysis as these compounds had the best data record, making them suitable for analysis. Ideally, data on chlorophyll-a and total phosphorus (which includes biologically incorporated phosphorus) would be included in a full analysis that addresses nutrient loading, and by implication eutrophication, but the data record on these variables was more sparse after pre-processing. Almost no chlorophyll-a records survived pre-processing, and the full chlorophyll-a data set without pre-processing was used instead.
Data on total inorganic nitrogen were compiled from nitrate/nitrite and ammonium data. After conversion from mass concentration to molar concentration, data on the molar nitrogen-to-phosphorus ratio (N:P ratio) were derived using total inorganic nitrogen and phosphate data. In both these calculations, propagation of nulls owing to missing data in the contributing data sets increased the amount of null data in the derived indices.
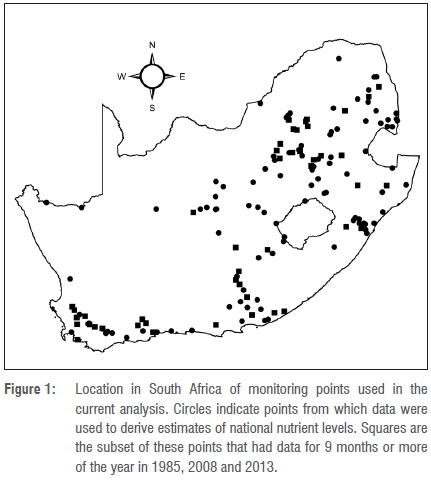
For pairwise testing of the years 1985, 2008 and 2013, pairwise tests were undertaken such that data from the same monitoring point and month were compared across years. Where more than one sample was taken per month, only the first sample in the month was selected for analysis. Monitoring points selected for analysis were those for which data were present for at least 9 months of every year. The locations of the selected monitoring points are presented in Figure 1.
All data manipulation and analysis was done using PostgreSQL and R 3.0.2.35 Regression on Order Statistics made use of routines provided in the package NADA36, and Prentice-Wilcoxon tests made use of the package smwrQW (Lorenz, in preparation). Other packages used in loading and manipulation of data and plotting of figures were RODBC37, xlsx38, plyr39, ggplot240, scales41 and grid35.
Results
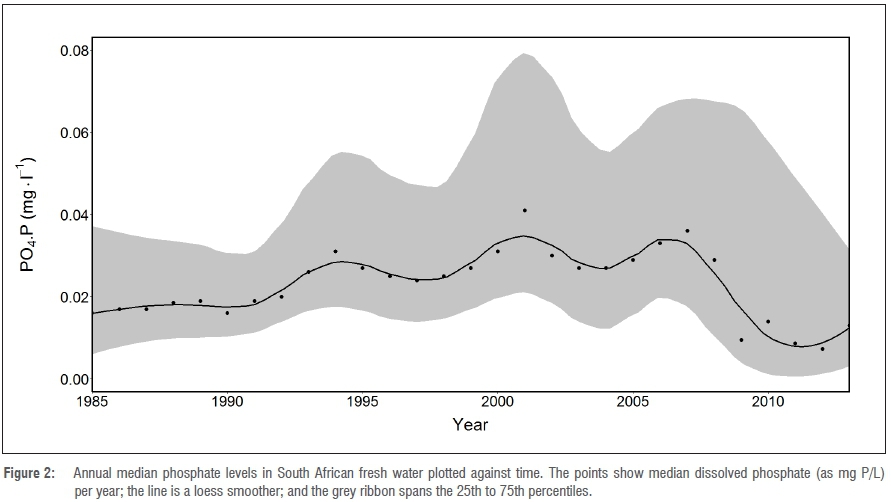
Estimates of annual median South African phosphate levels are presented in Figure 2. It can be seen that dissolved phosphate levels in South Africa showed an increasing trend that peaked around 2007, whereafter levels decreased to a level comparable to levels encountered during the 1980s. This movement equates to a median increase from 0.016 mg P/L in 1985 to a peak of 0.036 mg P/L in 2007 - more than doubling the amount of phosphate available for uptake by freshwater biota. Thereafter, levels fell swiftly to a median of 0.007 mg P/L in 2012. Pairwise comparisons support this trend, and confirm that at sites across the country, phosphate levels increased from 1985 to 2008 (p<0.001), then decreased until 2013 (p<0.001). Following the DWS's generic classification, phosphate levels would have been classed as tolerable in 1985, worse than tolerable in 2007, and acceptable in 2013.15 The 75th percentile is, however, not tolerable, indicating that a large number of sites still have high phosphate levels.
Levels of total phosphorus were also assessed to determine whether the trend that was apparent in dissolved phosphate was also reflected in total phosphorus levels. Total phosphorus levels are generally considered a more reliable indicator of incipient eutrophication than dissolved phosphate.12,18 The data set for total phosphorus was much smaller than that for dissolved phosphate. There was no overt trend with time in total phosphorus, and certainly not one that matches the trends in dissolved phosphate (data not shown). Median estimates of annual total phosphorus ranged from 0.05 mg/L to 0.11 mg/L. This range would be classed as holding significant potential for algal and plant productivity.12
A proxy or indicator of potential total phosphorus may be found in assessment of chlorophyll-a levels in conjunction with dissolved phosphate, which follows the premise that algal uptake of phosphate removes it from the water column, and algal phosphorus contributes to total phosphorus. Chlorophyll-a data from DWS priority monitoring points were not collected evenly across the country, and the data in the data set were collected from 1990 onwards and overwhelmingly from the Orange River. Because of limited data, all data were assessed without following the data filtration processes undertaken for nutrient data. Despite this omission, these chlorophyll-a levels were examined to see how they relate to phosphate levels as seen in Figure 2. Chlorophyll-a levels showed a decrease after 2007 that paralleled that observed in dissolved phosphate levels (data not shown). Median levels from 2000 (the first year when more than 10 records were collected) to 2007 ranged around 10 µg/L, while after 2009 median levels ranged between 1 µg/L and 4 µg/L. This observation suggests that a large body of phosphorus is not locked up in phytoplankton, and the decrease in chlorophyll-a levels indicates a smaller phytoplankton body in recent years. The most parsimonious explanation for this finding is that the decrease in chlorophyll-a levels is a function of decreased available phosphate in the resource; however, growth was not phosphate limited across most of the timeframes assessed. It also indicates that a significant amount of phosphorus was held in the phytoplankton body prior to 2007, which suggests in turn that total phosphorus may have been higher before 2007. It should be noted that these observations reflect the state of the Orange River in particular, and may not apply across the entire country. It should also be noted that chlorophyll-a data were occasionally censored, but the quantity of data available precluded use of analytic techniques for censored data as undertaken with nutrient data.
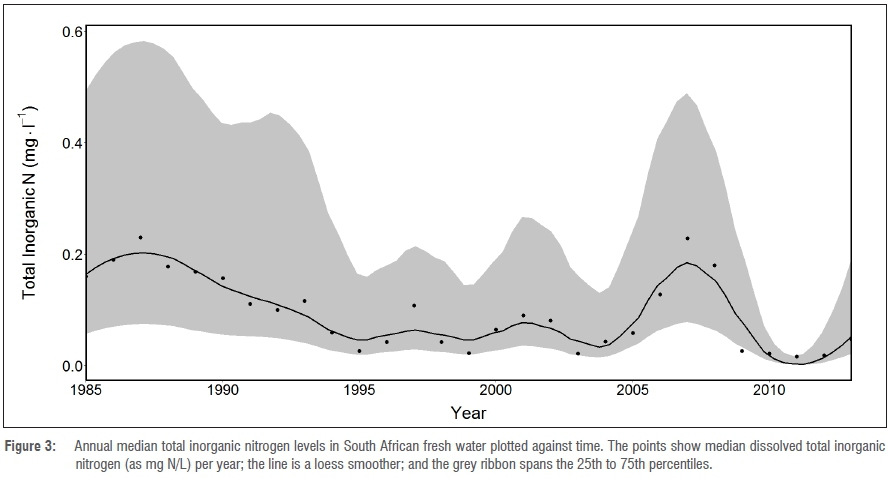
Although trends in phosphate levels in South African fresh water are clear, they are not matched by trends in inorganic nitrogen (Figure 3). Levels of nitrogen vary with time, and the only generally directed trend is a slight decrease in median inorganic nitrogen since the start of the data set. The only exception to this trend is a brief period in the late 2000s when elevated levels were encountered. Median inorganic nitrogen levels ranged between around 0.02 mg N/L during 2010 and 0.20 mg N/L during the late 1980s; therefore inorganic nitrogen levels in South African rivers have varied by up to a factor of 10 since 1985. Pairwise comparisons show a slight increase in inorganic nitrogen from 1985 to 2008 (p=0.015), and a drop thereafter until 2013 (p<0.001). The year 2008 was selected based on the preliminary assessment of phosphate levels. Using data from 2008 is not desirable for inorganic nitrogen levels, as these are drawn from a brief peak in inorganic nitrogen levels that is not present for most of the data record. Nevertheless, for compatibility with the analysis of phosphate levels, it was retained.
These figures may be somewhat low as inspection of annual nitrate/nitrite nitrogen medians reveals these to be slightly higher at times (data not shown). The reason for this discrepancy seems likely to be the smaller sample size used in estimating annual inorganic nitrogen medians, as inorganic nitrogen levels could only be validly calculated when both nitrate/nitrite nitrogen and ammonium nitrogen were sampled and tested for, and detected. Nitrate/nitrite levels indicate that the majority of nitrogen in the inorganic nitrogen pool was in the form of nitrate and nitrite. The upper level for the ideal class used in the DWS generic classification (for nitrate/nitrite nitrogen) is 6 mg N/L.15 The median levels of inorganic nitrogen reported on here are well below that level and so would be classed as ideal.
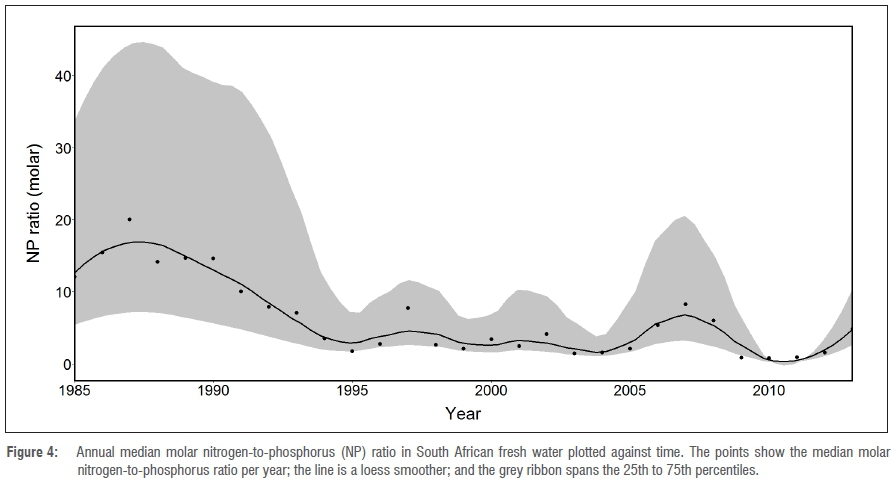
The N:P ratio is a commonly used ecological stoichiometric measure used to assess relative amounts of available nutrients to ascertain which might be limiting for growth.42,43 A molar N:P ratio of 16:1, known as the Redfield ratio, indicates that neither nitrogen nor phosphorus alone is limiting. Figure 4 shows annual medians of the N:P ratio in South Africa. As can be seen, annual median N:P ratios only approximate the Redfield ratio in the late 1980s, with a maximum annual median of 20:1 from 1987, indicating that algal and plant growth was limited by phosphate in that year only. The remaining years returned ratios below 16:1, indicating that for the majority of recent years algal growth was nitrogen-limited, and that phosphate was present in excess.
The recent decrease in phosphate levels seen in Figure 2 is linked to a largely unchanging N:P ratio, and, with a ratio of 4.9:1 in 2013, growth remains nitrogen-limited in 2013 - the last year of the data set. This is similar to ratios reported from sewage, zooplankton excreta, and pastureland run-off by Downing and McCauley42, and below ratios reported from urban stormwater and cattle manure seepage.
Rainfall levels have been found to modify water chemistry by two major mechanisms. The first is increased dilution capacity of water bodies when rainfall is higher and more water is available to dilute dissolved materials, thereby reducing the concentration of dissolved compounds present. The second is the 'first-flush' effect, in which increased surface run-off and baseflow following rainfall may wash compounds into a river, thereby increasing their concentration in the river. In this light, annual rainfall data were assessed to see whether they might explain the observed trends in nutrients. At this point it is worth noting that phosphorus and nitrogen nutrients are involved in biological cycling, which alters the quantities of nutrients available. Rainfall data were sourced from the World Bank and rainfall anomaly data from the South African Weather Service. Annual rainfall data ranged from 320 mm/year to 587 mm/year, with the wettest years being 2000, 2006, 2011, 1988 and 1996, and the driest years being 1992, 2003, 1994, 1990 and 2007. No overall trend is apparent that can simply explain the recent decreases in phosphate that were observed. In addition, no simple correlation between wet or dry years and decreased or increased nutrient levels was apparent. It may be of some significance that increasing phosphate levels from 1990 to 1994 occurred during a period that included three of the driest years in this period (Figure 1); inorganic nitrogen showed no obvious change at this time (Figure 3). However, other short-term increases of phosphate, such as that from 1999 to 2001, occurred when rainfall was above average. However, the possibility that local variation that more closely links nutrient levels and rainfall is masked in this national assessment cannot be discounted.
Discussion
The data presented here support the conclusion that after a long increase to levels that would be classified as not tolerable, phosphate levels after 2008 dramatically decreased on a national scale. It is also notable that the change in dissolved phosphate was rapid, with the major changes occurring in only 1 year. Because the change happened at a national scale, changes at a more local scale are less likely to be drivers. This raises the question as to what drove this rapid shift, and maintained the recent lowered levels of phosphate.
As noted earlier, the major widespread sources of phosphate in fresh water in South Africa include agricultural effluent and sewage, with a significant phosphate load coming from detergents, especially washing powders. Agricultural effluent could comprise effluent from stocking-intensive operations, nutrient-enriched returns from agricultural operations, and other practices that release nutrients to ground- or surface water. Phosphate is a highly charged and reactive ion that is strongly sorbed by most sediments and which is capable of binding with a number of metal cations, all of which limit its transport in groundwater.44,45 In contrast, nitrates are more labile but can be removed by denitrification.46 Nevertheless, phosphates can move through soil, albeit slowly44-45, and can be mobilised depending on soil and groundwater chemistry47. The implication is that while nitrogen can leach from soil where agricultural lands are fertilised or nutrient contaminated, phosphate leaching is likely to be more limited, but can occur, particularly when nutrient application has been prolonged. Phosphate input from agricultural regions can also occur as surface water run-off. This contribution may be significant when considering common thunderstorm rainfall events in South Africa, in which soil that has been fertilised is washed off into water resources, together with any adsorbed phosphorus compounds.
Over the period 2007-2008, the price of phosphate rock increased dramatically.48 Prices recovered in 2009, although at a higher level than before 2007. The majority of phosphate rock is used in the production of fertiliser, although smaller amounts are used in detergent production, feed additives and chemical production.49 The increased phosphate rock price was accompanied by an increased fertiliser price, both internationally48 and locally50. Fertiliser consumption (in kilograms per hectare of arable land) in South Africa decreased slightly in 2008, although the magnitude did not approach that of the price increases (data from World Bank51). After 2008, fertiliser consumption normalised in 2009, fell further in 2010, and then normalised thereafter. Overall, fertiliser consumption in South Africa has changed little since 2006 and is far below world average consumption. Changes in fertiliser application seem not to be the cause of the decreased riverine phosphate levels.
Much has been written of the negative impact of South African wastewater treatment works on river and reservoir trophic status.14,15,21-23 Smaller wastewater treatment works, which often have no phosphate removal process and are more subject to failure, pose a greater risk in this regard than do larger operations.52 The Green Drop certification programme is a benchmarking initiative that commenced in 2008 and aims to improve wastewater management in the country.53 Results from the scores have shown better service delivery with time, but the improvement has not been dramatic.53,54 Given the recent start, this programme cannot assess changes that happened before 2008. However, inspection of changes in inorganic nitrogen show that levels after 2008 are about six times lower than those around 2008, and three times lower than those around 2000. In comparison, phosphate levels decreased roughly fourfold from around 2008 to later years. As wastewater treatment plants may produce both nitrogen and phosphate in their effluents32, it is possible that improvements in wastewater treatment, either in terms of facilities or wastewater treatment works management, may have contributed to the decrease in phosphate observed recently. The relatively unchanged N:P ratio in the years since 2009 supports the likelihood that decreases in both nutrients may have the same cause. However, this finding is not conclusive as other causes may have contributed to the observed changes.
The impacts of wastewater treatment works on phosphate in rivers is a consequence of sewage phosphorus and detergent phosphorus entering the facility. Quayle et al.27 estimated that detergent phosphorus made up 32% of the total phosphorus found in domestic sewage, and contributed up to 30% of the phosphorus loading of receiving reservoirs.
A major producer of laundry detergent in the country removed builder phosphorus from all its products in 201018,27, and a reduction in wastewater effluent phosphorus at the majority of plants assessed was noted a year later18. As noted above, this removal would have led to a reduction of phosphate loading in receiving water bodies on a national scale, and may partially explain the observed reduction in phosphate. However, the reduction of phosphate reported here commenced in 2008 or 2009, and removal of phosphorus from laundry detergents in 2010 cannot account for these changes alone, although it is possible that the phosphorus removal process started earlier. It seems likely that a combination of reductions in nutrient loading from wastewater treatment plants and the removal of builder phosphate from detergents has contributed to the decrease in phosphate noted here.
It has long been known that inorganic phosphate in reservoirs is subject to rapid uptake by biota, or adsorption to silt, and transfer to the sediments by sedimentation.55 On the face of it, it would seem that reduced phosphate loads together with sedimentation would remove phosphate from water bodies and reduced phosphate loads would lead to a rapid reduction in eutrophication. However, internal phosphorus cycling results in the release of phosphate from the sediment, with rates modified by various physicochemical and biotic parameters.56-59 Sediment phosphorus is found in a wide range of compounds, and bioavailability varies among them.60 Sediment phosphate loading and release may significantly delay the recovery of eutrophic systems once phosphate loading is limited.56
In conclusion, levels of phosphate have recently dropped in South African surface waters - a trend largely matching that seen more recently in inorganic nitrogen. During this change, levels fell from a point at which national guidelines were exceeded to a more acceptable level. Despite the changes, phosphate levels, although tenfold lower, remain relatively higher than inorganic nitrogen levels. These trends were found on a national scale, and local variation may mask the trend in places. Given the links between phosphate levels and eutrophication, decreased phosphate loading bodes well for eutrophication management, although internal phosphorus cycling will mean that eutrophic and hypereutrophic water bodies will not recover in the immediate future. Nevertheless, the recent period with decreased phosphate levels has been relatively short, and no firm conclusions as to long-term phosphate levels can be made as yet.
Acknowledgements
This study was based on observations made during projects funded by the Water Research Commission and USAID. The Centre receives additional funding from Unilever. Data are from the Department of Water and Sanitation's WMS database. The World Bank and the South African Weather Service provided rainfall data; D.C.H. Retief contributed the observation that phosphate levels decreased as the price of phosphate rock increased; S. Vetter reviewed the draft manuscript; and two anonymous reviewers provided valuable input.
References
1. Smith VH, Schindler DW. Eutrophication science: Where do we go from here? Trends Ecol Evol. 2009;24(4):201-207. https://doi.org/10.1016/j.tree.2008.11.009 [ Links ]
2. Seitzinger SP, Mayorga E, Bouwman AF, Kroeze C, Beusen AHW, Billen G, et al. Global river nutrient export: A scenario analysis of past and future trends. Global Biogeochem Cy. 2010;24, GB0A08. https://doi.org/10.1029/2009gb003587 [ Links ]
3. Schindler DW. Recent advances in the understanding and management of eutrophication. Limnol Oceanogr. 2006;51:356-363. https://doi.org/10.4319/lo.2006.51.1_part_2.0356 [ Links ]
4. Smith VH. Responses of estuarine and coastal marine phytoplankton to nitrogen and phosphorus enrichment. Limnol Oceanogr. 2006;51:377-384. https://doi.org/10.4319/lo.2006.51.1_part_2.0377 [ Links ]
5. Smith VH, Tilman GD, Nekola JC. Eutrophication: Impacts of excess nutrient inputs on freshwater, marine, and terrestrial ecosystems. Environ Pollut. 1999;100:179-196. https://doi.org/10.1016/S0269-7491(99)00091-3 [ Links ]
6. Elser JJ, Bracken MES, Cleland EE, Gruner DS, Harpole WS, Hillebrand H, et al. Global analysis of nitrogen and phosphorus limitation of primary producers in freshwater, marine and terrestrial ecosystems. Ecol Lett. 2007;10:1135-1142. https://doi.org/10.1111/j.1461-0248.2007.01113.x [ Links ]
7. Sharpley S, Jarvie HP, Buda A, May L, Spears B, Kleinman P. Phosphorus legacy: Overcoming the effects of past management practices to mitigate future water quality impairment. J Environ Qual. 2013;42:1308-1326. https://doi.org/10.2134/jeq2013.03.0098 [ Links ]
8. Zamparas M, Zacharias I. Restoration of eutrophic freshwater by managing internal nutrient loads. A review. Sci Total Environ. 2014;496:551-562. https://doi.org/10.1016/j.scitotenv.2014.07.076 [ Links ]
9. De Villiers S, Thiart C. The nutrient status of South African rivers: Concentrations, trends and fluxes from the 1970s to 2005. S Afr J Sci. 2007;103:343-349. [ Links ]
10. Falkowski P, Scholes RJ, Boyle E, Canadell J, Canfield D, Elser J, et al. The global carbon cycle: A test of our knowledge of earth as a system. Science. 2000;290:291-296. https://doi.org/10.1126/science.290.5490.291 [ Links ]
11. Hohls BC, Silberbauer MJ, Kühn AL, Kempster PL, Van Ginkel CE. National water resource quality status report: Inorganic chemical water quality of surface water resources in SA - the big picture. Report no. N/0000/REQ0801. Pretoria: Institute for Water Quality Studies, Department of Water Affairs and Forestry; 2002. [ Links ]
12. Van Ginkel CE. Eutrophication: Present reality and future challenges for South Africa. Water SA. 2011;37(5):693-701. https://doi.org/10.4314/wsa.v37i5.6 [ Links ]
13. Van Ginkel CE. Algae, phytoplankton and eutrophication research and management in South Africa: Past, present and future. Afr J Aquat Sci. 2012;37(1):17-25. https://doi.org/10.2989/16085914.2012.665432 [ Links ]
14. Council for Scientific and Industrial Research (CSIR). A CSIR perspective on water in South Africa - 2010. CSIR report no. CSIR/NRE/PW/IR/2011/0012/A. Pretoria: CSIR; 2010. [ Links ]
15. South African Department of Water Affairs (DWA). Planning level review of water quality in South Africa. Sub-series no. WQP 2.0. Pretoria : DWA; 2011. [ Links ]
16. South African Department of Water Affairs (DWA). The annual national state of water resources report October 2011 to September 2012. Pretoria: DWA; 2011. [ Links ]
17. Matthews MW. Eutrophication and cyanobacterial blooms in South African inland waters: 10 Years of MERIS observations. Remote Sens Environ. 2014;155:161-177. https://doi.org/10.1016/j.rse.2014.08.010 [ Links ]
18. Harding WR. Living with eutrophication in South Africa: A review of realities and challenges. Trans Roy Soc S Afr. 2015;70(2):155-171. https://doi.org/10.1080/0035919X.2015.1014878 [ Links ]
19. Dabrowski JM, De Klerk LP. An assessment of the impact of different land use activities on water quality in the upper Olifants River catchment. Water SA. 2013;39(2):231-244. https://doi.org/10.4314/wsa.v39i2.6 [ Links ]
20. Rossouw JN. Final report on the development of management-orientated models for eutrophication control. WRC report no. 174/1/90. Pretoria: Water Research Commission; 1990. [ Links ]
21. Harding WR. The determination of annual phosphorus loading limits for South African dams. WRC report no. 1687/1/08. Pretoria: Water Research Commission; 2008. [ Links ]
22. Momba MNB, Osode AN, Sibewu M. The impact of inadequate wastewater treatment on the receiving water bodies - Case study: Buffalo City and Nkokonbe Municipalities of the Eastern Cape Province. Water SA. 2006;32(5):687-692. [ Links ]
23. Oberholster PJ, Botha A-M, Chamier J, De Klerk AR. Longitudinal trends in water chemistry and phytoplankton assemblage downstream of the Riverview WWTP in the Upper Olifants River. Ecohydrol Hydrobiol. 2013;13:41-51. https://doi.org/10.1016/j.ecohyd.2013.03.001 [ Links ]
24. Vos AT, Roos JC. Causes and consequences of algal blooms in Loch Logan, an urban impoundment. Water SA. 2005;31(3):385-392. [ Links ]
25. Nyenje PM, Foppen JW, Uhlenbrook S, Kulabako R, Muwanga A. Eutrophication and nutrient release in urban areas of sub-Saharan Africa - A review. Sci Total Environ. 2010;4-8:447-455. https://doi.org/10.1016/j.scitotenv.2009.10.020 [ Links ]
26. Pillay M. Detergent phosphorus in South Africa: Impact on eutrophication with specific reference to the Umgeni Catchment [MSc thesis]. Durban: University of Natal; 1994. [ Links ]
27. Quayle LM, Dickens CWS, Graham M, Simpson D, Goliger A, Dickens JK, et al. Investigation of the positive and negative consequences associated with the introduction of zero-phosphate detergents into South Africa. WRC report no. TT 446/10. Pretoria: Water Research Commission; 2010. [ Links ]
28. Ashton PJ, Dabrowski JM. An overview of surface water quality in the Olifants River catchment. WRC report no. KV 293/11. Pretoria: Water Research Commission; 2011. [ Links ]
29. Griffin NJ, Palmer CG, Scherman P-A. Critical analysis of environmental water quality in South Africa: Historic and current trends. WRC report no. 2184/1/14. Pretoria: Water Research Commission; 2014. [ Links ]
30. Du Plessis HM, Van Veelen M. Water quality: salinization and eutrophication time series and trends in South Africa. S Afr J Sci. 1991;87:11-16. [ Links ]
31. De Villiers S. The deteriorating nutrient status of the Berg River, South Africa. Water SA. 2007;33(5):659-664. [ Links ]
32. Carey RO, Migliaccio KW. Contribution of wastewater treatment plant effluents to nutrient dynamics in aquatic systems: A review. Environ Manage. 2009;44:205-217. https://doi.org/10.1007/s00267-009-9309-5 [ Links ]
33. Helsel D. Statistics for censored environmental data using Minitab and R. 2nd ed. Hoboken, NJ: John Wiley and Sons; 2012. [ Links ]
34. O'Brien PC, Fleming TR. A paired Prentice-Wilcoxon test for censored paired data. Biometrics. 1987;43(1):169-180. https://doi.org/10.2307/2531957 [ Links ]
35. R Core Team. R: A language and environment for statistical computing. Vienna: R Foundation for Statistical Computing; 2013. Available from: http://www.R-project.org [ Links ]
36. Lee L. NADA: Nondetects and data analysis for environmental data. R package version 1.5-6. 2013. Available from: http://CRAN.R-project.org/package=NADA [ Links ]
37. Ripley B, Lapsley ML. RODBC: ODBC Database access. R package version 1.3-5. 2012. Available from: http://CRAN.R-project.org/package=RODBC [ Links ]
38. Dragulescu AA. xlsx: Read, write, format Excel 2007 and Excel 97/2000/XP/2003 files. R package version 0.5.7. 2012. Available from: http://CRAN.R-project.org/package=xlsx [ Links ]
39. Wickham H. The split-apply-combine strategy for data analysis. J Stat Softw. 2011;40(1):1-29. https://doi.org/10.18637/jss.v040.i01 [ Links ]
40. Wickham H. ggplot2: Elegant graphics for data analysis. New York: Springer; 2009. [ Links ]
41.Wickham H. scales: Scale functions for graphics. R package version 0.2.3. 2012. Available from: http://CRAN.R-project.org/package=scales [ Links ]
42. Downing JA, McCauley E. The nitrogen:phosphorus relationship in lakes. Limnol Oceanogr. 1992;37(5):936-945. https://doi.org/10.4319/lo.1992.37.5.0936 [ Links ]
43. Teubner K, Dokulil MT. Ecological stoichiometry of TN:TP:SRSi in freshwaters: Nutrient ratios and seasonal shifts in phytoplankton assemblages. Arch Hydrobiol. 2002;154(4):625-646. https://doi.org/10.1127/archiv-hydrobiol/154/2002/625 [ Links ]
44. Robertson WD, Schiff SL, Ptacek CJ. Review of phosphate mobility and persistence in 10 septic system plumes. Ground Water. 1998;36(6):1000-1010. https://doi.org/10.1111/j.1745-6584.1998.tb02107.x [ Links ]
45. Spiteri C, Slomp CP, Regnier P, Meile C, Van Cappellen P. Modelling the geochemical fate and transport of wastewater-derived phosphorus in contrasting groundwater systems. J Contam Hydrol. 2007;92:87-108. https://doi.org/10.1016/j.jconhyd.2007.01.002 [ Links ]
46. Rivett MO, Buss SR, Morgan P, Smith JWN, Bemment CD. Nitrate attenuation in groundwater: A review of biogeochemical controlling processes. Water Res. 2008;42:4215-4232. https://doi.org/10.1016/j.watres.2008.07.020 [ Links ]
47. Smolders AJP, Lucassen ECHET, Bobbink T, Roelofs JGM, Lamers LPM. How nitrate leaching from agricultural lands provokes phosphate eutrophication in groundwater fed wetlands: The sulphur bridge. Biogeochemistry. 2010;98:1-7. https://doi.org/10.1007/s10533-009-9387-8 [ Links ]
48. Ott H. Fertilizer markets and their interplay with commodity and food prices. Report EUR 25392 EN. Seville: Joint Research Centre, European Commission; 2012. [ Links ]
49. Van Vuuren DP, Bouwman AF, Beusen AHW. Phosphorus demand for the 1970-2100 period: A scenario analysis of resource depletion. Global Environ Chang. 2010;20:428-439. https://doi.org/10.1016/j.gloenvcha.2010.04.004 [ Links ]
50. Grain SA. Grain SA fertilizer report. Pretoria: Grain SA; 2011. [ Links ]
51. World Bank. Fertilizer consumption (kilograms per hectare of arable land) [document on the Internet]. c2017 [cited 2017 Jan 18]. [ Links ] Available from: http://data.worldbank.org/indicator/AG.CON.FERT.ZS
52. Gaydon P, McNab N, Mulder G, Pillay I, Sahibdeen M, Thompson P. Evaluation of sewage treatment package plants for rural, peri-urban and community use. WRC report no. 1539/1/06. Pretoria: Water Research Commission; 2007. [ Links ]
53. Brettenny W, Sharp G. Efficiency evaluation of urban and rural municipal water service authorities in South Africa: A data envelopment analysis approach. Water SA. 2016;42(1):11-19. https://doi.org/10.4314/wsa.v42i1.02 [ Links ]
54. South African Department of Water and Sanitation. Green drop system [homepage on the Internet]. c2017 [cited 2017 Mar 22]. [ Links ] Available from: https://www.dwa.gov.za/dir_ws/gds/
55. Rigler FH. A tracer study of the phosphorus cycle in lake water. Ecology. 1956;37(3):550-562. https://doi.org/10.2307/1930179 [ Links ]
56. Ripl W. Internal phosphorus recycling mechanisms in shallow lakes. Lake Reserv Manage. 1986;2(1):138-142. https://doi.org/10.1080/07438148609354616 [ Links ]
57. Jensen HS, Andersen FO. Importance of temperature, nitrate, and pH for phosphate release from aerobic sediments of four shallow, eutrophic lakes. Limnol Oceanogr. 1992;37(3):577-589. https://doi.org/10.4319/lo.1992.37.3.0577 [ Links ]
58. Reddy KR, Diaz OA, Scinto LJ, Agami M. Phosphorus dynamics in selected wetlands and streams of the lake Okeechobee Basin. Ecol Eng. 1995;5:183-207. https://doi.org/10.1016/0925-8574(95)00024-0 [ Links ]
59. Golterman HR. Phosphate release from anoxic sediments or 'What did Mortimer really write?' Hydrobiologia. 2001;450:99-106. https://doi.org/10.1023/A:1017559903404 [ Links ]
60. Reitzel K, Ahlgren J, Gogoll A, Jensen HS, Rydin E. Characterization of phosphate in sequential extracts from lake sediments using 31P nuclear magnetic resonance spectroscopy. Can J Fish Aquat Sci. 2006;63:1686-1699. https://doi.org/10.1139/f06-070 [ Links ]
 Correspondence:
Neil Griffin
Email: n.griffin@ru.ac.za
Received: 20 Jan. 2017
Revised: 04 May 2017
Accepted: 24 June 2017

