


Serviços Personalizados
Artigo
 Inglês (pdf)
 Artigo em XML
 Referências do artigo
Indicadores

Links relacionados
-
 Citado por Google
 -
 Similares em Google
Compartilhar

 Permalink
South African Journal of Science
versão On-line ISSN 1996-7489
versão impressa ISSN 0038-2353
S. Afr. j. sci. vol.113 no.11-12 Pretoria Nov./Dez. 2017
http://dx.doi.org/10.17159/sajs.2017/20160201
RESEARCH ARTICLE
Forecasting winter wheat yields using MODIS NDVI data for the Central Free State region
Zinhle MashabaI, II; George ChirimaI, III; Joel O. BotaiII, IV; Ludwig CombrinckII; Cilence MunghemezuluII; Ernest DubeV
IAgricultural Research Council - Institute for Soil, Climate and Water, Pretoria, South Africa
IIDepartment of Geography, Geoinformatics and Meteorology, University of Pretoria, Pretoria, South Africa
IIISchool of Animal, Plant and Environmental Sciences, University of the Witwatersrand, Johannesburg, South Africa
IVSouth African Weather Service, Pretoria, South Africa
VAgricultural Research Council - Small Grain Institute Production Systems, Bethlehem, South Africa
ABSTRACT
Consumption of wheat is widespread and increasing in South Africa. However, global wheat production is projected to decline. Wheat yield forecasting is therefore crucial for ensuring food security for the country. The objective of this study was to investigate whether the anthesis wheat growth stage is suitable for forecasting dryland wheat yields in the Central Free State region using satellite imagery and linear predictive modelling. A period of 10 years of Normalized Difference Vegetation Index data smoothed with a Savitzky-Golay filter and 10 years of wheat yield data were used for model calibration. Diagnostic plots and statistical procedures were used for model validation and assessment of model adequacy. The period 30 days before harvest during the anthesis stage was established to be the best period during which to use the linear regression model. The calibrated model had a coefficient of determination of 0.73, a p-value of 0.00161 and a root mean squared error of 0.41 tons/ha. Residual plots confirmed that a linear model had a good fit for the data. The quantile-quantile plot provided evidence that the residuals were normally distributed, which means that assumptions of linear regression were fulfilled and the model can be used as a forecasting tool. Model validation showed high levels of accuracy. The evidence indicates that use of Moderate Resolution Imaging Spectroradiometer data during the anthesis growth stage is a reliable, cost-effective and potentially time-saving alternative to ground-based surveys when forecasting dryland wheat yields in the Central Free State.
SIGNIFICANCE:
•Developing a cost-effective technique based on satellite imagery for wheat yield forecasting is vital for food security planning in South Africa.
Keywords: dryland wheat; wheat yield; NDVI; MODIS; food security
Introduction
Wheat (Triticum aestivum L.) is an important crop in many parts of the world including South Africa, where it is the second largest component of the staple diet after maize.1,2 Consequently, it is crucial to predict wheat yields as global wheat production is expected to decrease under conventional management as a result of climate variability.3,4 Additionally, a challenge exists to feed a growing human population while avoiding environmental problems such as deforestation and land degradation.5 The central Free State Province of South Africa is a land-locked, dryland wheat production region, which exhibits variable agricultural production as a consequence of droughts and a reduced capacity to operate in world markets owing to high transport costs and foreign exchange constraints.6,7 In order to ensure food security, there is a need for generating timely and accurate information on crop yields.8 We report here on the development of a reliable estimate of wheat yields using the Moderate Resolution Imaging Spectroradiometer - Normalized Difference Vegetation Index (MODIS-NDVI). Accurate forecasting of the yield potential of dryland wheat in the Central Free State region will aid agricultural decision-makers in balancing the trade of agricultural commodities and reducing short-term price instabilities.9
Commonly, yield forecasting models are more reliable if applied during specific critical plant growth stages. For wheat, the anthesis (or flowering) stage appears to be an important stage.10-12 During this time, water deficiencies lead to yield losses by reducing the spike and spikelet numbers, as well as the fertility of the remaining spikelets.13 Water shortages during this stage also accelerate leaf senescence and reduce the rate of grain filling, thereby reducing the mean kernel weight.14 High temperatures reduce the number of grains per ear, kernel weight and harvest index, leading to reduced grain yields.15
Vegetation indices derived from remote sensing technology are often used for crop monitoring and crop yield estimates.2 The technique is based on the assumption that spectral data are related to canopy reflectance parameters which, in turn, are related to the final yield.16,17 The NDVI used in this study can be used as an indicator of the photosynthetic potential of a vegetation canopy.18 The NDVI makes use of the near infrared band and visible red band in the electromagnetic spectrum.19 The limitation of this index is that it gets saturated in areas with dense biomass, but hyperspectral data can overcome this limitation.20,21 Hyperspectral imaging is, however, costly as it requires a dedicated campaign, has a limited extent and a complex data structure compared to MODIS data, which is freely available.
Numerous studies have used NDVI derived from various remotely sensed images for crop yield estimations.22-24 For example, Yang et al.22 evaluated the accuracy of QuickBird satellite imagery and airborne imagery for mapping grain sorghum yield patterns. The results illustrated that QuickBird and airborne imagery had similar correlations with grain yield at 2.8-m and 8.4-m resolutions. Nuarsa et al.23 estimated rice yields using an exponential model derived from Landsat Enhanced Thematic Mapper plus (ETM+) NDVI and field-observed rice yield in the Tabanan Regency. The study observed a coefficient of determination (R2) and standard error of 0.852 and 0.077 tons/ha, respectively. Mutanga et al.24 determined the optimal time for predicting sugarcane yield to be 2 months before harvest using NDVI derived from SPOT images.
However, few studies have been done on using remote sensing data for yield estimation in South Africa.25,26 For example, Unganai and Kogan25 demonstrated that corn yields can be estimated using Advanced Very High Resolution Radiometer (AVHRR) data with a spectral resolution of 0.58-12.5 µm. In the study it was found that Vegetation Condition Index and Temperature Condition Index derived from AVHRR data are highly correlated with corn yields. Frost et al.26 demonstrated that Terra MODIS (0.6-1.1 µm) satellite sensor data products can be applied for maize yield estimation in South Africa. In that study, the window method was used and the resulting window periods showed that average NDVI and average Enhanced Vegetation Index data can be used for maize yield estimations.
Further studies are needed in South Africa on using remote sensing for yield predictions. This topic is important because wheat production is decreasing as a result of weather variability within the summer rainfall region, the deregulation of the wheat industry, and farmers converting to sustainable crops (e.g. soybean and canola).1 Furthermore, timeous generation of yield projections will support timeous decisions concerning either importation or exportation of wheat. Therefore, the overall objective of this study was to develop a yield model for dryland winter wheat for the Central Free State region using MODIS data. This objective was undertaken by investigating whether wheat yields in that region are correlated with the MODIS-NDVI during the anthesis stage10-12, and validating the performance and adequacy of the calibrated model.
Data and methods
Study area
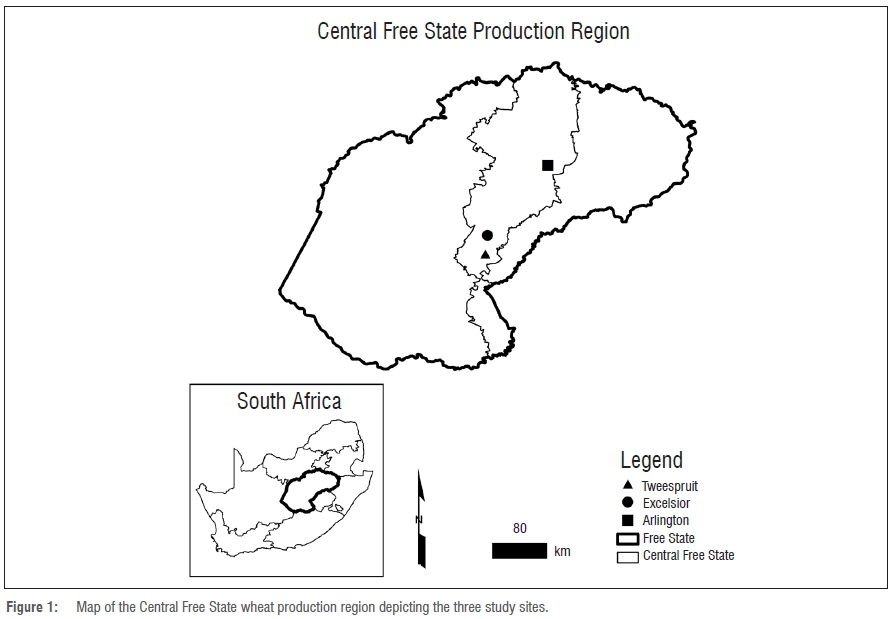
The Free State Province hosts four distinct dryland wheat production regions: Central Free State, North Western Free State, South Western Free State and Eastern Free State.27,28 These regions receive summer rainfall and experience frequent droughts. Therefore, farmers adopt farm management practices which make efficient use of rain for crop production. The underlying geology of the Free State is rocks from the Beaufort and Ecca Groups of the Karoo Supergroup, which make up the parent material for the soils.27 The study sites of Arlington, Tweespruit and Excelsior are in the Central Free State wheat production region (Figure 1). These sites are part of the National Wheat Cultivar Evaluation Programme conducted by the Small Grain Institute of the Agricultural Research Council (ARC-SGI). The programme delivers information about the performance of wheat varieties from the major breeding companies of South Africa. The sites were selected systematically in a manner such that they are representative of all the production conditions of this geographical region.29 Dryland wheat planting normally takes place from the first week of July (South African winter).28
MODIS-NDVI
The 16-day composite MODIS-NDVI (MOD13Q1) product images with a 250-m resolution used in this study are freely available from the US National Aeronautical Space Agency (NASA) Earth Observing System (EOS) website. The data obtained were for a 10-year period from 2000 to 2013 (excluding years 2001, 2002, 2008 and 2011) based on the available wheat yield data collected at the study sites. The MOD13Q1 product is computed from the surface reflectance of each band (red and near-infrared) as it would have been measured at ground level if there was no atmospheric scattering or absorption.30 During data processing, corrections are made for the effects of atmospheric gases, aerosols and thin cirrus clouds.31
The downloaded MODIS-NDVI images were reprojected from Sinusoidal Projection to Geographic Projection using the MODIS Reprojection Tool.32 Additionally, rescaling of the raster images had to be done to correct the range of NDVI values to range from -1 to 1. The raster images were cropped with the wheat boundaries obtained from the ARC in collaboration with Geo Terra Image and Spatial Business Intelligence. The values for NDVI were extracted for each of the wheat boundary pixels at the three localities.
Wheat yield data
Annual wheat yield data for 10 seasons (2000-2013 excluding 2001, 2002, 2008 and 2011) were used for this study. These data were collected by the ARC-SGI under the National Wheat Cultivar Evaluation Programme. A randomised complete block design was used for the entire trials layout. The trials were planted inside non-irrigated wheat fields, in line with crop management practices with regard to tillage practices, seeding rates, weed control, fertiliser application, pest and disease control as well as planting date. The dryland wheat trials consist of five rows that are each 5 m long with an inter-row spacing of 0.45 m. The harvest area is 5 m × 1.35 m, represented by three central rows. In order to adequately test the cultivars on the planting date spectrum, which is as long as 3 months, two independent randomised trials (early and late planting) were planted at all sites within the geographical regions.
Savitzky-Golay filter applied to NDVI time series
The Savitzky-Golay33 (S-G) filter algorithm was used to smooth out the MODIS-NDVI data. The S-G filter is based on local least-squares polynomial approximation. The advantages of the S-G filter are that it preserves features of the data such as relative maxima, minima and widths.34 The S-G smoothing algorithm is given by Equation 1:
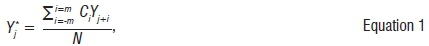
where is the filtered value, Ci is the coefficient for the i-th NDVI value of the filter, Yj+i represents the original NDVI value, and N is the number of convoluting integers equal to smoothing window size (2m+1).33 The larger the value of m, the smoother the results at the expense of flattening sharp peaks.34
Model development
A linear regression model was developed between the average yield of different late planted wheat cultivars and the average NDVI for the three study sites. The average yield was considered to be an independent variable and the average NDVI was considered to be a dependent variable according to:

where P(Y|x) is the predicted yield as function of NDVI, x is the NDVI, β0 is the coefficient and β1 is the constant for winter wheat yield. Different models (logarithmic, exponential and power) were compared for the purpose of evaluating the models so that the best fitting model was selected.35 Other studies2,12,36 have found the linear model to be ideal for winter wheat yield and NDVI in various regions.
Model validation
Statistical tests were performed to validate the performance of the model. The goodness of fit of the model and the percentage of variance explained by the model were assessed using the coefficient of determination. The significance of the model was tested by means of p-values. The root mean squared error (RMSE) was also included in the analysis. Diagnostic plots were constructed to compare the observed yield and the predicted yield. The residuals were plotted against the wheat yield, which was necessary to check for linearity of the data and the presence or absence of inhomogeneity of variance.37 Additionally, a quantile-quantile (Q-Q) residual plot was used to assess how close the theoretical distribution was to the model distribution. A normal distribution is indicated by a strong linear pattern for the sample points, and outliers can also be detected by visual inspection of the plot.38 These validation methods differ from the widely used methods, which mostly focus on the RMSE and comparing the correlation between observed yield and predicted yield. The validation techniques also aided in understanding the underlying trends in the data.
Model testing
The NDVI data for the years 2001, 2002, 2008, 2011 and 2014 were used for model testing. These years were not used in model calibration and model validation. The NDVI of these years was used to predict the expected wheat yield. The predicted yield was then subtracted from the observed yield and the percentage error was calculated for the observed yield. The standard error was used as a measure of the accuracy of the predicted yield for which values close to zero indicate high accuracy. The year 2015 could not be used in the analysis because of severe drought in the non-irrigated wheat regions.
Results and discussion
Relationships between wheat yield and NDVI data
The best fitting model between wheat yield and NDVI was developed by using the Zadoks scale39 to identify the critical growth stages of wheat. According to previous research carried out in other regions, the most critical growth stage for dryland wheat is anthesis.10-12 This stage was also highly correlated with the final wheat yield in the Central Free State, as with other regions. The linear relationship between the average yield and average NDVI is represented by Equation 3:

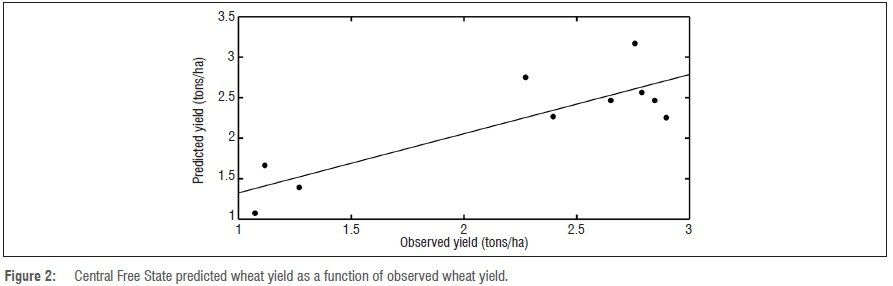
In this study, the seasonal maximum NDVI was used to correlate with average wheat yields. This time occurs approximately 30 days prior to harvest during the first week of November (day of year 305 in regular years). The range of NDVI values for the model is 0.32-0.49 (Figure 2). These values fall within the threshold indicated by Ren et al.2 for winter wheat of 0.2-0.8. The model was calibrated using NDVI but other parameters such as growing degree days or heat units, soil conditions and weather conditions can also be considered in order to improve the accuracy of the model.
Model validation
The regression models' predicted yield was compared with the observed yield from the 10-year winter wheat yield data (Figure 2). The p-value was 0.00161 (p<0.05) and the R2 value was 0.73 between wheat yield and NDVI, indicating a good relationship between the variables. These results are similar to those reported by Lopresti12 of an R2 of 0.75 for winter wheat yield in Northern Buenos Aires Province, Argentina. The similarity of these results could be because both Argentina and South Africa are in the southern hemisphere. Periods for winter wheat production are similar for both countries because the seasonal cycles (winter from June to September) coincide. However, Ren et al.2 observed an R2 of 0.88 for Shandong (China) when relating the production of winter wheat with the accumulated MODIS-derived NDVI.
The RMSE of the calibrated model was validated against the observed yield. An RMSE of 0.41 tons/ha results from using the least squares regression line to predict the wheat yield. Becker-Reshef et al.8 reported a similar RMSE of 0.44 tons/ha for Kansas using MODIS-NDVI for wheat forecasting. Moriondo et al.11 observed an RMSE of 0.44 tons/ha and 0.47 tons/ha, respectively, when using AVHRR-NDVI data to develop a wheat yield model for two Italian provinces.
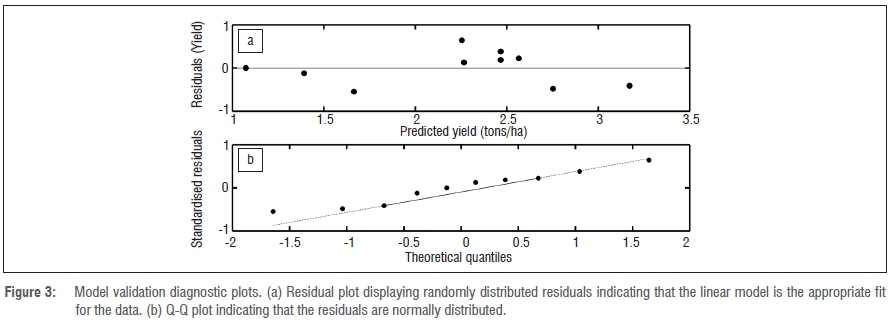
Diagnostic plots were constructed to assess the fit of the model and whether the residuals are normally distributed. Residual plots (Figure 3a) were used to determine if the model was linear. Linear models have a random scatter of data points whereas non-linear models have a distinctive pattern.37 A random dispersal of the residuals was observed, which means that the linear model is an ideal fit between the wheat yield and NDVI. The Q-Q plot depicted in Figure 3b indicated that the residuals are homogeneous, although small variations were present at the lower and upper tails of the plot. Periods of drought could induce such variations (outliers) and reduce the wheat yield as dryland wheat relies on residual soil moisture for growth. Overall, the residuals are normally distributed as they lie close to a straight line.
These diagnostic plots were necessary as other studies have observed different relationships between vegetation indices and crop yields. Hayes and Decker40 observed a quadratic relationship between a satellite data variable, Vegetation Condition Index, Crop Moisture Index and a climatological variable for predicting maize production. The R2-value of the model was 0.73. Ma et al.41 reported a power function to be representative of the relationship between soybean yield and canopy reflectance measurements at different soil types. The R2-value of the model was 0.80. Benedetti and Rossini42, Ren et al.2 and Lopresti et al.12 all observed a linear relationship between wheat yield and NDVI. However, Mkhabela et al.43 observed that a power function was representative of the relationship between NDVI and spring wheat in different environments. The differences in models for spring wheat and winter wheat could be induced by different weather conditions and irrigation as winter wheat in South Africa is not irrigated.
Model testing
The percentage errors in Table 1 indicate that the model slightly overestimated yield in 2002, 2008 and 2011 because the values are above 10%. However, the model performed well in 2001 as the percentage errors are within the threshold of ±10%. The model predicted wheat yield well in 2014 as this year did not fall within the 2000-2013 period for which the model was calibrated. The standard errors were close to zero, which means that the predicted yield has a reasonable level of accuracy and, thus, the model was reliable.
Throughout this study MODIS data from an optical sensor was used but synthetic aperture radar (SAR) data can also be used. The advantages of SAR are that it can operate during the day or night, and in rainy or cloudy conditions. However, SAR data require complex processing, by often specialised software such as the INAHOR44 and thus were not a focus of this study. Data provided by satellites at a high resolution, such as SPOT or RapidEye, are better for small-scale estimates of crop yield because many tiles are needed to cover a large area, which also is costly.
Conclusion
The prospect of using MODIS-NDVI for winter wheat yield forecasts in the Central Free State production region was investigated using regression models. Findings suggest the best time to relate MODIS-NDVI to final wheat yields for this area is the period leading to 30 days before harvest (first week of November). This period coincides with the anthesis stage, and at this time, wheat yield is highly correlated with NDVI. The relationship between NDVI and wheat yield was significant with an R2-value of 0.73, a p-value of 0.00161 and an RMSE of 0.41 tons/ha. Furthermore, diagnostic plots, model testing and validation provided evidence of the reasonable levels of model accuracy, model reliability and a good fit. These techniques complement the widely used techniques of comparing the correlation between the observed yields and predicted yields, and using the RMSE.
Acknowledgements
We thank the Agricultural Research Council, the National Research Foundation of South Africa and the University of Pretoria for funding. We thank the various collaborators (Geo Terra Image, Spatial Business Intelligence and the National Wheat Cultivar Evaluation Programme) for help in collecting the data on wheat farm boundaries and wheat yields. We also thank the Centre for Geoinformation Science of the University of Pretoria for their continued support.
Authors' contributions
Z.M. conceptualised and designed the study and wrote the first draft of the manuscript; G.C. was the project leader and budget owner; G.C., L.C. and J.O.B. modified, edited and approved the manuscript; C.M. was involved in data analysis; and E.D. edited the manuscript and was involved in field data collection.
References
1. Breitenbach MC, Fenyes TI. Maize and wheat production trends in South Africa in a deregulated environment. Agrekon. 2000;39(3):292-312. https://doi.org/10.1080/03031853.2000.9523578 [ Links ]
2. Ren J, Chen Z, Zhou Q, Tang H. Regional yield estimation for winter wheat with MODIS-NDVI data in Shandong, China. Int J Appl Earth Obs Geoinf. 2008;10(4):403-413. https://doi.org/10.1016/j.jag.2007.11.003 [ Links ]
3. Parry ML, Rosenzweig C, Iglesias A, Livermore M, Fischer G. Effects of climate change on global food production under SRES emissions and socio-economic scenarios. Glob Environ Change. 2004;14(1):53-67. https://doi.org/10.1016/j.gloenvcha.2003.10.008 [ Links ]
4. Ortiz R, Sayre KD, Govaerts B, Gupta R, Subbarao GV, Ban T, et al. Climate change: Can wheat beat the heat?. Agric Ecosyst Environ. 2008;126(1):46-58. https://doi.org/10.1016/j.agee.2008.01.019 [ Links ]
5. Balkovič J, Van der Velde M, Skalský R, Xiong W, Folberth C, Khabarov N, et al. Global wheat production potentials and management flexibility under the representative concentration pathways. Glob Planet Change. 2014;122:107-121. https://doi.org/10.1016/j.gloplacha.2014.08.010 [ Links ]
6. Hammer GL, Hansen JW, Phillips JG, Mjelde JW, Hill H, Love A, et al. Advances in application of climate prediction in agriculture. Agric Syst. 2001;70(2):515-553. https://doi.org/10.1016/S0308-521X(01)00058-0 [ Links ]
7. Byerlee D, Jayne TS, Myers RJ. Managing food price risks and instability in a liberalizing market environment: Overview and policy options. Food Policy. 2006;31(4):275-287. https://doi.org/10.1016/j.foodpol.2006.02.002 [ Links ]
8. Becker-Reshef I, Justice C, Sullivan M, Vermote E, Tucker C, Anyamba A, et al. Monitoring global croplands with coarse resolution earth observations: The Global Agriculture Monitoring (GLAM) project. Remote Sens. 2010;2(6):1589-1609. https://doi.org/10.3390/rs2061589 [ Links ]
9. Bastiaanssen WG, Ali S. A new crop yield forecasting model based on satellite measurements applied across the Indus Basin, Pakistan. Agric Ecosyst Environ. 2003;94(3):321-340. https://doi.org/10.1016/S0167-8809(02)00034-8 [ Links ]
10. Aparicio N, Villegas D, Araus JL, Casadesus J, Royo C. Relationship between growth traits and spectral vegetation indices in durum wheat. Crop Sci. 2002;42(5):1547-1555. https://doi.org/10.2135/cropsci2002.1547 [ Links ]
11. Moriondo M, Maselli F, Bindi M. A simple model of regional wheat yield based on NDVI data. Eur J Agron. 2007;26(3):266-274. https://doi.org/10.1016/j.eja.2006.10.007 [ Links ]
12. Lopresti MF, Di Bella CM, Degioanni AJ. Relationship between MODIS-NDVI data and wheat yield: A case study in Northern Buenos Aires province, Argentina. Inf Process Agric. 2015;2(2):73-84. https://doi.org/10.1016/j.inpa.2015.06.001 [ Links ]
13. Giunta F, Motzo R, Deidda M. Effect of drought on yield and yield components of durum wheat and triticale in a Mediterranean environment. Field Crops Res. 1993;33(4):399-409. https://doi.org/10.1016/0378-4290(93)90161-F [ Links ]
14. Royo C, Voltas J, Romagosa I. Remobilization of pre-anthesis assimilates to the grain for grain only and dual-purpose (forage and grain) triticale. Agron J. 1999;91(2):312-316. https://doi.org/10.2134/agronj1999.00021962009100020021x [ Links ]
15. Wheeler TR, Hong TD, Ellis RH, Batts GR, Morison JI, Hadley P. The duration and rate of grain growth, and harvest index, of wheat (Triticum aestivum L.) in response to temperature and CO2. J Exp Bot. 1996;47(5):623-630. https://doi.org/10.1093/jxb/47.5.623 [ Links ]
16. Carlson TN, Ripley DA. On the relation between NDVI, fractional vegetation cover, and leaf area index. Remote Sens Env. 1997;62(3):241-252. https://doi.org/10.1016/S0034-4257(97)00104-1 [ Links ]
17. Singh RA, Semwal DP, Rai A, Chhikara RS. Small area estimation of crop yield using remote sensing satellite data. Int J Remote Sens. 2002;23(1):49-56. https://doi.org/10.1080/01431160010014756 [ Links ]
18. Reed BC, Brown JF, VanderZee D, Loveland TR, Merchant JW, Ohlen DO. Measuring phenological variability from satellite imagery. J Veg Sci. 1994;5(5):703-714. https://doi.org/10.2307/3235884 [ Links ]
19. Tucker CJ. Red and photographic infrared linear combinations for monitoring vegetation. Remote Sens Env. 1979;8(2):127-150. https://doi.org/10.1016/0034-4257(79)90013-0 [ Links ]
20. Asner GP, Scurlock JM, Hicke JA. Global synthesis of leaf area index observations: Implications for ecological and remote sensing studies. Glob Ecol Biogeogr. 2003;12(3):191-205. https://doi.org/10.1046/j.1466-822X.2003.00026.x [ Links ]
21. Chen PY, Fedosejevs G, Tiscareno-Lopez M, Arnold JG. Assessment of MODIS-EVI, MODIS-NDVI and VEGETATION-NDVI composite data using agricultural measurements: An example at corn fields in western Mexico. J Env Monit Ass. 2006;119(1-3):69-82. https://doi.org/10.1007/s10661-005-9006-7 [ Links ]
22. Yang C, Everitt JH, Bradford JM. Comparison of QuickBird satellite imagery and airborne imagery for mapping grain sorghum yield patterns. Precis Agric. 2006;7(1):33-44. https://doi.org/10.1007/s11119-005-6788-0 [ Links ]
23. Nuarsa IW, Nishio F, Hongo C. Rice yield estimation using Landsat ETM+ data and field observation. J Agric Sci. 2011;4(3):45-56. https://doi.org/10.5539/jas.v4n3p45 [ Links ]
24. Mutanga S, Van Schoor C, Olorunju PL, Gonah T, Ramoelo A. Determining the best optimum time for predicting sugarcane yield using hyper-temporal satellite imagery. Adv Remote Sens. 2013;2(03):269-275. https://doi.org/10.4236/ars.2013.23029 [ Links ]
25. Unganai LS, Kogan FN. Drought monitoring and corn yield estimation in Southern Africa from AVHRR data. Remote Sens Env. 1998;63(3):219-232. https://doi.org/10.1016/S0034-4257(97)00132-6 [ Links ]
26. Frost C, Thiebaut N, Newby T. Evaluating Terra MODIS satellite sensor data products for maize yield estimation in South Africa. S Afr J Geom. 2013;2(2):106-119. [ Links ]
27. Hensley M, Le Roux P, Du Preez C, Van Huyssteen C, Kotze E, Van Rensburg L. Soils: The Free State's agricultural base. S Afr Geogr J. 2006;88(1):11-21. https://doi.org/10.1080/03736245.2006.9713842 [ Links ]
28. Agricultural Research Council. Guideline for the production of small grains in the summer rainfall areas. Bloemfontein: University of the Free State; 2014. Available from: http://www.arc.agric.za/arc-sgi/ [ Links ]
29. Dube E, Mare-Patose R, Kilian W, Barnard A, Tsilo TJ. Identifying high-yielding dryland wheat cultivars for the summer rainfall area of South Africa. S Afr J Plant Soil. 2016;33(1):77-81. https://doi.org/10.1080/02571862.2015.1061712 [ Links ]
30. Vermote EF, El Saleous NZ, Justice CO. Atmospheric correction of MODIS data in the visible to middle infrared: First results. Remote Sens Env. 2002;83(1):97-111. https://doi.org/10.1016/S0034-4257(02)00089-5 [ Links ]
31. Vermote EF, El Saleous N, Justice CO, Kaufman YJ, Privette JL, Remer L, et al. Atmospheric correction of visible to middle-infrared EOS-MODIS data over land surfaces: Background, operational algorithm and validation. J Geophys Res Atmos. 1997;102(D14):17131-17141. https://doi.org/10.1029/97JD00201 [ Links ]
32. Dwyer J, Schmidt G. The MODIS reprojection tool. In: Qu JJ, Gao W, Kafatos M, Murphy RE, Salomonson VV, editors. Earth science satellite remote sensing. Berlin: Springer; 2006. p. 162-177. https://doi.org/10.1007/978-3-540-37294-3_9 [ Links ]
33. Savitzky A, Golay MJ. Smoothing and differentiation of data by simplified least squares procedures. Anal Chem. 1964;36(8):1627-1639. https://doi.org/10.1021/ac60214a047 [ Links ]
34. Kim SR, Prasad AK, El-Askary H, Lee WK, Kwak DA, Lee SH, et al. Application of the Savitzky-Golay filter to land cover classification using temporal MODIS vegetation indices. Photogramm Eng Remote Sensing. 2014;80(7):675-685. https://doi.org/10.14358/PERS.80.7.675 [ Links ]
35. Mkhabela MS, Mkhabela MS, Mashinini NN. Early maize yield forecasting in the four agro-ecological regions of Swaziland using NDVI data derived from NOAA's-AVHRR. Agric Forest Meteorol. 2005;129(1):1-9. https://doi.org/10.1016/j.agrformet.2004.12.006 [ Links ]
36. Franch B, Vermote EF, Becker-Reshef I, Claverie M, Huang J, Zhang J, et al. Improving the timeliness of winter wheat production forecast in the United States of America, Ukraine and China using MODIS data and NCAR growing degree day information. Remote Sens Env. 2015;161:131-148. https://doi.org/10.1016/j.rse.2015.02.014 [ Links ]
37. Larsen WA, McCleary SJ. The use of partial residual plots in regression analysis. Technometrics. 1972;14(3):781-790. https://doi.org/10.1080/00401706.1972.10488966 [ Links ]
38. Ben MG, Yohai VJ. Quantile-quantile plot for deviance residuals in the generalized linear model. J Comput Graph Stat. 2012;13(1):36-47. https://doi.org/10.1198/1061860042949_a [ Links ]
39. Zadoks JC, Chang TT, Konzak CF. A decimal code for the growth stages of cereals. Weed Res. 1974;14(6):415-421. https://doi.org/10.1111/j.1365-3180.1974.tb01084.x [ Links ]
40. Hayes MJ, Decker WL. Using satellite and real-time weather data to predict maize production. Int J Biometeorol. 1998;42(1):10-15. https://doi.org/10.1007/s004840050077 [ Links ]
41. Ma BL, Dwyer LM, Costa C, Cober ER, Morrison MJ. Early prediction of soybean yield from canopy reflectance measurements. Agron J. 2001;93(6):1227-1234. https://doi.org/10.2134/agronj2001.1227 [ Links ]
42. Benedetti R, Rossini P. On the use of NDVI profiles as a tool for agricultural statistics: The case study of wheat yield estimate and forecast in Emilia Romagna. Remote Sens Env. 1993;45(3):311-326. https://doi.org/10.1016/0034-4257(93)90113-C [ Links ]
43. Mkhabela MS, Bullock P, Raj S, Wang S, Yang Y. Crop yield forecasting on the Canadian Prairies using MODIS NDVI data. Agric Forest Meteorol. 2011;151(3):385-393. https://doi.org/10.1016/j.agrformet.2010.11.012 [ Links ]
44. Oyoshi K, Tomiyama N, Okumura T, Sobue S. Mapping rice-planted areas using time-series synthetic aperture radar data for the Asia-RiCE activity. Paddy Water Environ. 2015;14(4):463-472. https://doi.org/10.1007/s10333-015-0515-x [ Links ]
 Correspondence:
Zinhle Mashaba
Email: MashabaZ@arc.agric.za
Received: 05 July 2016
Revised: 06 Feb. 2017
Accepted: 20 June 2017
FUNDING: Agricultural Research Council; National Research Foundation (South Africa); University of Pretoria

