


Services on Demand
Article
 English (pdf)
 Article in xml format
 Article references
Indicators

Related links
-
 Cited by Google
 -
 Similars in Google
Share

 Permalink
South African Journal of Science
On-line version ISSN 1996-7489
Print version ISSN 0038-2353
S. Afr. j. sci. vol.113 n.11-12 Pretoria Nov./Dec. 2017
http://dx.doi.org/10.17159/sajs.2017/20160381
RESEARCH ARTICLE
Bibliometric analysis of the development of nanoscience research in South Africa
Xolani Makhoba; Anastassios Pouris
Institute for Technological Innovation, University of Pretoria, Pretoria, South Africa
ABSTRACT
Nanotechnology is a fast-growing scientific research area internationally and is classified as an important emerging research area. In response to this importance, South African researchers and institutions have also increased their efforts in this area. A bibliometric study of articles as indexed in the Web of Science considered the development in this field with respect to the growth in literature, collaboration profile and the research areas that are more within the country's context. We also looked at public institutions that are more active in this arena, including government policy considerations as guided by the National Nanotechnology Strategy launched in 2005. We found that the number of nanotechnology publications have shown a remarkable growth ever since the launch of the strategy. Articles on nanotechnology have been published in numerous journals, with Electrochimica Acta publishing the most, followed by Journal of Nanoscience and Nanotechnology. These publications fall within the traditional domains of chemistry and physics. In terms of the institutional profile and based on publication outputs over the period reviewed, the Council for Scientific and Industrial Research is a leading producer of publications in nanotechnology, followed by the University of the Witwatersrand - institutions that are both based in the Gauteng Province. There is a high level of international collaboration with different countries within this field - the most productive collaboration is with India, followed by the USA and China, as measured through co-authorship.
SIGNIFICANCE:
•Nanotechnology as a field of research is experiencing rapid growth and there is a need to understand progress from a South African perspective.
Keywords: nanotechnology; R&D policy; bibliometric methods; collaboration
Introduction
Innovations linked to science and technology developments are believed to be promising contributors to economic progress internationally. In response to this promise, South Africa adopted the National Research and Development Strategy1 in 2002 to enable the transition from a resource-based economy to a knowledge economy, which was followed by the Ten-Year Innovation Plan towards a knowledge-based economy2. This strategy was viewed as pivotal to the achievement of national goals, including enhanced economic growth, industrial competitiveness, as well as social and developmental aspirations.3 To this end, a number of targeted interventions and investments were made in specific fields of science, one of which was nanotechnology. Nanoscience and nanotechnology (N&N) is now widely recognised as an area of science and technology that promises to bring many scientific breakthroughs in the coming years, which will have a meaningful impact on the economy. According to Lux Research4, the revenue from nano-enabled products worldwide as of 2014 stood at USD1.6 trillion - a growth of 90% in 2 years from USD850 billion in 2012. The application of nanomaterials occurs in many industries such as cosmetics, construction and electronics. It is important to note, as Reiss and Thielmann5 have pointed out, that nanotechnology does not constitute a product specifically, but is in most cases integrated in a large variety of different applications in a large number of industrial sectors. Nanotechnology can therefore be understood as an enabler of innovative technologies and applications by substituting and improving existing products or leading to fundamentally new products.5 As a result, various governments have been investing in the development of nanotechnology in their respective countries.
The Organisation for Economic Co-operation and Development (OECD) defines nanotechnology as a set of technologies that enable the manipulation, study or exploitation of structures and systems of typically less than 100 nanometres in size. It is believed that developments in N&N have the potential to affect virtually every area of economic activity and aspect of daily life.6 This wide-ranging effect is because of the technology's ability to contribute to the development of novel materials, devices and products. The number of products, and the diversity of nanomaterials and nanosystems, is predicted to increase rapidly in the coming decade as a result of continuous innovation in many sectors. Nanotechnology can be applied in many commercial products in areas such as health (especially drug-delivery), energy, food packaging and water purification systems. It is evident that no work has been done to evaluate the development in this field since the N&N strategy was introduced in South Africa. The aim of this study was to establish publication and citation trends in the area of nanoscience. Secondly, we aimed to assess collaboration and the most productive countries and institutions publishing in the area of nanoscience; and, finally, we aimed to determine the intellectual structure of the nanotechnology research in terms of subject area. South Africa's investment in N&N research, and in other areas, is seen as a means to moving towards the creation of a knowledge-based economy, and as such, the country's progress in this regard. In terms of terminology, nanoscience and nanotechnology are used interchangeably throughout the article, as is the practice in this research community.
Background
Nanotechnology in South Africa and other developing countries
Based on the potential economic benefits and developments internationally, the South African government made some policy interventions to stimulate the development of nanotechnology, after the establishment of the National Nanotechnology Strategy7 together with the stakeholder community under an organisation called the South African Nanotechnology Initiative (SANi). The goals of the strategy were to 'support long-term research that will lead to the fundamental understanding of nanomaterials' and a more ambitious target of supporting the 'creation of new and novel devices for application in various areas such as health, water and energy'. To support these objectives, the government committed to several investments, including inter alia:
• Establishing Nanotechnology Innovation Centres with a mandate to build capacity to develop commercial nano-enabled products. Two of these centres have been established: one is based at Mintek and the other at the Council for Scientific and Industrial Research (CSIR), both of which are situated in the Gauteng Province.
• Providing ring-fenced grants to researchers through the National Research Foundation for purchase of nanotechnology-related research equipment under the National Equipment Programme funding instrument.
• Initiating and funding the establishment of a taught master's degree programme in N&N which is currently offered by four universities: the University of the Western Cape, Nelson Mandela University, the University of Johannesburg and the University of the Free State.
These initiatives and other investments need to be contextualised as South Africa entered the N&N field later than developed economies. Government support through policy intervention and funding in this field is acknowledged.8 Although the investments were well considered, they may not be sufficient to allow South Africa to play a leadership role in this research area. Research done by Pouris9 indicated that the number of articles in the field produced in South Africa had increased from just 12 in 2000 to 57 by 2005, with the University of the Witwatersrand being a leading producer. Pouris9 further highlighted the absence of science councils in the top producing category at the time, with N&N research being largely driven by individual academics rather than by a coordinated national approach. Pouris9 also showed that the USA was a top collaborating country with South Africa. It is further noted that the number of N&N core journals currently indexed by the Science Citation Index is now at 83 - a number that has been increasing steadily since the area started gaining recognition in the 1990s.
Looking broadly at the participation of African researchers in nanotechnology, it has been noted that participation is very low and fragmented. Generally, the growth in nanotechnology in the least developed countries, including those in Africa, has been very slow; while individuals have shown interest in this field, there is no practical plan for the advancement of this field and as a result nanotechnology remains an area of academic research.10 Ezema et al.10 further point out that the BRICS nations produced a substantial number of publications, but that outside this grouping, there was very little activity in developing countries, especially in Africa, partly because of a lack of research infrastructure and facilities to carry out N&N research and thus these nations are classified as nanotechnology dormant. Maclurcan11 noted that there are niche areas within N&N that are of benefit to developing countries such as India and South Africa, which - because of their high prevalence of tuberculosis (TB) infections - have programmes for developing nanotechnology-enabled TB diagnostic kits and improved TB drug-delivery systems. These specific circumstances provide a clear niche area for these countries to establish competitive expertise.
Bibliometrics
Bibliometric approaches are increasingly used for the assessment of scientific disciplines and provide useful information for those who fund research. It has been established that increased investment should lead to an increase in the number of publications; this investment also is more positive if it is made from the public sector rather than from the private sector.12 Bibliometrics is defined as the application of mathematics and statistical methods to communication media. Bibliometrics have been used extensively to evaluate research progress quantitatively, for example in studying research output for specific countries13-15 in a continent or a region such as Africa or southern Africa16,17 or sometimes for a research discipline such as nanotechnology9,18 or even a single institution19. One problem identified in bibliometric research is the classification and delineation of fields, for example, for new and emerging areas like biotechnology and nanotechnology the definitions differ among different application areas, including which areas it encompasses. Leydesdorff20 further states that delineation using core journals as done by Clarivate Analytics' (formerly Thomson Reuters) Web of Knowledge classification may not account for research published in multidisciplinary journals. In areas such as these, delineation is achieved by using keywords to extract the relevant publications from the database, as in this case; another approach is content analysis or using only core journals or a combination thereof. In a multidisciplinary area like N&N in which literature is scattered, delineation is more important and only keywords are able to extract the relevant publications as there are relatively few established core journals and the literature tends to be published in traditional journals such as those in the fields of chemistry and physics.
In this study, bibliometrics analysis was performed on the data obtained from a citation index database. A citation index is defined as an ordered list of cited articles, each of which is accompanied by a list of citing articles.21 There are many academic citation indexes used in bibliometrics research such as CiteSeer, Google Scholar and Elsevier's Scopus depending on the context of the study, but the most commonly used is Clarivate Analytics' (formerly Thomson Reuters) Web of ScienceTM (WoS).
Methodology
Data were extracted from articles in nanoscience and nanotechnology published over an 11-year period starting in 2005. The year 2005 was chosen because it coincides with the launch of the N&N strategy in South Africa. It would not have added value to go back further than 2005 as the study mentioned earlier9 covers the period up to 2005. The Science Citation Index offered by WoS was used for the search of journal publications.22 A major strength of this database is that it provides sufficient coverage of the most important and influential journals and core literature internationally. For the calculation of activity index and percentage share, the total number of publications was obtained using InCitesTM - an analytical tool provided by Clarivate Analytics which uses the same underlying WoS data.
A keyword-based search is the preferred route for a relatively new and multidisciplinary field like N&N, as there are a high number of relevant publications that can be hidden in multidisciplinary journals. Based on this preference, the WoS core collection database was used, which allows for a keyword-based search. There are many possible search strategies, from the simple use of the nano* wildcard to the more elaborate approach of a modular search strategy as described by Porter et al.23 A simplified methodology by Maghreb et al.24 that recognises that not all words that start with 'nano' refer to nanomaterials and that there are some nanomaterials that do not have keywords containing the nano- prefix (such as quantum dots and fullerenes) was used. This methodology was used because of its simplicity and very accurate selection of nanotechnology articles. The following keywords were used: nano* NOT nano2 NOT nano3 NOT nanog* NOT nanosecond* NOT nanomol* NOT nanogram* NOT nanoplankton* OR "atom* scale" OR "atomic layer deposition*" OR "giant magnetoresist*" OR graphen* OR dendrimer* OR fulleren* OR "c-60" OR "langmuir blodgett*" OR mesopor* OR "molecul* assembl*" OR "molecul* wire*" OR "porous silicon*" OR "quantum dot*" OR "quantum well*" OR "quantum comput*" OR "quantum wire*" OR qubit* OR "self assembl*" or supramolecul* OR supermolecul* OR "ultrathin film*" OR "ultra thin film*". In this case, a top down keyword search and Boolean operators were used. This approach enabled extraction of all articles containing keywords known to be used in nanotechnology publication. The operators OR and NOT were used to exclude those articles that may include the nano- prefix but are not related to nanotechnology. Only research articles were included; other publication types such as book chapters and proceedings were not included.
In this article, a descriptive approach is used to identify the trends based on the publication data. The analysis focuses on countries with which South Africa collaborates the most on research, the most prolific research institutions in N&N research, the top journals selected by South African researchers as well as the subject categories, as N&N is interdisciplinary.
Results and discussion
The aim of this study was to investigate the productivity and intellectual structure of N&N in South Africa since the launch of the country's N&N strategy. The results of the bibliometric study obtained from the analysis of the 2928 records extracted from the WoS indexing database and published in the 11-year period between 2005 and 2015 are presented.
The first part considers the publication and citation trend; the second part, the collaboration and the most productive countries and institutions; and, finally, the intellectual structure of the nanotechnology research is considered. A search of patents using the same keywords as used for the publication search revealed that South Africa has been granted fewer than 10 nanotechnology patents by the USPTO over this period; as a result of this small number, patents did not form part of the study. The number of patents was confirmed using the OECD database25 and, based on the available data, further analysis was abandoned as it would not have added further insight to this study.
The nanotechnology publication trend in South Africa
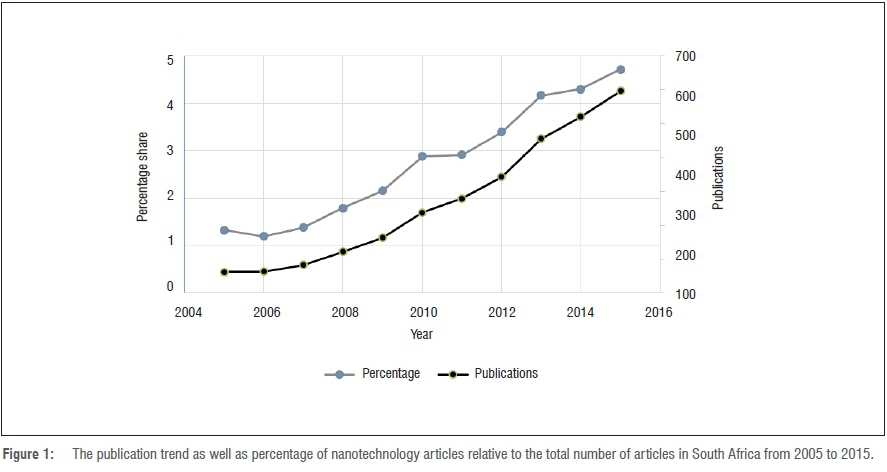
Figure 1 shows the publication trend of nanotechnology articles in South Africa between 2005 and 2015. Figure 1 shows an increasing trend from 2005 when only 62 publications were produced to a total of 597 in 2015 - an average annual growth rate of 22%. The number of publications in N&N have grown substantially, but to put this growth in context, the total publication number in South Africa grew from 6408 in 2005 to 15 468 in 2015 - equating to an average annual growth rate of 14%. Therefore, N&N publications grew at a faster rate than the growth of all publications in South Africa, which equates to an average annual growth rate of 0.36%. Regardless, this growth in N&N outputs is almost tenfold.
To ascertain the significance of the growth in nanotechnology articles, the percentage of nanotechnology articles to overall articles from the country during the period was calculated. It is clear from Figure 1 that this percentage grew from less than 1.5% in 2005 to just above 4.5% in 2015 - a threefold increase and much higher than the overall growth of articles generally. This growth is also distinct from that of energy publications, for example, which, according to a recent study, has remained stagnant since 2008.26
The citation trend of nanotechnology publications in South Africa
Figure 2 shows the citation trend of nanotechnology articles in South Africa from 2005 to 2015. An observation of the citations of the articles reveals an even more impressive picture than that of publication growth (Figure 2). The citations have grown from 18 citations in 2005 to 7229 in 2015 - an average annual growth rate of 72%, which is quite impressive considering that the overall growth in citations in the country was quite low. Citations for South African publications overall have not grown much, with a growth of 1.81% between 2005 and 2010 compared with 251% for N&N over the same period. The nanotechnology articles generated by South African researchers have relatively high visibility.
To determine the significance of the growth in citations in nanotechnology articles, we calculated the share of citations to N&N articles as a percentage of citations to all articles produced in South Africa. As seen from the secondary axis in Figure 2, this share grew from just 0.04% in 2005 to above 1.6% in 2015. The growth in citations to nanotechnology articles was far higher than the growth of total citations to all South African publications over the same time.
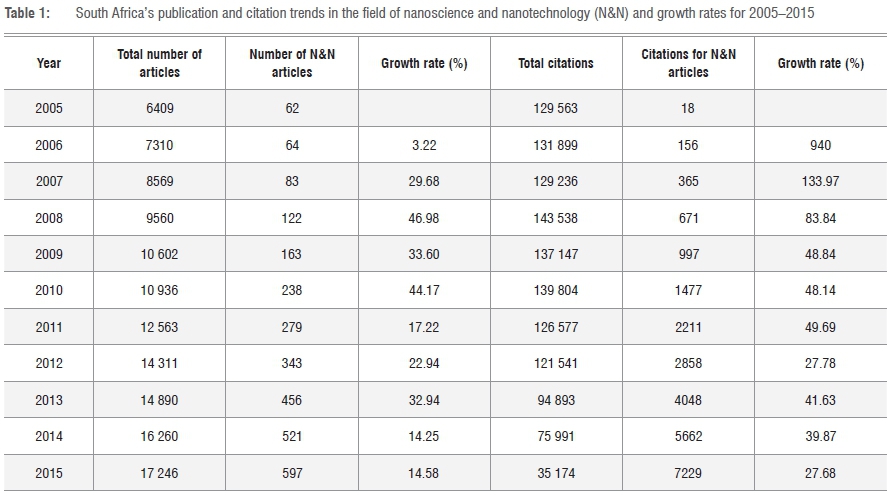
Table 1 shows the publication and citation trends of nanotechnology articles in South Africa from 2005 to 2015. Citations represent the impact and the influence of articles, so this high citation trend indicates that the nanotechnology articles generated by South African researchers have a high impact.
South African output in N&N during the period 2005-2015 included 2928 publications. With respect to publication output, the nanotechnology area grew at an average annual growth rate of 25.95% and the citation growth was much higher at an average annual growth rate of 144%. This growth is in line with the international growth in N&N which has been reported27 to be at 23% and quite significantly higher than the average annual growth rate of publications in South Africa in general, which is 14%. The growth rate of N&N articles was 3.2% in 2006, and accelerated sharply to almost 30% in 2007, and up to 46% in 2008. This area of research has been growing at a fast pace and finally stabilised at about 14% in 2014/2015. It will be interesting to observe how the growth evolves in the next few years or whether 14% is the 'new normal', as it is in line with the growth of South African publications in general. The citations to N&N articles grew from a small base of only 18 citations in 2005 to 156 citations in 2006 - a 940% increase. This growth decelerated and finally settled at about 48% in 2009-2011. Citations saw a growth of 27% in 2015 - not as high as in earlier years. The growth of nanotechnology - both in terms of articles published and the citations they have received - is phenomenal and indicates that researchers are spending resources in this field of research and that the government support initiatives are successfully stimulating interest in this area.
Table 2 shows the publication trend of nanotechnology articles in other selected countries for comparison purposes from 2005 to 2015. The ratio of N&N articles produced to total articles in all areas is a useful means of comparison, as is the activity index. The totals were obtained using InCitesTM.
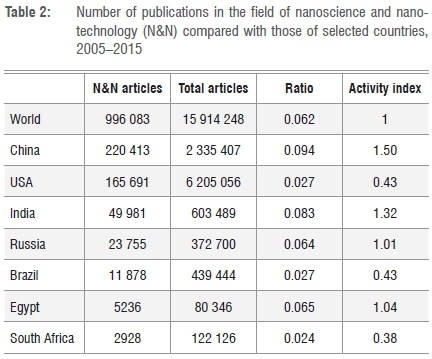
Table 2 shows that South Africa, compared with the other BRICS countries, Egypt and the USA, had the least number of N&N articles, with only 2.4% of publications being in the nanoscience field. South Africa's world share of N&N articles over this period was 0.29% - far below South Africa's world share of total articles of 0.79%. This finding may indicate that N&N research output has most likely not reached its full potential in South Africa. N&N is a high growth research area internationally, and the growth in the number of South African publications is not keeping up with the growth in the overall growth of the field worldwide. Egypt produced 5236 publications over the same period - placing this country in a leading position in N&N on the African continent. Chen et al.28 found that Russia, India and China showed rapid growth in N&N publications from 2000 to 2007 of about 12.8 times in China, 8 times in India and 1.6 times in Russia. What is apparent is that N&N is growing very rapidly while the growth in South Africa has been recorded to be below that of other countries. Appelbaum et al.29 confirm the importance of nanotechnology in China with a number of state-led interventions; the Chinese government is also investing an estimated USD200 million per year in this field, making it second only to the USA in terms of investment. The USA launched its Nanotechnology Initiative in 2000, with an annual budget for 2016 estimated at just over USD1.4 billion, while the Chinese government followed a year later with its own initiative in 2001; in both of these countries, the N&N initiatives were accompanied by big dedicated budgets.30 South Africa only launched a similar initiative in 2005 with what can be described as a very modest budget. It is interesting that China, India, Russia and Egypt show figures above 1, which is an indication that these countries have placed more emphasis in N&N. Despite a higher budget, the USA - along with South Africa and Brazil - have activity indices of less than 1, showing no specialisation in this field. Besides looking at the number of publications, another indicator for the comparison with other countries is the activity index, which was first described by Frame31. The index indicates the country's share in world publications in a particular field of science relative to the overall share in world total publications. This index has been used quite recently in other studies such as the one by Makhoba and Pouris32 in which different scientific priority areas in South Africa were compared. The activity index is zero when the country holds no publications in that discipline and it is equal to 1 if the country's share in the discipline equals the country's share in all fields indicating no specialisation and above 1 when a positive specialisation is observed.
Collaboration and publication profiling of South Africa
Collaboration with researchers from other countries was examined for the nanotechnology field as indicated by co-authorship of research papers. The top 20 countries based on the co-authored articles are given in Figure 3.
Figure 3 indicates that collaboration in the nanoscience and nanotechnology research area is the highest with India, followed by the USA and China. In terms of numbers, South Africa collaborated on publications during the 11 years with India (266 publications), the USA (190 joint publications), China (127 publications), Germany (123 publications) and England (112 publications). The aggregate share of collaboration with these top five collaborating countries (818 publications) is actually 28% of the total number of all publications. The USA is a global leader in the nanotechnology field, and consequently is a key country with which to collaborate. The presence of India as the top collaborating partner may come as a surprise to some, but South Africa has strong historical ties with India which pre-dates their involvement in the BRICS grouping. In a study of the BRICS countries, Finardi33 found that South Africa and India have the strongest collaborations compared with other countries in the BRICS grouping. This high collaboration was attributed to both countries belonging to the Commonwealth, both once being part of the British Empire and both having English as one of their official languages.
Collaboration results are not expected to add up to 100% because most of the articles are authored exclusively by South Africans with no external collaborator. It is important to note that South Africa has fewer collaborations within the continent, with only nine collaborating countries in Africa. Collaboration with other African countries produced a total of 130 publications - accounting for only 5.57% in this field in South Africa. Collaboration in this area with Nigeria - which is South Africa's biggest collaborator in Africa - produced only 58 articles which is low compared with India, for example. This result is hardly surprising as it has been established in past studies that African researchers prefer to collaborate with researchers outside of the continent. Pouris and Ho17 found that South African researchers have been increasingly publishing with international partners, with a growth of 66% in the 5 years between 2007 and 2011, making up a total of 54% of all articles produced in the country. This growth is on the back of the findings by Boshoff34 that collaboration with neighbouring countries in the Southern African Development Community remained stagnant at 3% for the 3 years between 2005 and 2008.
Nanotechnology journals used by South African researchers
Table 3 highlights the top 24 journals in which N&N publications by South African researchers between 2005 and 2015 are to be found. Included is the journal impact factor as published in the Journal Citation Reports of Clarivate Analytics (formerly Thomson Reuters) for the year 2015. South African authors published most in the journal Electrochimica Acta (62 articles) followed by the Journal of Nanoscience and Nanotechnology (61 articles) and lastly the International Journal of Electrochemical Science (54 articles). The top 24 journals have a significant 27% (803) share of the total publications, indicating a wide scatter of literature in nanotechnology with no clear concentration of articles in one group of journals. In this list, the low representation of South African journals is observed, indicating a preference for international journals, with only the South African Journal of Science represented in the top 24. The most used language in the top 24 journals is English, with the rest of the journals being bilingual.
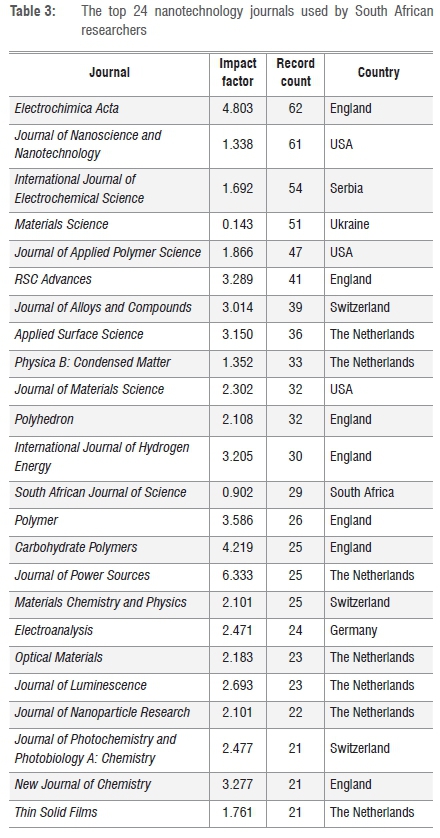
The top 24 journals are mostly from England and the Netherlands, with each of these countries having seven journals on the top 24 list. The USA - with which South African researchers collaborate the most - has only three journals on the top 24 journals list. Therefore, it is clear that South African researchers are leveraging international resources to catch up in nanotechnology research. Additionally, they attempt to increase the visibility of their research by publishing most of their articles in journals from European countries whilst still collaborating with the USA. In terms of impact factor, the journals range from Materials Science from the Ukraine with the lowest impact factor of 0.143 to the Journal of Power Sources from the Netherlands with the highest impact factor of 6.333. The average impact factor for the journals listed in Table 3 is 2.60, as published in the 2015 Journal Citation Reports.
Subject area structure
An analysis of N&N publications and their subject categories was done to understand the subject area structure (Table 4).
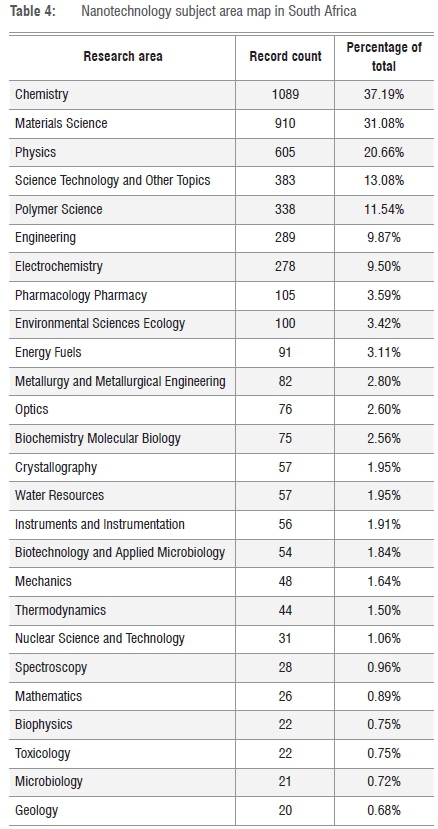
The highest number of publications in N&N by South African researchers fall into the three traditional domains: Chemistry, Physics and Materials Science. The top three subject areas account for 88.9% of the country's publications in the field of nanoscience and nanotechnology. It is clear therefore that most of the nanotechnology applications are in Physics, Chemistry and Materials Science. The priority application areas that are emphasised in the South African N&N strategy - such as water, health and energy - seem well presented, although not to the extent envisaged in the strategy. It is also interesting that there is a broad spread in terms of the application of N&N including in areas such as Mechanics, Optics and Geology. The results are not expected to add up to 100% as the articles can belong to more than one research domain and only the top 26 fields are reported.
Publishing organisations
Analysis of the most prolific institutions indicates a dominant contribution of institutions based in the Gauteng Province, with three of the top five institutions based in this province (Table 5). It is unclear whether this was a deliberate policy objective or a coincidence; the N&N strategy is silent on this issue. The CSIR accounted for 16.4% of publications in the N&N area, followed by the University of the Witwatersrand at 14.2%. Government, through the Department of Science and Technology, established and funded the Nanotechnology Innovation Centre, which is sometimes referred to as the National Centre for Nano-Structured Materials based at the CSIR, which explains the CSIR's leadership role in this field. The centre at the CSIR called the National Centre for Nano-Structured Materials is one of two nanotechnology centres established by the government in 2007. Its focus is on the development of new nanotechnology-enabled materials, with applications in the manufacturing, water and health sectors. The National Centre for Nano-Structured Materials as a government-funded institute makes available high-tech instrumentation to other researchers in South Africa. The other national centre is based at Mintek and focuses on the fields of sensors, biolabels and water nanotechnology. Interestingly, the National Research Foundation also features strongly in the third position with most of the output attributed to the national facilities, notably iThemba Labs.
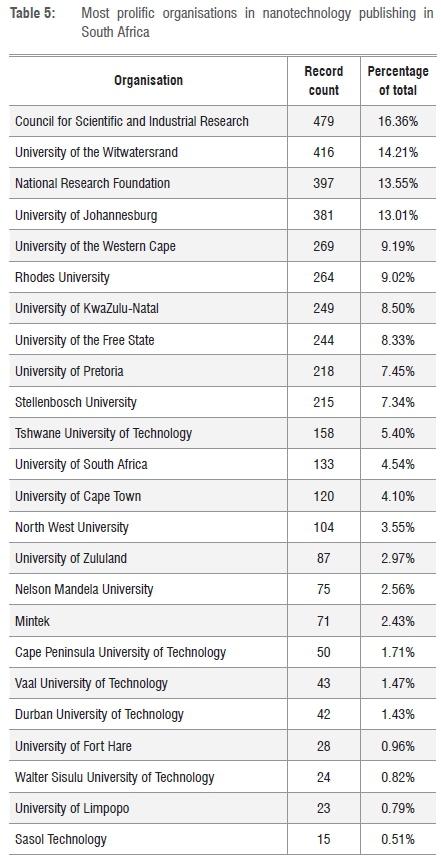
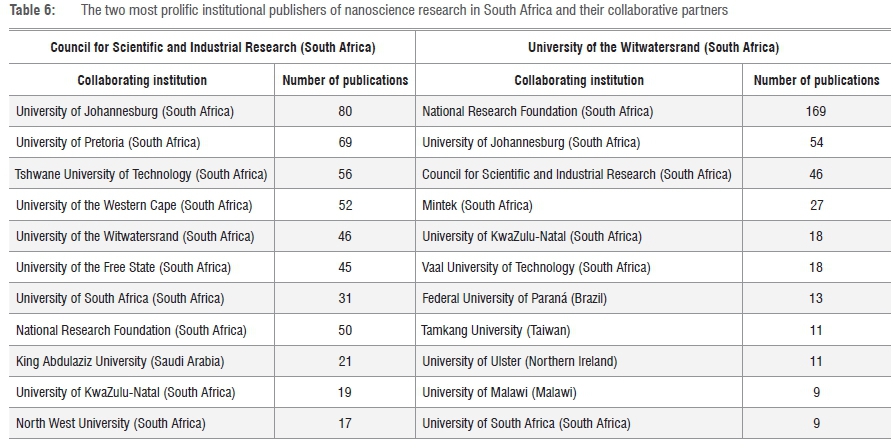
In terms of inter-institutional collaboration, the most prolific institutions in N&N research in South Africa collaborate with each other extensively, as indicated by the number of co-authored articles. The CSIR, with a total of 479 publications, collaborated with the University of Johannesburg (80), University of Pretoria (69) and Tshwane University of Technology (56) nationally, and the King Abdulaziz University in Saudi Arabia (21) and the University of Malawi (11), internationally. The first three institutions - like CSIR - are in Gauteng, with close proximity facilitating collaboration. The CSIR is also a national facility which provides access to analytical equipment to researchers countrywide, and therefore the high number of papers co-authored with researchers from other South African institutes is not surprising. The University of the Witwatersrand, with a total of 420 publications, collaborated with the National Research Foundation (169), University of Johannesburg (54) and CSIR (46) nationally, and, internationally, with the Federal University of Paraná in Brazil (18), Tamkang University in Taiwan (11), University of Ulster in Northern Ireland (11) and the University of Malawi in Malawi (9). Clearly an argument can be advanced that institutions from Gauteng - South Africa's economic hub - are leading N&N research and it appears that there is a close level of collaboration between them. It would seem that, despite its relatively small scientific size, Malawi (through the University of Malawi) has a very close relationship with the two top South African institutes in N&N research.
Tables 5 and 6 show an obvious lack of representation from the private sector, with only Sasol Technology publishing in this field. This finding does not augur well for the future commercialisation of nanotechnology-enabled products in the country as envisaged in the N&N strategy. Perhaps this result could be explained in that the private sector may prefer the patenting route or retaining trade secrets rather than disseminating their research findings through publications.
Conclusion
As a result of the growing technological significance and expected economic contribution, N&N in South Africa has been thoroughly analysed through bibliometric methods. The research output in this field is showing a steady increase in South Africa since the introduction of the National Nanotechnology Strategy in 2005 and its associated government support. However, to put this increase into context, there is a need to look at some other countries during the same period, such as Egypt which produced almost double the number of publications to that of South Africa. Looking at the other BRICS countries, China produced 220 413, India 49 981, Russia 23 755 and Brazil 11 878 articles over this period. The USA produced a total of 165 691 articles during this period, in line with their big budget for N&N which was projected to reach USD1.5 billion in 2016.
This discrepancy may be partly because of South Africa's low budget for R&D in general but also lack of prioritisation of N&N in the country. This lack of prioritisation is evident when one looks at the low activity index, with Egypt taking a leading position in this field on the African continent. So, in conclusion, the policy has institutionalised N&N research within science councils and universities, as opposed to what was the case before the introduction of the strategy. However, South Africa has the potential to produce more output in the N&N field, based on the comparison of output from other science areas. In a comparison of OECD countries, it was found that in 2014 the gross expenditure of R&D as a percentage of GDP was 0.73% for South Africa, whereas the average for OECD countries is 2.38%; interestingly, for China, this value stood at 1.93% for 2014.6 Therefore, there is a clear underinvestment in research and development in South Africa in general, not only in N&N research. The CSIR emerges as the most productive institute in N&N research, which can be attributed largely to the direct and continuous government investment in this organisation by, for example, establishing the National Centre for Nano-Structured Materials. However, innovative outputs, such as new nano-enabled products, as envisaged in the N&N strategy, will be difficult to achieve with a low level of research and collaboration in this field by the private sector. The introduction of R&D tax incentives in South Africa is a means to encourage an increased participation of the private sector in research and development. The lack of private sector involvement can in part be attributed to the early stage of nanotechnology development in South Africa with most research efforts geared to generating knowledge in the field. The more likely reason is the generally weak domestic corporate R&D expenditure, as currently the country's gross expenditure of R&D as a percentage of GDP of 0.73% is made up of only a small fraction from the corporate sector, as measured in 2014. In South Africa, the business expenditure of R&D as a percentage of GDP stands at 0.32% and this is against the OECD average of 1.58%, whereas that of China is 1.47%, showing that the country is lagging behind. Future work will need to look at a quantitative comparison of this output with other developing countries and possibly provide an analytical perspective of low patenting trends in this field.
Acknowledgement
We thank Sello Mutle for editing an earlier version of this manuscript.
Authors' contributions
X.M. undertook all the research and A.P. provided academic guidance.
References
1. South African Department of Science and Technology. South Africa's national research and development strategy. c2002 [cited 2016 Dec 09]. [ Links ] Available from: http://www.dst.gov.za/images/pdfs/Nationalresearch development strategy 2002.pdf
2. South African Department of Science and Technology. Innovation towards a knowledge-based economy: Ten-year plan for South Africa 2008-2018 [document on the Internet]. [ Links ] c2007 [cited 2016 Dec 09]. Available from http://www.dst.gov.za/images/pdfs/The%20Ten-Year%20Plan%20for%20Science%20and%20Technology.pdf
3. Kaplan D. South Africa's national research and development strategy: A review. Sci Tech Soc. 2004;9(2):273-294. https://doi.org/10.1177/097172180400900204 [ Links ]
4. Lux Research. Nanotechnology update: U.S. leads in government spending amidst increased spending across Asia. Boston, MA: Lux Research Inc.; 2015. [ Links ]
5. Reiss T, Thielmann A. Nanotechnology research in Russia: An analysis of scientific publications and patent applications. Nanotechnol Law Bus. 2010;7(4):387-404. [ Links ]
6. Organisation for Economic Co-operation and Development (OECD). OECD Nanotechnology in the context of technology convergence. c2014 [cited 2016 Dec 09]. [ Links ] Available from: http://www.oecd.org/officialdocuments/publicdisplaydocumentpdf/?cote=dsti/stp/nano(2013)10/final&doclanguage=en
7. South African Department of Science and Technology. National nanoscience and nanotechnology strategy. c2006 [cited 2016 Dec 09]. [ Links ] Available from: http://www.dst.gov.za/images/pdfs/Nanotech.pdf
8. Claassens CH, Motuku M. Nanoscience and nanotechnology research and development in South Africa. Nanotechnol Law Bus. 2006;3:217. [ Links ]
9. Pouris A. Nanoscale research in South Africa: A mapping exercise based on scientometrics. Scientometrics. 2007;70(3):541-553. https://doi.org/10.1007/s11192-007-0301-7 [ Links ]
10. Ezema IC, Ogbobe PO, Omah AD. Initiatives and strategies for development of nanotechnology in nations: A lesson for Africa and other least developed countries. Nanoscale Res Lett. 2014;9(1), Art. #133, 8 pages. https://doi.org/10.1186/1556-276x-9-133 [ Links ]
11. Maclurcan DC. Nanotechnology and developing countries: Part 2: What realities? Journal of Materials Online. 2005;1, 29 pages. http://dx.doi.org/10.2240/azojono0104 [ Links ]
12. Shelton RD. Relations between national research investment and publication output: Application to an American paradox. Scientometrics. 2008;74(2):191-205. https://doi.org/10.1007/s11192-008-0212-2 [ Links ]
13. Darvish H, Tonta Y. Diffusion of nanotechnology knowledge in Turkey and its network structure. Scientometrics. 2016;107(2):569-592. https://doi.org/10.1007/s11192-016-1854-0 [ Links ]
14. Sooryamoorthy R. Science and scientific collaboration in South Africa: Apartheid and after. Scientometrics. 2010;84:373-390. https://doi.org/10.1007/s11192-009-0106-y [ Links ]
15. Kahn M. A bibliometric analysis of South Africa's scientific outputs - some trends and implications. S Afr J Sci. 2011;107(1/2), Art. #406, 6 pages. https://doi.org/10.4102/sajs.v107i1/2.406 [ Links ]
16. Confraria H, Godinho MM. The impact of African science: A bibliometric analysis. Scientometrics. 2015;102(2):1241-1268. https://doi.org/10.1007/s11192-014-1463-8 [ Links ]
17. Pouris A, Ho Y-S. Research emphasis and collaboration in Africa. Scientometrics. 2013;98(3):2169-2184. https://doi.org/10.1007/s11192-013-1156-8 [ Links ]
18. Lavrik OL, Busygina TV, Shaburova NN, Zibareva IV. Nanoscience and nanotechnology in the Siberian Branch of the Russian Academy of Sciences: Bibliometric analysis and evaluation. J Nanopart Res. 2015;17(2), Art. #90, 11 pages. https://doi.org/10.1007/s11051-015-2900-1 [ Links ]
19. Chiware E, Skelly L. Publishing patterns at the Cape Peninsula University of Technology. S Afr J Sci. 2016;112(1/2), Art. #2014-0220, 6 pages. https://doi.org/10.17159/sajs.2016/20140220 [ Links ]
20. Leydesdorff L. The delineation of nanoscience and nanotechnology in terms of journals and patents: A most recent update. Scientometrics. 2008;76(1):159-167. https://doi.org/10.1007/s11192-007-1889-3 [ Links ]
21. Garfield E. Science Citation Index: A new dimension in indexing. Science. 1964;144(3619):649-654. https://doi.org/10.1126/science.144.3619.649 [ Links ]
22. Thomson Reuters. Web of ScienceTM report [created 2016 Feb 10]. [ Links ]
23. Porter AL, Youtie J, Shapira P. Refining search terms for nanotechnology. J Nanopart Res. 2008;10(5):715-728. https://doi.org/10.1007/s11051-007-9266-y [ Links ]
24. Organisation for Economic Co-operation and Development (OECD). Science technology and patents [homepage on the Internet]. c2016 [cited 2016 Dec 09]. [ Links ] Available from: http://stats.oecd.org/
25. Maghreb M, Abbasi A, Amiri S, Monsefi R, Harati A. A collective and abridged lexical query for delineation of nanotechnology publications. Scientometrics. 2011;86:15-25. https://doi.org/10.1007/s11192-010-0304-7 [ Links ]
26. Pouris A. A bibliometric assessment of energy research in South Africa. S Afr J Sci. 2016;112(11/12), Art. #2016-0054, 8 pages. http://dx.doi.org/10.17159/sajs.2016/20160054 [ Links ]
27. Roco MC. The long view of nanotechnology development: The National Nanotechnology Initiative at 10 years. J Nanopart Res. 2011;13(2):427-445. https://doi.org/10.1007/s11051-010-0192-z [ Links ]
28. Chen H, Dang Y, Larson C, Roco MC, Wang X. Trends for nanotechnology development in China, Russia, and India. J Nanopart Res. 2009;11:1845-1866. https://doi.org/10.1007/s11051-009-9698-7 [ Links ]
29. Appelbaum R, Parker R, Cao C. Developmental state and innovation: Nanotechnology in China. Glob Netw. 2011;11(3):298-314. https://doi.org/10.1111/j.1471-0374.2011.00327.x [ Links ]
30. Sargent JF. The National Nanotechnology Initiative: Overview, reauthorisation and appropriations issues [document on the Internet]. c2014 [cited 2016 Dec 09]. [ Links ] Available from: https://fas.org/sgp/crs/misc/RL34511.pdf
31. Frame DJ. Mainstream research in Latin America and the Caribbean. Interciencia. 1977;2:143-147. [ Links ]
32. Makhoba X, Pouris A. Scientometric assessment of selected R&D priority areas in South Africa: A comparison with other BRICS countries. Afr J Sci Technol Innov Develop. 2016;8(2):187-196. http://dx.doi.org/10.1080/20421338.2016.1147205 [ Links ]
33. Finardi U. Scientific collaboration between BRICS countries. Scientometrics. 2015;102(2):1139-1166. https://doi.org/10.1007/s11192-014-1490-5 [ Links ]
34. Boshoff N. South-South research collaboration of countries in the Southern African Development Community (SADC). Scientometrics. 2009;84(2):481-503. https://doi.org/10.1007/s11192-009-0120-0 [ Links ]
 Correspondence:
Xolani Makhoba
Email: xolani100@gmail.com
Received: 07 Dec. 2016
Revised: 13 Mar. 2017
Accepted: 20 June 2017

