


Services on Demand
Article
 English (pdf)
 Article in xml format
 Article references
Indicators

Related links
-
 Cited by Google
 -
 Similars in Google
Share

 Permalink
South African Journal of Science
On-line version ISSN 1996-7489
Print version ISSN 0038-2353
S. Afr. j. sci. vol.113 n.9-10 Pretoria Sep./Oct. 2017
http://dx.doi.org/10.17159/sajs.2017/20160314
RESEARCH ARTICLE
Externality costs of the coal-fuel cycle: The case of Kusile Power Station
Nonophile P NkambuleI; James N. BlignautI, II
IDepartment of Economics, University of Pretoria, Pretoria, South Africa
IISouth African Environmental Observation Network, Phalaborwa, South Africa
ABSTRACT
Coal-based electricity is an integral part of daily life in South Africa and globally. However, the use of coal for electricity generation carries a heavy cost for social and ecological systems that goes far beyond the price we pay for electricity. We developed a model based on a system dynamics approach for understanding the measurable and quantifiable coal-fuel cycle burdens and externality costs, over the lifespan of a supercritical coal-fired power station that is fitted with a flue-gas desulfurisation device (i.e. Kusile Power Station). The total coal-fuel cycle externality cost on both the environment and humans over Kusile's lifespan was estimated at ZAR1 449.9 billion to ZAR3 279 billion or 91c/kWh to 205c/kWh sent out (baseline: ZAR2 172.7 billion or 136c/kWh). Accounting for the life-cycle burdens and damages of coal-derived electricity conservatively, doubles to quadruples the price of electricity, making renewable energy sources such as wind and solar attractive alternatives.
SIGNIFICANCE:
• The use of coal for electricity generation carries a heavy cost for social and ecological systems that goes far beyond the price we pay for electricity.
• The estimation of social costs is particularly important to the electric sector because of non-differentiation of electricity prices produced from a variety of sources with potentially very dissimilar environmental and human health costs.
• Because all electricity generation technologies are associated with undesirable side effects in their fuel-cycle and lifespan, comprehensive comparative analyses of life-cycle costs of all power generation technologies is indispensable to guide the development of future energy policies in South Africa.
Keywords: power plant; coal mine; plant construction; flue gas desulfurisation
Introduction
Coal is the world's largest single source of energy for electricity generation, fuelling over 40% of global electricity production.1 In South Africa, about 77% of electricity is derived from this fuel source2 and recent projections indicate that coal will continue to be the country's primary source of electricity into the distant future. However, the use of coal for energy raises several serious environmental concerns. These concerns include the disruption of large land surface areas and pollution of rivers as a result of coal mining3; air pollution, accidents and damage to roadways caused by material inputs transportation4; and the warming of the earth as a consequence of greenhouse gas (GHG) emissions from flue stacks5 (Table 1). The entire chain of coal-based electricity generation is thus associated with dire impacts.6 However, research has mainly focused on the externalities of the combustion process both internationally7,8 and locally9-13. In addition, the emphasis, even within this phase, is on human health and climate change impacts.11,13
While the importance of the externalities associated with the combustion process cannot be understated, additional externalities are associated with upstream and downstream processes.14 Previous research has therefore led to calls for the consideration of all stages in the coal-fuel chain in order to better inform public policy and private investment.6 Widening the breadth and width of the studied externalities, as well as embracing the long-term repercussions of energy technologies on environmental and social systems is indispensable in making informed choices on technology selection. This paper aims to advance the understanding of the measurable and quantifiable coal-fuel cycle burdens and costs by assessing these for the Kusile coal-fired power station over its lifespan. A coal-based power and social cost assessment model was developed following a system dynamics approach and was used, among other aims, to address the abovementioned goal.
Externality costs of the coal-fuel chain
Environmental and health impacts in the life cycle of coal have been assessed since 1982 using a range of methods.16 Two broad categories of methods that have been used by researchers to estimate the externality costs can be identified in the literature - namely, abatement cost methods and damage cost methods. The abatement cost methods use the costs of controlling or mitigating damage as a proxy for the damage caused by an externality. On the other hand, the damage cost methods estimate the actual externality burdens and assign a monetary cost to them using valuation techniques. The damage cost methods can be executed in either a top-down or a bottom-up manner. The top-down approach estimates externality costs of pollutants based on national or regional damages, while the bottom-up approach traces pollutants and other burdens from their initial source, quantifies impacts and monetises impacts using valuation techniques, such as the contingent valuation method (e.g. through directly eliciting willingness-to-pay or willingness-to-accept) or indirect valuation methods (e.g. replacement cost technique or hedonic pricing method). The bottom-up approach is the most preferred approach, but it is data intensive.17 In most developing countries, primary valuation studies linked to the environmental impacts of energy are lacking. For this reason researchers adjust monetary estimates of externalities from previous studies and transfer them to new contexts.10 The benefit transfer technique is therefore another method that has been used by researchers.
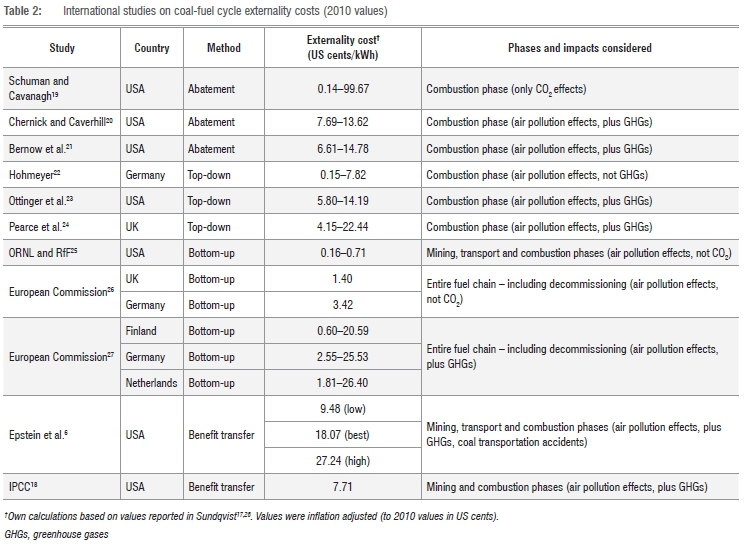
There are a number of international studies in which attempts have been made to quantify the externality costs of coal-based power generation using various valuation methods. The inflation adjusted externality costs of the reviewed studies are given in Table 2 (2010 values). Table 2 shows that several of these studies were conducted in Europe and the USA, with estimates varying with the country in question, fuel cycle stages studied and the range of impacts investigated. The abatement cost method was the earliest approach that was used by researchers. Most of these early works were focused on air emissions from fuel combustion. The researchers using the top-down damage cost approach, similar to the earlier abatement cost methods, focused on air pollution related impacts from the fuel generation stage. However, the estimates they produced varied with the country in question and the range of impacts studied, with higher estimates for studies in which GHGs were considered in addition to classic air pollutants. The bottom-up approach does not, however, allow for site-specific impacts. With the development of the bottom-up approach, new studies considered site specificity and a few made attempts to consider the entire coal cycle. Yet, the focus was still on GHGs and classic air pollutants. Lastly, the benefit transfer technique has also been used by a number of researchers through transferring and adjusting bottom-up damage cost estimates, for example by Epstein et al.6 and the International Panel on Climate Change (IPCC)18. As expected, they report damage cost estimates that are within the range of estimates reported by studies in which the bottom-up approach was employed.
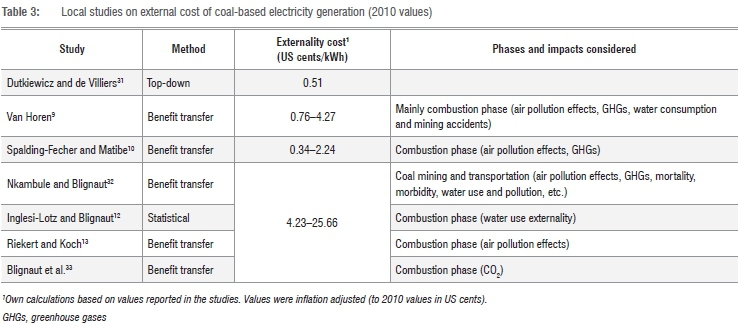
In South Africa, because of the importance of coal, there are a number of studies that estimated the externality costs linked with coal-based power generation (Table 3). Pretorius29 and Van Zyl et al.30 strictly focused on coal mining. Pretorius29 estimated the water pollution externality cost for Eskom's coal requirements at ZAR0.38/kWh while Van Zyl et al.30 estimated the impact of coal mining on the quality of water and on climate change (methane) to range from ZAR0.12/t to ZAR0.23/t and from ZAR0.98/t to ZAR6.83/t, respectively. Most of the studies shown in Table 3 focused mainly on the operation phase. Dutkiewicz and De Villiers31 used the top-down approach to value externalities while the other local studies used the bottom-up approach or benefit transfer technique. Shown in Table 3 are inflation-adjusted costs to 2010 US dollars. As with the international studies, Table 3 shows that the estimates vary with the range of impacts investigated and the fuel cycle stages studied. The estimates produced by Dutkiewicz and De Villiers31 fall in the lower range of the estimates produced by international studies using a similar approach while those produced by Van Horen9 are higher than those of Spalding-Fecher and Matibe10 as a result of a broader range of impacts under consideration. Nonetheless, both these estimates are lower than the damage cost estimates from similar studies conducted abroad, partly because they focus on a subset of the fuel cycle stages.
The rest of the studies in Table 3 are independent studies that were executed in a single project for a specific plant (Kusile), so their externality costs were summed. Nkambule and Blignaut32 focused on the externalities of mining coal and transporting it to Kusile. They focused on climate change effects, air pollution-related health effects, mortality, morbidity, water pollution, water use externality and the loss of ecosystem services. Riekert and Koch13, Inglesi-Lotz and Blignaut12, and Blignaut11 focused on the coal combustion phase in Kusile, and studied air pollution-related health effects, water consumption externality and climate change effects, respectively. The externality costs of Kusile were approximated to range between 4c/kWh and 26c/kWh - values that are comparable to those produced by similar studies conducted abroad. The outcomes of these four studies are an improvement over the earlier black-box national level studies as they focus on a specific plant and somehow disclose the links between plant performance and environmental or societal burdens. Nonetheless, the studies can also be improved upon by making the cause-effect relationships explicit (through a system dynamics model); by widening the breadth and width of the measurable externality costs within the combustion phase; through assessing indirect burdens, construction phase burdens; and flue-gas desulfurisation (FGD) system burdens; and by embracing the long-term repercussions of the coal-fuel chain on the environmental and social systems.
Research method: A system dynamics approach
The coal-based power and social cost assessment (COALPSCA) model was developed following a system dynamics approach. The model is, in essence, designed to explain the design and performance of a coal-based power plant and its interactions with resource inputs, private costs, externalities, externality costs.
The Vensim software was used to conceptualise, construct, simulate and analyse the model. The model was designed to run for a period of 50 years, in line with the lifespan of Kusile. The model consists of nine sub-models, namely power generation, generation cost, water consumption, water pollution, morbidity and fatalities, ecosystem services loss, air pollution, global pollutants and social cost.
The power generation sub-model models the production of electricity in the Kusile Power Station over its lifespan whereas the generation cost sub-model focuses on the private costs of electricity generation. The rest of the sub-models (with the exception of the social cost sub-model) focus on quantifying and monetising externalities in the coal-fuel chain, so they can be termed the 'externalities sub-models'. The social cost sub-model, on the other hand, integrates all nine sub-models through computing a number of economic and environmental indicators to evaluate coal-based power generation. As the focus of this paper is on externalities, only the externalities sub-models and the social cost submodel are presented and discussed. More discussion on the COALPSCA model is provided in Nkambule15.
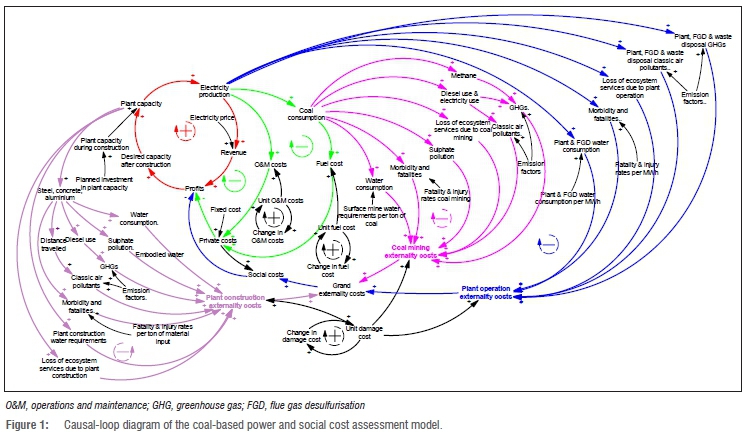
The modelling steps followed in developing the model were: problem formulation, dynamic-hypothesis formulation, model formulation, model validation, and policy design and evaluation. The dynamic hypothesis formulation step involves constructing a working theory that explains the problem. This theory explains and describes the dynamic behaviour of the system premised on the feedbacks and causal structure of the system. The causal loop diagram is a diagram that illustrates in a qualitative manner the linkages and feedback loops of the system and serves as a quick tool for capturing the hypothesis relating to the basis of dynamics. The causal loop diagram displaying the interactions between the key elements and the feedback loops of the modelled system is given in Figure 1. The interactions associated with coal-based power generation, generation cost and externality costs are qualitatively expressed in the causal loop diagram.
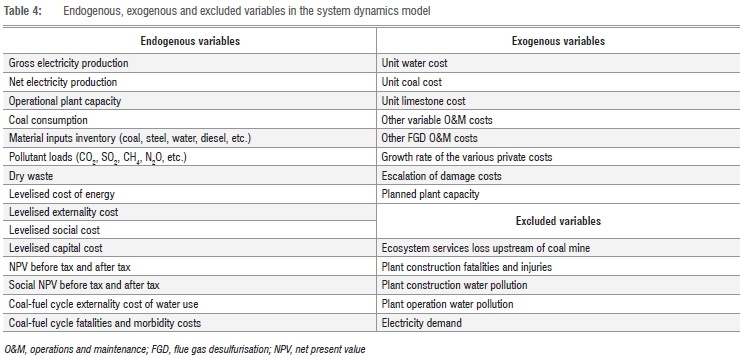
System dynamics focuses on understanding the structure of the system so as to provide insight into the behaviour of the system. Accordingly, system dynamics models should include all the important variables that influence a system's behaviour. Table 4 summarises some of the main endogenous, exogenous and excluded variables. The table indicates that many of the key variables were endogenously generated while some exogenous variables also drove the model.
The stock and flow diagrams of the modelled system were constructed and they provide the quantitative relationships between the variables of the system. The stocks or levels are denoted by rectangles and they show accumulations in the system while the flow variables (i.e. inflow and outflow rates) are denoted by valves and they regulate changes in stocks. The stock and flow diagrams of the sub-models are shown in Supplementary figures 1-7 and are explained below.
Morbidity and fatalities sub-model
The morbidity and fatalities sub-model focuses on injuries and deaths that arise in the coal-fuel cycle. Because accidents are a complicated topic in externality analysis, care needs to be taken to ensure that what is measured are the externality costs. Workers are fully compensated for the risk of accidents to which they are exposed if such cost is fully internalised through the wage rate. However, the high frequency of wage-related strikes in the mining and energy sector in South Africa indicates that workers are not happy with their wages and that their wage rate barely covers an occupational risk premium. In addition, the wage-related strikes coupled with the high level of unemployment in South Africa signify that it is highly unlikely that workers voluntarily bear the occupational risk but rather that they are forced to as they need to provide for themselves and their families.
In addition, a number of serious concerns have been raised with regard to the legislation that governs mining health compensation (i.e. the Compensation for Occupational Injuries and Diseases Act and the Occupational Diseases in Mines and Works Act), as well as poor service delivery (an insignificant proportion of certified disabled miners receive successful compensation), delays in compensation payment, and virtually no revisions of compensation figures (not even inflationary alterations).34 It is evident, therefore, that some degree of internalisation is to be expected but the absence of hard data in South Africa with which to approximate and validate the percentage of internalisation meant that we had to base the internalisation risk on the study by the European Commission.35 The initial unit morbidity and mortality values used in this study (that is, before internalisation) were based on the studies by Van Horen9, NEEDS36 and NewExt37. Morbidity and mortality values were adjusted with an average of 0% (low), 35% (central) and 50% (high) ranges of internalisation in line with the average assumed internalisation of occupational and non-occupational accidents for non-OECD countries reported in the European Commission35 study. The internalisation estimates used in the current study, therefore, imply that 50% (low), 65% (central) and 100% (high) estimates for morbidity and mortality are assumed to be externalised.
Supplementary figure 1 represents the structure of the morbidity and fatalities sub-model which consists of two stock variables: unit morbidity value and unit mortality value. Unit morbidity value (UMV, ZAR/ person) refers to the value of treating injuries suffered by occupational personnel and the general public. The values for morbidity (low, high and central estimates) were adapted from a study by Van Horen9 who valued injuries using the cost-of-illness approach in South Africa. The values were adjusted for inflation and some form of internalisation as explained above. The unit value for morbidity (UMV, ZAR/person) is determined by the change in morbidity value (AUMV, ZAR/person/year), which is in turn altered by escalation of damage cost (Dmnl/year), which is estimated at the rate of population growth. UMV is mathematically represented by Equation 1:

where UMV (25 434) is the initial value of unit morbidity.
Similarly, the unit mortality value (UMtV, ZAR/person) refers to the economic value for premature mortality. The values for mortality were adapted from the NEEDS36 and NewExt37 studies. In transferring estimates from the European Union to the South African context, the context benefit transfer with income adjustment approach was used. Overall, the unit mortality values were adjusted to reflect the disparity of income levels between the European Union and South Africa, and to cater for inflation and some form of internalisation. The unit value for mortality is determined by the change in mortality value (AUMtV, ZAR/ person/Year), which is in turn altered by escalation of damage cost. The UMtV is represented as:

The unit mortality and morbidity values play a central role in the computation of the coal-fuel cycle fatalities and morbidity costs (CCFMc, ZAR/year). CCFMC is composed of fatalities and morbidity costs streaming from three phases in the coal-fuel cycle - fatalities and morbidity costs from coal mining (FMCM, ZAR/year), from construction (FMC, ZAR/year) and from power generation (FMCPG, ZAR/year) as follows:

The fatality and morbidity costs from all three phases are determined by the deaths and injuries from these phases (which are in essence a function of fatalities and injury rates and the activities occurring in the phases) coupled with the unit mortality or morbidity values, respectively.
Water consumption sub-model
The water consumption sub-model focuses on estimating the coal-fuel cycle externality cost of water use. Estimating the opportunity cost of water use is imperative for a number of reasons. Among these reasons are that water is a scarce resource in South Africa38; and that the administered price of water does not reflect the scarcity of water and the price of water seldom reflects the full cost of water delivery12. Furthermore, Kusile sits in the Olifants River catchment - a catchment in which water is contested because of the rising water demand from various sectors. The opportunity cost to society of water use when engaging in coal-fired electricity generation was adapted from Inglesi-Lotz and Blignaut12. In estimating the opportunity cost, they estimated the shadow price of water when putting water use into coal-fired power generation and into renewable energy technologies. The opportunity cost of water values yielded was, however, adjusted downwards in the current study because the power purchased by the water when put into renewables is in essence not real as these technologies are not yet put into play at such large scales and will not be able to take up the water. The following formula was used to adjust the opportunity cost values:

where PSWis the maximum plant size in MW for solar and wind; PSK is the maximum plant size in MW of Kusile Power Station and OCiis the opportunity cost of water with i denoting a low, baseline or high opportunity cost estimate. More details on the adjustment formula can be found in Nkambule15.
The water consumption sub-model is presented in Supplementary figure 2. The sub-model has one stock variable - the unit opportunity cost of water use (UOCWU, ZAR/m3) - which plays a pivotal role in the computation of the coal-fuel cycle opportunity cost of water use. The UOCWU is determined by the change in the opportunity cost of water use (AOCW, ZAR/m3/year), which is altered by escalation of damage cost. The UOCWU is given by:

The coal-fuel cycle externality cost of water use (CCExtWU, ZAR/year) is composed of five costs - namely, the opportunity cost of water use in the New Largo colliery during coal mining (OPWCM), construction (OPWC, ZAR/year), power generation (OPWPG), FGD (OPWFGD) and disposal of Kusile's waste (OPWDW) - as follows:

The opportunity cost of water use during these five processes is in essence functions of the water requirements of the activities occurring in the processes and the unit opportunity cost of water use.
Water pollution sub-model
The water pollution sub-model centres on estimating the coal-fuel cycle water pollution damage cost. Supplementary figure 3 presents the structure of the water pollution sub-model which consists of three stocks: the unit damage cost of sulfate pollution from coal mining, steel production, and aluminium and concrete production. The unit damage costs by these industries represent the damages caused by them on other water users in the eMalahleni catchment, as estimated by Van Zyl et al.30
The unit damage cost of sulfate pollution from coal mining (UDSCM, ZAR/ton), steel production (UDSS, ZAR/ton) and aluminium and concrete production (UDSAC, ZAR/ton) is determined by changes in the damage cost of sulfate pollution from coal mining (ADSCM, ZAR/ton/year), steel production (ADSS, ZAR/ton) and aluminium and concrete production (ADSAC, ZAR/ton) which are altered by escalation of damage cost, as follows:


The coal-fuel cycle water pollution damage cost (CCWPDC, ZAR/year) is composed of two main costs, namely the damage cost of sulfate pollution from coal mining (DCSCM, ZAR/year) and that from Kusile's raw material requirements (DCSMR, ZAR/year). Water pollution damages from the plant operation phase were not considered in the modelling, because Eskom plans to operate the plant under a zero liquid effluent discharge policy. In addition, no major effluents are said to arise from limestone mining and processing39, so water pollution emanating from such activities was also not quantified. The CCWPDC is represented as:

Ecosystem services loss sub-model
This sub-model is concerned with estimating the coal-fuel cycle cost of lost ecosystem services as a result of siting and operating the power plant and coal mine. These costs are given by the forgone benefits derived from maize farming and ecosystem services generated by grasslands. Supplementary figure 4 presents the structure of this submodel which consists of two stocks - the unit maize price and unit value of ecosystem services generated by grasslands.
The unit maize price (UMP, ZAR/ton) is an input in the computation of the forgone benefits from maize cultivation. Its initial value was adapted from Blignaut et al.40 and is determined by the change in maize price (AMR ZAR/ton/year):

The unit value of ecosystem services generated by grasslands (UVEG, ZAR/ha) is an input into the computation of the forgone benefit from ecosystem services generated by grasslands. Its initial value was adapted from Blignaut et al.40 and is determined by the change in the value of ecosystem goods and services (AVEG, ZAR/ha/year) as follows:

The coal-fuel cycle cost of lost ecosystem services (CCCLES, ZAR/year) consists of ecosystem services lost as a result of coal mining (ESLCM, ZAR/year) and plant construction and operation (ESLPCO, ZAR/year) and is represented as:

The ecosystem services lost as a result of these two processes are in essence a function of the land areas lost and the unit maize price and unit value of ecosystems generated by grasslands.
Air pollution sub-model
The air pollution sub-model is concerned with estimating the coal-fuel cycle air pollution human health cost. This sub-model structure is presented in Supplementary figure 5 and consists of seven stocks representing the damage cost of the various classic air pollutants studied, namely SO2, NOX, particulate matter, nickel, lead, arsenic and chromium.
The coal-fuel cycle air pollution human health cost (CCAPC, ZAR/Year) comprises air pollution health cost from four main processes - coal transportation (CTAC, ZAR/year), plant construction (PCAC, ZAR/year), plant operation (POAC, ZAR/year) and waste disposal (WDAC, ZAR/year) - as follows:

The air pollution health costs from these four processes are in essence functions of transportation distances of coal by road/conveyor, transportation distances of raw material requirements, power production / coal consumption, and electricity use during waste disposal, respectively, coupled with the emission factors of the studied gases and metals and the unit damage cost of these gases and metals (i.e. SO2, NOx, particulate matter, arsenic, nickel, lead and chromium).
Global pollutants sub-model
The global pollutants sub-model is concerned with estimating the coal-fuel cycle global warming damage cost. It focuses mainly on three GHGs in the coal-fuel chain, namely CH4, CO2 and N2O. All the studied GHGs and their damages were expressed in their CO2-equivalence (CO2e). The structure of this sub-model is presented in Supplementary figure 6 and it contains two stocks, namely the unit damage cost of CO2 and the unit train emission damage cost. The coal-fuel cycle global warming damage cost (CCGWC, ZAR/year) is composed of global warming damages from four main processes, that is, coal mining and transportation (CMTGWD, ZAR/year), plant construction (PCGWD, ZAR/year), plant operation (POGWD, ZAR/year) and waste disposal (WDGWD, ZAR) as follows:

The damages as a result of climate change resulting from the four processes are in essence functions of the various activities occurring in the four processes coupled with emission factors of the studied gases (NO2, CH4 and CO2), global warming potentials of the gases and the unit damage cost of CO2.
Social cost sub-model
The social cost sub-model is concerned with estimating nine economic indicators, namely levelised externality cost of energy, levelised social cost of energy, cumulative present value revenue, cumulative present value cost, net present value (NPV) before tax, NPV after tax, cumulative present value externality cost, social NPV before tax and social NPV after tax. The structure of the social cost sub-model is presented in Supplementary figure 7 above and is mainly characterised by the indicators. As this paper focuses on externality costs only, the levelised externality cost of energy is the only relevant indicator.
The levelised externality cost of energy (LECOE, ZAR/MWh), is composed of six stocks which reflect the six externalities studied in the coal-fuel cycle, namely cumulative present value (CPV) externality cost of water use, CPV water pollution externality, CPV fatalities and morbidity cost, CPV ecosystem services loss, CPV air pollution cost and CPV global warming damages. All these stocks have more or less similar structures and, to avoid repetition, only the dynamics of the CPV externality cost of water use (CPVExWU, ZAR) is explained. The coal-fuel cycle externality cost of water use together with the present value factor determines the present value externality cost of water use (PVExWU, ZAR/year), which is an inflow to the CPVExWU, given by:

The CPVExWU, coupled with cumulative present value net electricity production (PVNEP, MWh), determines the levelised water use externality (LWUEx, ZAR/MWh), as follows:

The levelised water use externality (LWUEx, ZAR/MWh), together with the levelised values from the remaining stocks, that is, levelised water pollution externality (LWPEx, ZAR/MWh), levelised fatalities and morbidity cost (LFMC, ZAR/MWh), levelised ecosystem services loss (LESSL, ZAR/MWh), levelised air pollution cost (LAPC, ZAR/MWh), and levelised global warming damages (LGWD, ZAR/MWh), are summed to yield the levelised externality cost of energy (LECOE, ZAR/MWh), represented by:

Damage cost parameters
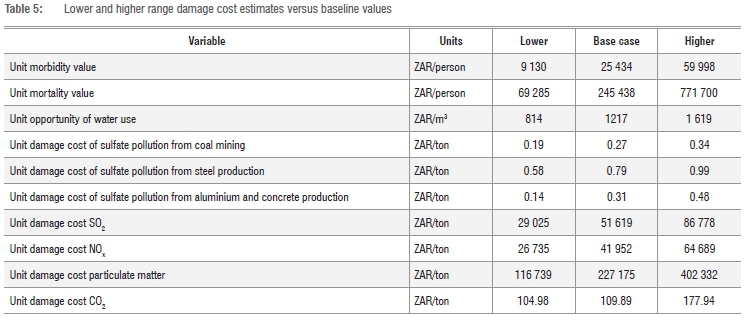
The lower, base case and higher range damage cost estimates used in the externalities sub-models are presented in Table 5. The sources of the estimates and how they were adjusted were discussed earlier while describing the various sub-models. More details on the techniques used to derive these estimates are provided in Nkambule15.
Model outcomes
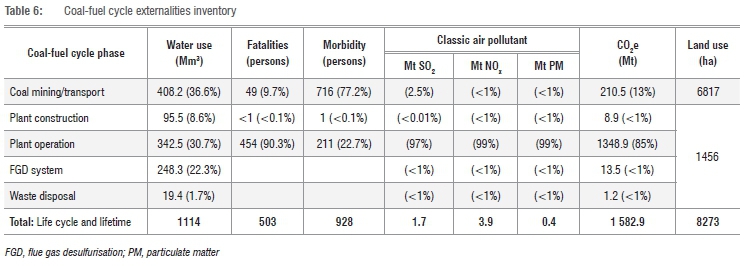
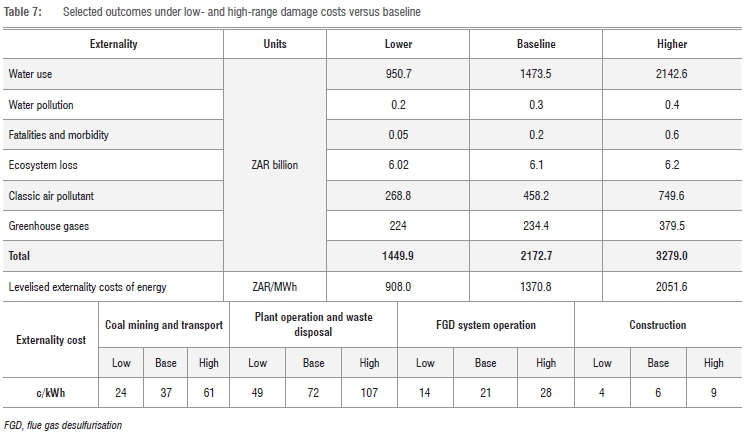
In this paper, a model was developed for understanding the measurable and quantifiable coal-fuel cycle burdens and externality costs over the lifespan of Kusile Power Station, following a system dynamics approach. A summary of the coal-fuel cycle externalities inventory and selected externality costs outcomes are presented in Tables 6 and 7, respectively. The important findings from this study are summarised below.
The externalities inventory analysis unveiled the plant operation phase as the highest water using phase in the coal-fuel chain (53%), with the FGD system adding about 22% to its baseline water requirements. Water use in the coal mining phase was also found to be high (37%), making the coal-fuel cycle a large yet hidden water user. Another important outcome of the analysis is that the coal mining phase was found to be more prone to injuries than deaths whereas the plant operation phase was found to be more prone to deaths than injuries. Human safety is therefore a serious problem in these two phases. Concerning air pollution loads, CO2e emissions were estimated at approximately 1583 million tons over the coal-fuel cycle and lifespan of Kusile, with SO2 emissions at a low 1.7 million tons as a consequence of the installation of the FGD system. Over 85% of the air pollutants emanated from the combustion phase (Table 6).
Attaching economic values to the studied externalities yielded a base case total coal-fuel cycle externality cost over Kusile's lifespan of ZAR2172.7 billion or 136c/kWh sent out. The low estimate is ZAR1449.9 billion or 91c/kWh while the high estimate is ZAR3279 billion or close to 205c/kWh sent out (Table 7). The levelised externality costs of energy ranged from ZAR908 to ZAR2052 per MWh (the levelised cost of energy is about ZAR554 per MWh15). Accounting conservatively for the life-cycle burdens and damages of coal-derived electricity thus doubles to quadruples the price of electricity. The plant combustion phase with waste disposal housed most of the externality cost (49-107c/kWh), followed by coal mining and transportation (24-61c/kWh) and the FGD system (14-28c/kWh). At the lower end is the construction phase (4-9c/ kWh) (Table 7). The combustion phase with its ancillary activities (i.e. FGD system, waste disposal and plant construction) therefore accounts for most of the externality cost (over two-thirds). In addition, the baseline model disclosed that most of the externality cost stems from three types of externalities, namely water use (over 65%), air pollution health cost (over 21%), and climate change effects from GHG emissions (over 10%).
When converted to US cents/kWh the total coal-fuel cycle externality cost ranges between 12c/kWh and 28c/kWh (baseline 19c/kWh), and for the most part falls within the range of the international studies reported in Table 2 and the local studies in Table 3, but is slightly higher because of the inclusion of more externalities and coal-fuel cycle phases. The coal-fuel cycle externality costs estimated in this study are, however, considered lower bound estimates because several externalities were not investigated; those excluded include noise pollution, damages to roads, and some upstream burdens. The true societal and environmental burdens of coal-based power are thus far greater than these numbers suggest.
Way forward for the South African government
The harshest way forward for the South African government in addressing the serious impacts of coal-based electricity, would be to reform the pricing system to properly reflect all the externalities in the price. Reducing the water use externality (over 65%) necessitates policy changes at national and local levels, e.g. requiring power plants to upgrade to dry cooling systems over a reasonable period of time and pricing water well.
Concerning the air pollution related human health effects (over 21%), the government can request retrofits of all existing plants with FGD devices over a reasonable period of time as well as require new plants to be fitted with this device. With regard to climate change effects from GHG emissions (over 10%), the South African government has taken action and intends to internalise the externality cost of carbon emissions on producers of GHGs through a carbon tax of ZAR120/t of CO2e emissions.41 The National Treasury42 has disclosed that introducing the carbon tax will significantly reduce the country's GHGs. In comparison to a business-as-usual scenario, the carbon tax would result in an emissions reduction of 13-14.5% by 2025 and about 26-33% by 2035.
Conclusion
Although coal-based electricity forms an integral part of our day-to-day lives, the use of coal for electricity generation carries a heavy burden for the social and ecological systems that go far beyond the prices we pay for electricity. In this paper, a model was developed based on a system dynamics approach for understanding the measurable and quantifiable coal-fuel cycle burdens and externality costs, over the lifespan of Kusile Power Station. The model showed that accounting for the life-cycle externalities of coal-derived electricity conservatively doubles to quadruples the price of electricity, making renewable energy sources such as wind and solar attractive options. However, because all electricity generation technologies are associated with undesirable side effects, comprehensive comparative analyses of life-cycle costs of all power generation technologies are necessary to guide the development of future energy policies in South Africa.
Acknowledgement
We are grateful to the National Research Foundation (South Africa) for funding.
Authors' contributions
The research was conducted as part of N.P.N.'s PhD, which was supervised by J.N.B.
References
1. International Energy Agency. Coal [homepage on the Internet]. c2017 [cited 2017 Feb 02]. Available from: http://www.iea.org.za [ Links ]
2. Eskom. Coal power [homepage on the Internet]. c2017 [cited 2017 Jan 28]. Available from: http://www.eskom.co.za [ Links ]
3. Singh G. Mitigating environmental and social impacts of coal mining in India [document on the Internet]. c2008 [cited 2011 Jul 11]. Available from: http://www.ismenvis.nic.in/My_Webs/Digital_Library/GSingh/Mitigating%20Environmental%20and%20Social%20Impacts%20of%20Coal%20Mining%20in%20India.pdf [ Links ]
4. Jorgensen AA. Transport costs and the relevance of externalities [document on the Internet]. c2010 [cited 2011 Jun 25]. Available from: http://www.rra.co.za/?p=16756 [ Links ]
5. Odeh NA, Cockeril TT. Life cycle analysis of UK coal fired power plants. Energy Convers Manag. 2008;49:212-220. https://doi.org/10.1016/j.enconman.2007.06.014 [ Links ]
6. Epstein PR, Buonocore JJ, Eckerle K, Hendryx M, Stout III BM, Heinberg R, et al. Full cost accounting for the life cycle of coal. Ann N Y Acad Sci. 2011;1219:73-98. https://doi.org/10.1111/j.1749-6632.2010.05890.x [ Links ]
7. Hondo H. Life cycle GHG emission analysis of power generation systems: Japanese case. Energy. 2005;30:2042-2056. https://doi.org/10.1016/j.energy.2004.07.020 [ Links ]
8. Zhao Y Wang S, Duan L, Lei Y Cao IP Hao J. Primary air pollutant emissions of coal-fired power plants in China: Current status and future prediction. Atmos Environ. 2008;42:8442-8452. https://doi.org/10.1016/j.atmosenv.2008.08.021 [ Links ]
9. Van Horen C. Cheap energy - at what cost? Externalities in South Africa's electricity sector. In: Van Horen C, editor. Counting the social costs: electricity and externalities in South Africa. Cape Town: Elan Press and UCT Press; 1997. [ Links ]
10. Spalding-Fecher R, Matibe DK. Electricity and externalities in South Africa. Energy Pol. 2003;31:721-734. https://doi.org/10.1016/S0301-4215(02)00123-4 [ Links ]
11. Blignaut JN. Climate change: The opportunity cost of Medupi and Kusile Power Stations. J Energy South Afr. 2012;23(4):67-75. [ Links ]
12. Inglesi-Lotz R, Blignaut JN. Estimating the opportunity cost of water for the Kusile and Medupi coal-fired electricity power plants in South Africa. J Energy South Afr. 2012;23(4):74-84. [ Links ]
13. Riekert J, Koch SF. Projecting the external health costs of a coal-fired power plant: The case of Kusile. J Energy South Afr. 2012;23(4):52-66. [ Links ]
14. Weisser D. A guide to life-cycle greenhouse gas (GHG) emissions from electric supply technologies. Energy. 2007;32:1543-1559. https://doi.org/10.1016/j.energy.2007.01.008 [ Links ]
15. Nkambule NP. Measuring the social costs of coal-based electricity generation in South Africa [PhD thesis]. Pretoria: University of Pretoria; 2015. Available from: http://hdl.handle.net/2263/45866 [ Links ]
16. Mishra SK. Estimation of externality costs of electricity generation from coal: An OH-MARKAL extension dissertation [PhD thesis]. Columbus, OH: The Ohio State University; 2009. Available from: http://etd.ohiolink.edu/view.cgi/Khadka%20Mishra%20Shruti.pdf?%20osu1259703337 [ Links ]
17. Sundqvist T. Electricity externality studies - Do the numbers make sense? [PhD thesis]. Luleá: Luleá University of Technology; 2000. Available from: http://www.diva-portal.org/smash/get/diva2:990535/FULLTEXT01.pdf [ Links ]
18. Parry ML, Canziani OF, Palutikof JP, Van der Linden PJ, Hanson CE, editors. Climate change 2007: Impacts, adaptation and vulnerability. Contribution of Working Group II to the Fourth Assessment Report of the Intergovernmental Panel on Climate Change. Cambridge, UK: Cambridge University Press; 2007. [ Links ]
19. Schuman M, Cavanagh R. A model conservation and electric power plan for the Pacific Northwest. Appendix 2: Environmental Costs. Seattle: NCAC; 1982. [ Links ]
20. Chernick P Caverhill E. The valuation of externalities from energy production, delivery and use. A report to the Boston Gas Company. Boston, MA: PLC Incorporated; 1989. [ Links ]
21. Bernow S, Biewald B, Marron D. Full-cost dispatch: Incorporating environmental externalities in electric system operation. Electr J. 1991;4(2):20-33. https://doi.org/10.1016/1040-6190(91)90168-S [ Links ]
22. Hohmeyer O. Social costs of energy consumption. Berlin: Springer-Verlag; 1988. https://doi.org/10.1007/978-3-642-83499-8 [ Links ]
23. Ottinger RL, Wooley DR, Robinsson NA, Hodas DR, Babb SE. Environmental costs of electricity. New York: Oceana Publications; 1991. [ Links ]
24. Pearce D, Bann C, Georgiou S. The social cost of fuel cycles. Report to the UK Department of Trade and Industry. London: HMSO; 1992. [ Links ]
25. ORNL and RfF. External costs and benefits of fuel cycles. A study for the US Department of Energy and the Commission of the European Communities. Report No. 1-8. Washington: McGraw-Hill/Data Institute; 1994. [ Links ]
26. European Commission. ExternE: Externalities of energy. Vol. 3: Coal and lignite. Luxembourg: Office for Official Publications of the European Communities; 1995. [ Links ]
27. European Commission. ExternE: Externalities of energy. Vol. 7-10. Luxembourg: Office for Official Publications of the European Communities; 1999. [ Links ]
28. Sundqvist T. Regulating externalities in the power sector: Some lessons from previous valuation studies. Miner Energy Raw Mater Rep. 2001;16(1):14-31. https://doi.org/10.1080/14041040119222 [ Links ]
29. Pretorius K. Coal mining and combustion: Internalising the cost for a fair climate change debate. Johannesburg: Federation for a Sustainable Environment; 2009. [ Links ]
30. Van Zyl H, Raimondo J, Leiman T. Energy supply sector - coal mining. WWF macroeconomic reforms and sustainable development in South Africa. Johannesburg: Development Bank of South Africa; 2002. [ Links ]
31. Dutkiewicz RK, De Villiers MG. Social cost of electricity production. Report for the National Energy Council. Pretoria: Engineering Research; 1993. [ Links ]
32. Nkambule N, Blignaut JN. The external costs of coal mining: The case of collieries supplying Kusile Power Station. J Energy South Afr. 2012;23(4):85-93. [ Links ]
33. Blignaut J, Koch S, Riekert J, Inglesi-Lotz R, Nkambule N. The external cost of coal-fired power generation: The case of Kusile. Pretoria: Business Enterprises, University of Pretoria; 2011. [ Links ]
34. United States Agency International Development (USAID). Workers' compensation in the Republic of South Africa. c2008 [cited 2014 Aug 13]. Available from: http://ssreform.treasury.gov.za/Publications/Workers'%20Compensation%20in%20the%20Republic%20of%20South%20Africa%20(USAID,%202008).pdf [ Links ]
35. European Commission. ExternE: Externalities of energy, methodology 2005 update [document on the Internet]. c2005 [cited 2011 Mar 17]. Available from: http://ec.europa.eu/research/energy/pdf/kina_en.pdf [ Links ]
36. NEEDS. Final report on the monetary valuation of mortality and morbidity risks from air pollution: Deliverable for WP6 of RS1b of the New Energy Externalities Developments for Sustainability (NEEDS) project [document on the Internet]. c2007 [cited 2011 Mar 12]. Available from: http://www.needs-project.org/RS1b/NEEDS_RS1b_D6.7.pdf [ Links ]
37. NewExt. New Elements for the Assessment of External Costs from Energy Technologies [document on the Internet]. c2004 [cited 2011 Mar 19]. Available from: http://www.ier.uni-stuttgart.de/forschung/projektwebsites/newext/ [ Links ]
38. Turton A. Three strategic water quality challenges that decision-makers need to know about and how the CSIR should respond [document on the Internet]. c2008 [cited 2011 Jun 25]. Available from: https://cdn.mg.co.za/uploads/keynoteaddresscsir2008.pdf [ Links ]
39. BCS-Incorporated. Energy and Environmental Profile of the U.S. Mining Industry [document on the Internet]. c2002 [cited 2011 Nov 17]. Available from: http://www1.eere.energy.gov/ [ Links ]
40. Blignaut J, Mander M, Schulze R, Horan M, Dickens C, Pringle K, et al. Restoring and managing natural capital towards fostering economic development: Evidence from the Drakensberg, South Africa. Ecol Econ. 2010;69:1313-1323. https://doi.org/10.1016/j.ecolecon.2010.01.007 [ Links ]
41. National Treasury. Carbon tax policy paper: Reducing greenhouse gas emissions and facilitating the transition to a green economy [document on the Internet]. c2013 [cited 2013 Dec 10]. Available from: http://www.treasury.gov.za [ Links ]
42. National Treasury. Media Statement: Publication of the carbon tax modelling report [document on the Internet]. c2016 [cited 2017 Jan 27]. Available from: http://www.treasury.gov.za [ Links ]
 Correspondence:
Nonophile Nkambule
nonoprome@gmail.com
Received: 17 June 2016
Revised: 16 Mar. 2017
Accepted: 05 June 2017

