


Services on Demand
Article
 English (pdf)
 Article in xml format
 Article references
Indicators

Related links
-
 Cited by Google
 -
 Similars in Google
Share

 Permalink
South African Journal of Science
On-line version ISSN 1996-7489
Print version ISSN 0038-2353
S. Afr. j. sci. vol.113 n.3-4 Pretoria Mar./Apr. 2017
http://dx.doi.org/10.17159/sajs.2017/20160187
RESEARCH ARTICLE
Emission factors of domestic coal-burning braziers
Tafadzwa MakoneseI; Daniel M. MasekameniII; Harold J. AnnegarnI, III; Patricia B.C. ForbesIV
ISustainable Energy Technology and Research Centre, University of Johannesburg, Johannesburg, South Africa
IIDepartment of Environmental Health, University of Johannesburg, Johannesburg, South Africa
IIIEnergy Institute, Cape Peninsula University of Technology, Cape Town, South Africa
IVDepartment of Chemistry, University of Pretoria, Pretoria, South Africa
ABSTRACT
We present experimental results of emission factors from a suite of domestic coal-burning braziers (lab fabricated and field collected) that span the possible range of real-world uses in the Highveld region of South Africa. The conventional bottom-lit updraft (BLUD) method and the top-lit updraft (TLUD) method were evaluated using coal particle sizes between 20 mm and 40 mm. Emission factors of CO2, CO and NOx were in the range of 98-102 g/MJ, 4.1-6.4 g/MJ and 75-195 mg/MJ, respectively. Particulate matter (PM25 and PM10) emissions were in the range 1.3-3.3 g/MJ for the BLUD method and 0.2-0.7 g/MJ for the TLUD method, for both field and lab-designed stoves. When employing the TLUD method, emission factors of PM25/PM10 reduced by up to 80% compared with those when using the BLUD method. Results showed the influence of ventilation rates on emission factors, which reduced by ~50% from low to high ventilation rates. For energy-specific emission rates, the combined (3-h) PM10 emission rates were in the range of 0.0028-0.0120 g/s, while the combined average CO emission rates were in the range of 0.200.26 g/s, with CO2 emission rates in the range of 0.54-0.64 g/s. The reported emission factors from coal braziers provide the first comprehensive, systematic set of emission factors for this source category, and fill a major gap in previous efforts to conduct dispersion modelling of South African Highveld air quality.
SIGNIFICANCE:
• The study provides the first comprehensive, systematic set of emission factors from coal braziers.
• The study fills a major gap in previous efforts to conduct dispersion modelling of South African Highveld
air quality.
• Results have implications for stove design and lay the groundwork for improvements in the design of existing coal braziers.
• Results have implications for understanding the potential health impacts of condensed matter emissions from coal braziers.
Keywords: emission rates; domestic coal combustion; air quality; ventilation rates; ignition method
Introduction
Exposure to fine particulate matter (PM) from solid fuel combustion is associated with morbidity1-3 and mortality4-5, especially in the developing world6. About three billion people worldwide are exposed daily to harmful emissions from the combustion of solid fuels. Combustion of these fuels releases products of incomplete combustion such as carbon monoxide, PM and volatile organic compounds.7 The WHO Global Health Observatory has reported that household air pollution caused the premature deaths of ~4.3 million people globally in 2012, while a further 3.7 million premature deaths were attributable to ambient air pollution.8 Household air pollution is associated with many health effects such as acute and chronic respiratory disorders, and pulmonary and systemic diseases.7
Emission inventories for PM are critical in establishing how sources affect health and climate and, therefore, need to be continuously improved.6 To date, emission factors from the literature are still adopted in the development of emission inventories. However, there is currently a lack of sufficient and reliable data, especially for emission factors, which leads to uncertainties and bias in many emission inventories due to influences of a variety of parameters.6,9 For example, combustion technology and operational practice of appliances have a major influence on the physicochemical properties of the emitted particles.6,10-13 Reported emission factors from domestic burning vary as a result of differences in (1) fuel properties (e.g. moisture and volatile matter content); (2) stove design; (3) fire ignition methods (top-lit versus bottom-lit); (4) fire management and ventilation (e.g. air supply amount and fuel-air mixing condition); and (5) experimental methods (e.g. laboratory chamber, simulated stove/open burning and field measurement).6,9,14-17
In South Africa, particularly on the interior Highveld plateau, combustion of coal in open braziers is among the largest sources of PM and black carbon emissions. Coal is still used as a primary cooking and heating fuel for the majority of the population.18 There are two ignition methods for lighting a coal fire, namely the traditional bottom-lit updraft (BLUD) method and the reduced smoke top-lit updraft (TLUD) method, locally known as the Basa njengo Magogo (BnM).
The rapid electrification of households after 1990, now reaching over 95% of urban dwellings, did not result in the anticipated switch away from combustion of solid fuels for heating and cooking.19,20 As an interim method to reduce population exposure to domestic smoke emissions, the South African Department of Energy embarked on a public awareness campaign to encourage the dissemination and uptake of the BnM method as a no-cost method of reducing smoke emissions.21,22 The TLUD approach is a simple intervention in the manner in which residential fires are lit, and involves placing kindling at the top rather than at the bottom of the fuel load in a brazier or stove. In contrast, the traditional BLUD method involves placing the kindling and igniting it at the bottom of the brazier or stove, with the bulk of the fuel placed on top of the burning kindling.23-25 The TLUD method is estimated to result in a 70-90% reduction in ambient particulate emissions and a 20% reduction in coal consumption at no additional cost to households.26,27 For several years (from 2009 to 2014), the implementation of the BnM rollout became a national priority energy intervention programme.
However, these reports had limitations that reduce confidence in the reported emission factors - the studies did not control or systematically evaluate braziers regarding fuel quality, ventilation rates or fuel moisture content, leading to substantial uncertainties in derived emission inventories.27,28 Determination of such influences is necessary for an improved understanding of emission characteristics and more accurate emission factors.6,29 In 1997, the Atomic Energy Corporation of South Africa characterised one standard coal sample and 10 low-smoke test fuels for physical, chemical and pollutant emission factors.27 The authors used only a single stove in the experiments but noted that there are many different stoves and brazier designs in use in South Africa, and that brazier designs would influence emission factors. As such, it is likely that specific fuels would have altered emission profiles when combusted in different braziers.
We carried out a comprehensive and systematic study of gaseous and PM emissions from the combustion of commonly used D-grade coal in typical artisanal coal-burning braziers. The information provided in this article will be useful for improving emission inventories for CO, CO2, NOx and PM from domestic coal combustion.
Materials and methodology
Experimental stoves
Brazier stoves are made by hand out of metal drums with perforations of varying sizes punched around the sides, with a wire grate installed across the middle to support the fuel bed. There is no standard brazier design, as the devices vary widely regarding the number, size and distribution of the side holes (which affects ventilation rates), as well as the presence or absence of a grate and its position in the drum. Braziers are used widely in informal settlements and less affluent suburbs for heating and roadside cooking while burning wood, coal or even trash.
Three braziers (imbaula), part of a set of 11 procured from user communities (hereafter field stoves) (Figure 1a-c) and three stoves designed and built at the SeTAR laboratory at the University of Johannesburg (hereafter lab stoves) (Figure 1d-f) were evaluated for emissions performance. Tests were conducted under laboratory-controlled conditions at the SeTAR Centre. The lab stoves had uniformly sized and spaced holes, designed so that the total ventilation hole area approximated the corresponding field stoves - high, medium and low ventilation cases, respectively. By the nature of the imbaula device, the irregular shape and packing density of coal pieces within a particular combustion sequence does not allow for precise measurement or replication of air flow through the holes into the combustion zone. While the lab stove makes an attempt to replicate the 'as found' artisanal field stoves by reproducing the same ventilation hole area in a regularly spaced array of uniform size holes, complete congruency could not be established between the field and lab stoves.


Stove ventilation rates
Stove ventilation rates, as a function of air hole density, can affect the overall performance of a fuel/stove combination. Ventilation rates differ from one brazier model to another depending on the hole size, hole configuration (or pattern) and hole density. Ventilation rates need to be measured and specified to be able to evaluate and compare the performance of two or more braziers.11 The total hole areas, indicative of the ventilation rates of the braziers, for the field and lab stoves are given in Table 1.
Lab stoves were fabricated by drilling 20-mm-diameter air holes on new, empty 20-L metal paint drums (H=360 mm, D=295 mm); different hole densities were employed for the high, medium and low ventilation cases, and holes were distributed above and below the grate. The grate was set at 120 mm from the base - a height typical of the prototype braziers collected from the informal settlement.30 The hole sizes in the field stoves varied from 10 mm to 40 mm; a uniform hole diameter of 20 mm was used for the lab stoves.
Fire ignition method
The BnM fire ignition method is a local derivative of the TLUD procedure. The sequence for setting a TLUD fire is to place the major portion of the coal load on the fuel grate, and then place kindling (paper and wood chips) on top, ignite the kindling, and finally put a few coal nuggets on top of the burning kindling a few minutes after ignition. As such, about 2.0 kg of coal was added onto the fuel grate, followed by 0.4 kg of kindling (0.04 kg newspaper and 0.36 kg wood chips). After ignition, ~1.0 kg of coal is added on top of the burning kindling.11 For the BLUD, the sequence is reversed: ~1.0 kg of coal is placed onto the grate, followed by 0.4 kg of kindling. After ignition, ~2.0 kg of coal is added to the burning kindling. The BLUD method results in copious smoke emissions, as the fire is oxygen-starved during the initial stages of combustion.11
Fuel characterisation
The coal fuel used in the experiments was purchased from a local coal merchant and compared with coal sourced directly from a colliery in the Witbank Emalahleni coalfield. The initial field survey revealed that local merchants obtained a D-grade type coal fuel from Slater Coal Mine (Dundee, KwaZulu-Natal, South Africa). In light of the above, batches of D-grade coal, sufficient to conduct a range of comparative tests, were purchased from the coalfield. For each fuel batch, the fuel was first mixed for homogeneity and then three 2-kg samples were taken to an independent laboratory for analyses. Calorific value, proximate (moisture, ash, volatile organic compounds, fixed carbon) and ultimate (%C, %H, %S, %O and mineral elements) analyses were performed (Table 2).
The coal was crushed and sieved. The fraction passing through a 40mm upper sieve and retained by a 20-mm lower sieve was used in all experiments to avoid variability from coal particle size - a variable that was not investigated in this study. The fuel was then stored in moisture-free containers. Immediately before commencing a series of combustion tests, a sample of the fuel was re-analysed for moisture content using an electric oven. The quantities of fuel used in the experiments are detailed in the section on the fire ignition method.
Sampling procedure
Gas measurement techniques
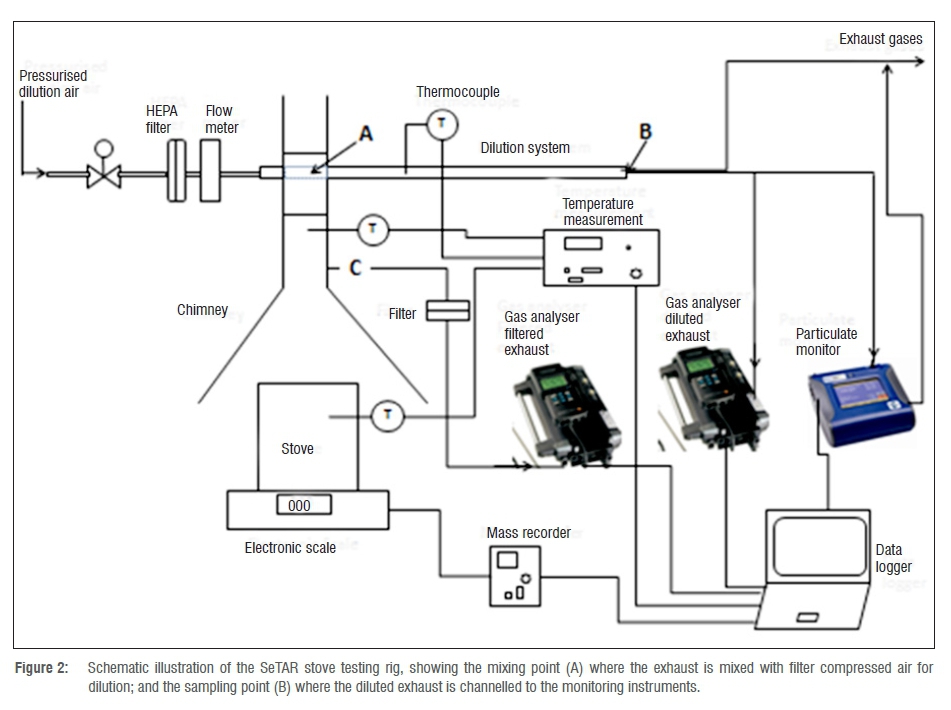
In this study, the hood method31 was used for monitoring emissions from domestic coal-burning braziers. Because the experimental braziers did not have a flue, the stoves were placed under a smoke collection hood attached to the SeTAR dilution system responsible for the ducting and dilution of the exhaust gas stream.11 When using an extraction fan, high extraction rates tend to influence the combustion characteristics of a stove.32 In light of this, an extractor fan was not used for drawing air through the hood and duct. An extractor fan may be useful in preventing flue gases escaping from the bottom of the hood.32 However, our system relies on the carbon mass balance method, which only requires a representative sample of the exhaust gases to quantify the emissions and not the total capture of all combustion products. An advantage of the hood method is that it can be employed for the simultaneous determination of thermal and emission parameters in a standard and systematic manner.33 Figure 2 shows the experimental set-up.
The measurement instruments (gas and particle analysers) used in this study cannot cope with the dense smoke emitted from braziers during the initial phases of combustion. This dense smoke saturates the analytical instruments, which results in underreporting of emission factors as a result of the concentrations exceeding the measurement range of the instruments, or causes the machines to clog with condensed organic deposits, resulting in erroneous readings. The SeTAR dilution system was designed with these consequences in mind. The dilution system is connected to the hood and the sampling nozzle is placed in the stack gas.
The inlet of the sampling nozzle is not equipped with a PM25 fractionating cyclone, as the majority of the particles are condensation or Aitken particles below 1 μπι in diameter. This sampling nozzle is followed by a mixing tunnel in which the hot exhaust is diluted with aerosolfree filtered air. The diluted exhaust then passes through a 0.9-m long ageing chamber (mixing chamber), and then through sampling ports for gaseous and particle emissions monitoring. The dilution level can be pre-set or changed by continuously varying the volume of dry air, depending on need. By recording diluted CO2 and undiluted CO2, the dilution ratio can be calculated for each 10-s interval. As such, there is no need for flow monitoring or calibration of flow meters. The volume of dry CO2-free air supplied through the jet can be controlled by using a rotameter with a needle-valve flow controller.
The sampling configuration for the undiluted gas channel comprised Teflon tubing, a 4-μm pore diameter filter pack, and a flue gas analyser (Testo® 350XL/454) with cells for CO2, CO, NOx and O2.34 For the diluted channel, the sampling configuration included the dilution system, a Teflon tube, and a flow splitter to duct gas streams to a DustTrak DRX 8533 aerosol monitor and a second Testo® analyser.
Particle measurement techniques
The particle mass concentration is determined in the unfiltered, diluted air stream. The sampling configuration for PM included the SeTAR dilution system and the particulate monitor (DustTrak DRX 8533 aerosol monitor), connected by Teflon tubing (Figure 3). The DustTrak aerosol monitor is an optical particle counter that simultaneously measures size-segregated mass fraction concentrations (PM1, PM2.5, PM4, PM10 and total particle mass) in real time over a 0.001-150 mg/m3 concentration range. The instrument is calibrated by the manufacturer, Raeco, annually. It is noted that the mass of the sub-micron fractions reported by optical particle counters may be overestimated in comparison with gravimetric methods.35 PM emission factors reported in this paper are based on the mass determined from the optical particle counter, and no post-measurement correction factors have been applied to compensate for possible overestimations. While relevant for purposes of dispersion modelling, any discrepancies in the mass will not invalidate the comparisons made between ignition methods and ventilation rates.
Calculations
Gas emission factors
The measurement of emissions using the hood method was carried out on three field and three lab stoves that span the range of braziers used in the informal settlements of Gauteng Province. As in Bhattacharya et al.32, concentrations of CO, CO2 and NOx were monitored, enabling calculation and estimation of emission factors for each pollutant.
Emission factors presented in this study are calculated as in Bhattacharya et al.32 with slight modifications (methane and non-methane hydrocarbons are not reported herein), for energy-specific emission factors in units (g/MJ) of energy in the fuel. The lower heating value is used for calculations of thermal efficiency numbers and the determination of energy-specific emission factors. For each test, CO, CO2 and NOx concentrations (ppmv) were recorded every 10 s for the duration of the burn sequence or the test experiment.
Using the carbon mass balance method, CO and CO2 emission factors were calculated using:

where Cmoles is the total moles of carbon burnt, Cmass is the mass of moles ' mass carbon in the fuel, Cash is the mass of carbon in the ash and Mcarbon is the molecular mass of carbon.32
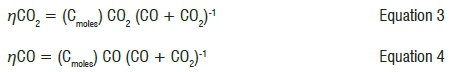
Cmoles in the flue gas can be determined by:

where ηCO refers to the moles of carbon in CO in the flue exhaust, and ηCO2to the moles of carbon in CO2 in the flue exhaust.
Mass-specific emission factors (EF) for CO2 and CO in units (g/kg) are given by:
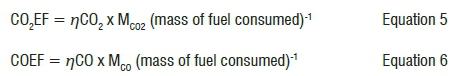
where MCO2 and MCO are the molecular masses of CO2 and CO, respectively.
Energy-specific emission factors for CO2 and CO expressed in units (g/MJ) are given by:
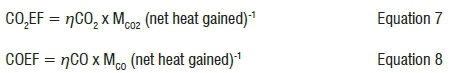
where the net heat gained refers to the heat retained by a cooking vessel during the water heating experiments.
Excess air
Excess air was determined using the SeTAR data calculation sheet, which employs a chemically balanced approach (which is detailed on the SeTAR website). The determination of the total air demand (λ) is given by:
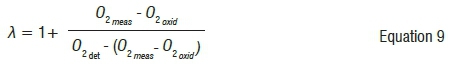
where 02 meas is the concentration of O2 measured in the exhaust; 02 oxid is the amount of O2 required to oxidise completely unburned gases or products of incomplete combustion; and 02det is the total O2 in all detected gases.18
Energy-specific particulate emission factors
Gaseous emission (in ppmv) can be converted to other units including energy-specific emission factors referenced to the energy content in the fuel consumed, namely g/MJ and mg/MJ. There is a need to first determine the net heat gained from the fuel. Net heat gained is23:
The heat retained by a cooking vessel during a burn sequence and is expressed in units of megajoules (MJ). It includes the heating of the pot and its contents plus the heat of evaporation of water, but excludes other heat flows through the pot, specifically radiative and convective losses from the pot sides and top.
The mass of detected PM2.5 or PM10 is first multiplied by the dilution factor and then multiplied by λ to obtain the actual mass emitted before dilution. According to Language et al.35, this approach is based on the foreknowledge that any missing fuel has been turned into combustion products of some type. This method can track and correctly determine the performance of the stove in real time while burning fuels in an inhomogeneous manner, as is often the case with biomass and coal fuels. The standard reporting metrics for the particle mass concentration include the mass of PM emitted per net megajoule of energy delivered into the pot, or mass of PM emitted per net megajoule of energy delivered from the fire.36 For example, the mass of PM10 emitted during a burn sequence is determined and divided by the net heat gained, yielding emissions per net megajoule (g/MJ) or (mg/MJ). For example:
Emission rates
Emission rates (g/s) for PM and gaseous emissions were determined, averaged per hour for each hour of a maximum 3-h burn sequence, and also averaged over the first 3 h of the burn sequences.
Statistical analyses
An F-test was used to test whether different stove test results for the ignition method and ventilation rates had the same variance. Because the F-test is a relatively robust statistical tool, we used high alpha levels (0.05) and balanced layouts. The F-test result was then used to determine the best f-test analysis to use on the data (i.e. a two-sample f-test, assuming equal variances or a two-sample f-test, assuming unequal variances).
A two-tailed Student f-test (at the 95% confidence level) was used for evaluating the thermal and emissions data between fire ignition methods and between ventilation rates. For this study, a statistically significant value was taken as a p-value less than 5% (p<0.05).
Quality control
For each brazier model, a series of preliminary burn sequences was carried out to standardise procedures and to minimise the variability from differences in user/operator behaviour. After that, five definitive tests were conducted for each brazier model. After every test run, the gas probes and Teflon tube channels were cleaned, and the pumps and machines checked and zeroed.
Continuous gas and particle monitoring instruments are routinely sent for calibration at intervals prescribed by the manufacturers, or at least once annually, and need to be periodically verified with laboratory standards. Zero and span calibration were performed on all analysers before and after every test run to account for small variations in the dilution ratio. For example, the DustTrak DRX was zeroed with filtered air before each test run.
Before conducting test experiments, the sampling dilution system components were disassembled, cleaned, air dried, assembled, and 'tested for leaks to prevent contamination from the surrounding air'37 to avoid contamination of the emissions with organic and metal compounds from previous burn sequences. High power compressed air and water were used to remove large particles from the sampling channels. The exhaust collection trains, involving stainless steel ducts, Teflon tubes, and sampling nozzles, were cleaned with soap and water and air dried with filtered compressed air.
The response time of monitoring instruments can be affected by the time the exhaust takes to travel from the inlet probe to the instrument and through the sensing volume within the instrument. The time lags were measured before and after a test. The system was first allowed to run on air for a few minutes to sample ambient air for purposes of obtaining background readings. Then an ignition torch was lit near the inlet of the sampling probe. After the ignition torch had been extinguished, the system sampled ambient air for a few more minutes to allow the instrument signals to return to background levels, after which the ignition torch was lit again. These time delays were noted and then corrected for in the spreadsheet when calculating pollutant emission factors for different fires.
Results and discussion
Gaseous emission factors
General observations
When the kindling was lit for the BLUD method, the coal immediately began to give off sulfurous odours and dense whitish/yellowish smoke - a consequence of devolatilised organic matter that had not reached combustion temperature or had insufficient oxygen to oxidise fully. A few minutes elapsed before the coal could be considered ignited (taken as parts of the lowest lumps of coal glowing visibly red). However, the thick white smoke continued for up to 30 min as volatiles were evolved from the gradually heated coal above the rising combustion front. There was considerably less smoke for the TLUD ignition method, with high flames above the coal bed resulting from ignition of the evolved devolatilised organic matter passing through the descending combustion front, with homogenous phase combustion continuing in the rising gas mixture above the coal bed.
Gas and PM emission factors for lab stoves using D-grade coal
Gas and PM emission factors for the laboratory-designed stoves, using D-grade coal, for TLUD and BLUD methods are presented in Table 3, together with a statistical comparison of the differences. The emission factors are based on integration over the combustion sequence, from ignition until 3 h had elapsed, or fuel burnout, whichever was the soonest.
For any given ventilation rate, and for either TLUD and BLUD ignition, PM25 and PM10 emission factors were similar. Particles <2.5 µm in aerodynamic diameter constitute more than 90% of the mass of particulate emissions <10 µm in aerodynamic diameter (Table 3). There were significant differences (p<0.05) in particle emissions between the BLUD and TLUD methods, for all three ventilation rates. The TLUD approach reduced PM10/PM2.5 emissions by 76-80% compared to the 'business as usual' BLUD method. This result is similar to assertions made by Le Roux26 who found a reduction in particulate emissions of between 78% and 92% when using the TLUD ignition method.
Comparison of ignition methods (Table 3) shows that there were no significant differences (p>0.05) in CO, CO2 and NOx emissions at any given stove ventilation rate, implying that the ignition method did not affect the combustion characteristics of the pollutants in the devices tested. There were no significant differences between NOx emissions when varying the ignition method, although there was an average 16% decrease in the emissions for the TLUD method. Results for NOx are as expected, as the maximum temperatures reached in the braziers for either ignition method were below the threshold temperature for oxidation of atmospheric nitrogen. Fuel-derived NOx was released in proportion to concentration in the fuel and was invariant to the ignition method or ventilation rate.
Gas and PM emission factors from field stoves using D-grade coal
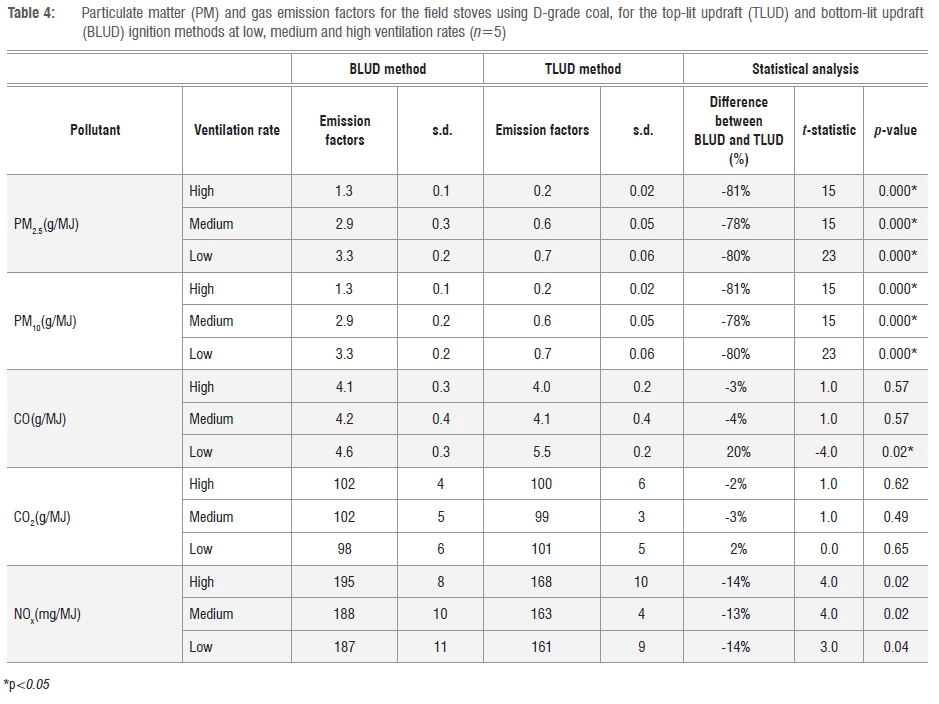
Gas and PM emission factors for the field designed stoves, using D-grade coal, for TLUD and BLUD ignition methods are presented in Table 4.
There were significant differences (p<0.05) in PM10 emission factors between the fire ignition methods. Emissions of PM2.5 and PM10 from the TLUD ignition method were fivefold lower (80% reduction) than those from the BLUD method, across all ventilation rates. These results confirm results presented in Table 3 for the lab-designed stoves.
For CO, there was a significant difference in CO emissions between the fire ignition methods at low ventilation rates. At this ventilation rate, there was a 20% increase in CO when using the TLUD method. Lack of oxygen resulted in smouldering combustion conditions that favoured the emission of products of incomplete combustion, including CO and polycyclic aromatic hydrocarbons.11 NOx emissions show that a significant difference exists between ignition methods across all ventilation rates. Further investigations are required to investigate this anomaly.
Influence of stove ventilation rates
The effect of ventilation rates on the emissions of PM, CO, CO2 and NOx were investigated. Three stoves with different ventilation rates were used for each ignition method, with moisture content and other parameters held constant. The results of these experiments for the lab-designed braziers are presented in Table 5.
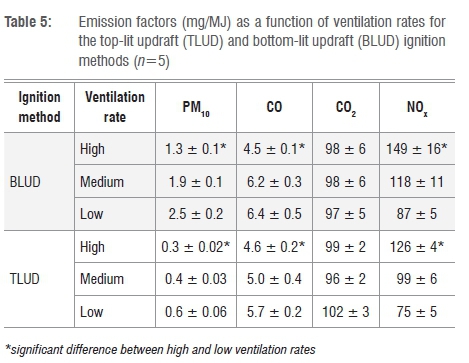
There were significant differences (p<0.05) in PM10 emissions for both ignition methods at low, medium and high ventilation rates, implying that ventilation rate affected the combustion characteristics of PM10 in all the experimental braziers. For a given device, switching from low to high ventilation rates reduced PM25 and PM10 emission factors by 50%. This advantage is offset by a firepower excessive for convenient cooking (about 10 kW) especially during the ignition and pyrolisation combustion phases as well as by increased fuel consumption (by a factor of ~1.3 compared to low ventilation rates).
However, this improvement from increased ventilation is not as significant as the decrease from the top-lit ignition. A well-ventilated brazier, when used in conjunction with the TLUD ignition method, has the potential to have the maximum reduction of PM emissions from coal fires in open braziers.
There was a significant difference (p<0.05) in CO emissions, but not CO2 emissions, between the high and low ventilation rates. This finding shows that ventilation rate influences CO emissions, but may not influence the combustion characteristics of CO2. There was also a significant difference in NOx emissions between high and low ventilation rates for BLUD and TLUD fires.
Emission rates
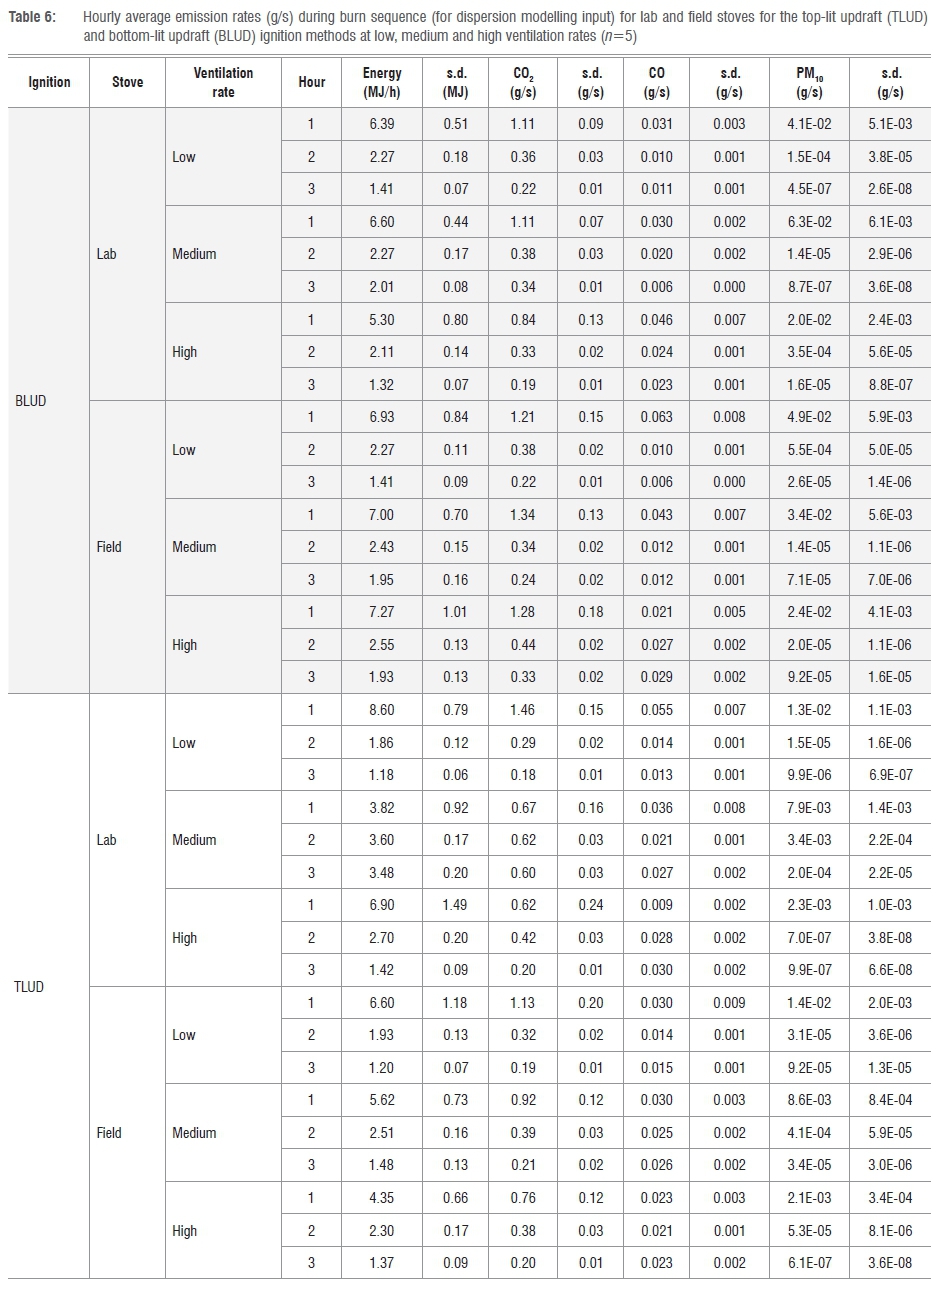
The emission rates of CO, CO2 and PM10 for selected braziers with three different ventilation rates, using D-grade coal, were calculated from measurements using the TLUD and BLUD ignition methods. Knowing the burn rate of the fuel (mass loss) and concentrations of the exhaust components, we determined the exhaust emission rates during the operation of the braziers, per hour of operation (Table 6) and for the full 3-h combustion sequence (Table 7). The emission rates are expressed in units (g/s), as required by dispersion model input specifications. Averages of five tests are given together with the standard deviation. Higher particulate emission rates occurred in the first hour of combustion (ignition and pyrolysis phases) than in the second and third hours, which can be associated with condensed semi-volatile compounds that are driven off from the kindling and during initial heating of the coal. Thereafter, the particulate emission rates decreased considerably, reaching lowest levels during the last hour of the 3-h combustion sequence. In constructing realistic emission patterns from domestic combustion for dispersion modelling, the correct diurnal time evolution of emissions becomes an important factor in generating accurate dispersion predictions. Such hourly emission factors can be adapted to the lifestyle patterns of the modelled communities when conducting health risk assessments based on dispersion modelling and exposure assessments.
Table 7 presents a summary of 3-h (full burn sequence) emission rates for lab-designed and field-obtained braziers for each ventilation rate using the BLUD and the TLUD fire ignition methods and the combined average emission rate over the three ventilation rates. There were no differences in the combined average CO2 emission rates for the two ignition methods and between the lab and field stoves. The combined average CO2 emission rates were 0.54-0.64 g/s. There were differences in the combined average CO emission rates between the stoves and the ignition methods. The combined average CO emission rates were in the range of 0.20-0.26 g/s. The combined average PM10 emission rates were in the range of 0.00280.012 g/s (Table 7).
The data presented in Table 6 and Table 7 are useful for short-term modelling of pollutants in which 1-h average emission rates are required inputs for standard dispersion models. Source data input requirements for air dispersion modelling include specific mass emission rates, physical stack measurements (e.g. diameter, stack height, exit velocity and temperature of the exhaust gases) and dry and wet deposition settling parameters for PM. For domestic sources that are too numerous to model individually, emissions are treated as area sources, therefore requiring a knowledge of the source density [number of homes/emission points per km2] and the emission rate per source (g/s). The source density can be derived from remote-sensing images and GIS methods, or from census data. However, up to now, there has been no systematic study to characterise emissions from a range of domestic coal stoves and braziers, including variability of stove design, fuel quality, and stage of the burn or user behaviour. Emission values presented in Table 6 and Table 7 may be used to construct better area source emission estimates than have been available up to now, in the absence of reliable emission factors of individual coal combustion devices, and the time variations of these emissions.
Limitations of the research study
The primary purpose of this study was to investigate in a systematic manner some of the factors influencing imbaula emissions - namely ventilation rates and ignition methods. For this purpose, the number of replicates used in the study is deemed adequate to reach sound conclusions. As an adjunct, emission factors have been derived. The selection of field stoves was based on covering the range encountered in one township. This range included a wide variety of drum sizes, diameters and distributions of holes, and state of disrepair. A comprehensive survey would be required to determine the properties of the larger range of imbaulas used across the Highveld region.
Another limitation is that emissions from imbaulas should not be used as a surrogate for emissions from cast iron coal stoves that have entirely different ventilation structures, combustion characteristics and probably user behaviours. We used only a single grab sample of coal. Emissions rates may also vary according to the coal quality and/or from which mine or geological seam the coal was derived, and according to the type and quantity of kindling used to ignite the coal. However, determining the effects of coal quality and kindling on emissions was outside the scope of this study. We kept the kindling uniform in terms of quality and quantity throughout the experiments.
For experimental purposes, controlled methods of fire setting were adopted. No attempt was made to survey the range of user behaviours, or to model some of the extreme behaviours encountered in the field regarding setting the fuel load and ignition method. For example, roadside mealie cookers fill the imbaula to the brim (5 kg coal) before ignition, resulting in a prolonged period of intense smoke emission. As with most combustion stoves, user behaviour is one of the largest factors in variability in stove efficiency and emissions performance and is a topic worthy of separate investigation.
Conclusions and implications
This study is the most comprehensive systematic study to date of emission factors from domestic coal braziers in South Africa. The insights gained on the controlling variables go a long way to understanding the divergent results from prior studies that did not take into account or control for all these variables. We report emission factors regarding emissions per net MJ of energy in the fuel, for use in rating and comparison of stoves. The experimentally determined emission rates, in units (g/s), directly applicable in standard dispersion models, represent a considerable improvement in previously reported emission factors for coal stoves. These results have implications for stove designs, laying the groundwork for improvements in the design of existing coal braziers and development of novel low-emission combustion technologies, and understanding potential health impacts of condensed matter emissions.
Future improvements could explore additional factors, including the monitoring of organic carbon emissions that have the ability to influence the accuracy of the estimations of CO and CO2 emission factors. Additional factors also include varying the size of ventilation holes and the partitioning of ventilation openings below the grate (primary air) and above the grate or above the fuel load (secondary air), and the mean particle size of the fuel. We kept the fuel median size and size distribution constant at 20-40 mm throughout the course of this study.
There is a need to investigate further the effect of hole density pattern on ventilation rates by clustering primary air holes below the fuel grate and a limited number of secondary air holes above the level of the packed fuel bed. Results presented herein show that the performance of braziers could be improved by optimising the air supply through the packed fuel bed and to the space above the fuel bed (secondary air). An increase in the ventilation rate allows for more stable combustion and higher combustion temperatures, which in turn could lead to improved heat transfer. Increased ventilation could be achieved by using forced draft as in some wood pellet and biomass burning gasifiers. However, this alternative is not viable for brazier stoves as it may require design alterations to existing braziers, which is not an option for artisanally produced stoves. The target market for these stoves remains the low-income (energy poor) households situated in the Highveld region of South Africa.
In conclusion, PM and trace gas emissions from coal braziers could be optimised by modifying the ignition procedure, the design of the braziers regarding hole distribution and diameter, and the position of the grate in the brazier. Condensed matter particulate (smoke) emissions can be reduced by allowing for thorough mixing of the volatile gases from the fuel bed and the air supply, and by allowing a long residence time in the high-temperature zone. Thus, a brazier with high ventilation rates has the potential to reduce emissions of CO and PM. Future studies on the effect of ventilation rates on fixed-bed coal combustion systems should explore parameters such as the size of ventilation holes, the distribution pattern of the holes, and fuel size on particulate and trace gas emissions, as well as the impact of user behaviour on emission rates.
Acknowledgements
This work was supported financially by the University of Johannesburg through a URC/Faculty of Science grant to the SeTAR Centre, and in part from a grant from the Global Alliance for Clean Cookstoves (GACC) to the SeTAR Centre as a Regional Stove Testing and Development Centre. Part of the equipment and early stages of this work were funded by a grant from the South African National Energy Development Institute (SANEDI) for the project: ENV-0607-128 'Emissions testing from the BNM (Basa Njengo Magogo) reduced smoke fire lighting method'. We thank the German GTZ who provided substantial funding for the development of the SeTAR Laboratory through a legacy grant from the Basic Energy and Climate Change Adaptation Programme (BECCAP). T.M. thanks the Faculty of Engineering and the Built Environment for a Postdoctoral Research Fellowship grant. We thank Thokozile Sithole for assistance with the combustion experiments and Crispin Pemberton-Pigott for part analysis of the combustion data.
Authors' contributions
T.M. performed all the experiments, analysed the data, carried out quality control and assurance of the data and stove testing rig, wrote the first draft of the manuscript, and edited the manuscript according to the reviewers comments and suggestions by the editorial team. D.M.M. assisted with the experiments, including collecting stove data from the field, analysed field and experimental data and edited the manuscript. H.J.A. supervised the project, provided the finances, analysed the data in terms of QC/QA, and edited the manuscript for content, language and grammar. P.B.C.F. supervised the project, analysed the experimental data, performed QC/QA on the data, and edited the manuscript for content, language and grammar.
References
1. Titcombe ME, Simcik M. Personal and indoor exposure to PM25 and polycyclic aromatic hydrocarbons in the southern highlands of Tanzania. Environ Monit Assess. 2011;180(1-4):461-476. http://dx.doi.org/10.1007/s10661-010-1799-3 [ Links ]
2. Naeher LP Brauer M, Lipsett M, Zelikoff JT, Simpson CD, Koenig JQ, et al. Woodsmoke health effects: A review. Inhal Toxicol. 2007;19:67-106. http://dx.doi.org/10.1080/08958370600985875 [ Links ]
3. Englert N. Fine particles and human health: A review of epidemiological studies. Toxicol Lett. 2004;149(1-3):235-242. http://dx.doi.org/10.1016/j.toxlet.2003.12.035 [ Links ]
4. Barnes DF. Clean household and indoor air pollution. Washington DC: The World Bank; 2006. [ Links ]
5. Bruce N, Perez-Padilla R, Albalak R. Indoor air pollution in developing countries: A major environmental and public health challenge. Bull WHO. 2000;78:1078-1092. [ Links ]
6. Shen GF, Yang YF, Wang W, Tao S, Zhu C, Min Y et al. Emission factors of particulate matter and elemental carbon for crop residues and coals burned in typical household stoves in China. Environ Sci Technol. 2010;44(18):7157-7162. http://dx.doi.org/10.1021/es101313y [ Links ]
7. Gordon SB, Bruce NG, Grigg J, Hibberd PL, Kurmi OP Lam KH, et al. Respiratory risks from household air pollution in low and middle income countries. Lancet Resp Med. 2014;2(10):823-860. http://dx.doi.org/10.1016/S2213-2600(14)70168-7 [ Links ]
8. World Health Organization (WHO). The global health observatory data repository: Population using solid fuels (estimates) [database on the Internet]. c2014 [cited 2014 Sep 16]. [ Links ] Available from: http://apps.who.int/gho/data/node.main.135?lang=en,2014
9. Shen G, Xue M, Wei S, Chen Y Zhao Q, Li B, et al. Influence of fuel moisture, charge size, feeding rate and ventilation conditions on the emissions of PM, OC, EC, parent PAHs, and their derivatives from residential wood combustion. J Environ Sci. 2013;25(9):1808-1816. http://dx.doi.org/10.1016/S1001-0742(12)60258-7 [ Links ]
10. Uski O. Toxicological effects of fine particles from small-scale biomass combustion [PhD thesis]. Joensuu: University of Eastern Finland; 2014. [ Links ]
11. Makonese T, Forbes P Mudau L, Annegarn HJ. Monitoring of polycyclic aromatic hydrocarbon (PAH) emissions from real-world uses of domestic coal braziers. In: Proceedings of the Domestic Use of Energy (DUE) Conference; 2014 March 31 - April 02; Cape Town, South Africa. Cape Town: IEEE Conference Publications; 2014. p. 1-8. http://dx.doi.org/10.1109/DUE.2014.6827759 [ Links ]
12. Tissari J, Lyyränen J, Hytönen K, Sippulaa O, Tapperb U, Frey A, et al. Fine particle and gaseous emissions from normal and smouldering wood combustion in a conventional masonry heater. Atmos Environ. 2008;42:7862- 7873. http://dx.doi.org/10.1016/j.atmosenv.2008.07.019 [ Links ]
13. Bølling AK, Totlandsdal AI, Sallsten G, Braun A, Westerholm R, Bergvall C, et al. Wood smoke particles from different combustion phases induce similar pro-inflammatory effects in a co-culture of monocyte and pneumocyte cell lines. Part Fibre Toxicol. 2012;9:45. http://dx.doi.org/10.1186/1743-8977-9-45 [ Links ]
14. Chen YJ, Roden CA, Bond TC. Characterizing biofuel combustion with patterns of real-time emission data (PaRTED). Environ Sci Technol. 2012;46(11):6110-6117. http://dx.doi.org/10.1021/es3003348 [ Links ]
15. Jetter J, Zhao Y Smith KR, Khan B, Yelverton T, DeCarlo P et al. Pollutant emissions and energy efficiency under controlled conditions for household biomass cookstoves and implications for metrics useful in setting international test standards. Environ Sci Technol. 2012;46(19):10827-10834. http://dx.doi.org/10.1021/es301693f [ Links ]
16. Johnson M, Edwards R, Berrueta V Masera O. New approaches to performance testing of improved cookstoves. Environ Sci Technol. 2010;44:368-374. http://dx.doi.org/10.1021/es9013294 [ Links ]
17. Jetter J, Kariher P Solid-fuel household cook stoves: Characterisation of performance and emissions. Biomass Bioenerg. 2009;33:294-305. http://dx.doi.org/10.1016/j.biombioe.2008.05.014 [ Links ]
18. Makonese T, Annegarn HJ, Masekameni D, Forbes P. Influence of fuel-bed temperatures on CO and condensed matter emissions from packed-bed residential coal combustion. In: Proceedings of the Domestic Use of Energy (DUE) Conference; 2015 March 31 - April 02; Cape Town, South Africa. Cape Town: IEEE Conference Publications; 2015. p. 63-69. http://dx.doi.org/10.1109/DUE.2015.7102964 [ Links ]
19. Madubansi M, Shackleton CM. Changing energy profiles and consumption patterns following electrification in five rural villages, South Africa. Energ Policy. 2006;34(18):4081-4092. http://dx.doi.org/10.1016/j.enpol.2005.10.011 [ Links ]
20. Davis M. Rural household energy consumption: The effects of access to electricity - Evidence from South Africa. Energ Policy. 1998;26(3):207-217. http://dx.doi.org/10.1016/S0301-4215(97)00100-6 [ Links ]
21. Standish B, Leiman A, Boting A, Van Zyl H. Reducing the health care costs of urban air pollution: The South African experience. J Environ Manage. 2007;84:27-37. http://dx.doi.org/10.1016/j.jenvman.2006.05.010 [ Links ]
22. Makonese T. Protocols for thermal and emissions performance testing of domestic fuels and stoves [MSc thesis]. Johannesburg: University of Johannesburg; 2011. [ Links ]
23. Makonese T, Masekameni MD, Forbes P Annegarn HJ. Influence of fire-ignition methods and stove ventilation rates on gaseous and particle emissions from residential coal braziers. J Energy South Africa. 2015;26(4):16-28. [ Links ]
24. Wagner NJ, Schoonraad P Swanepoel P Van Niekerk A, Scholtz C, Kornelius G, et al. Results of domestic smoke reduction programmes at eMbalenhle (Mpumalanga) and Zamdela (Free State). In: Proceedings of the National Association for Clean Air (NACA) Annual Conference; 2005 September 29-30; Cape Town, South Africa. Vereeniging: NACA; 2005. p. 1-16. http://dx.doi.org/10.13140/2.1.2485.4725 [ Links ]
25. South African Council for Scientific and Industrial Research (CSIR). Laboratory controlled quantitative information about reduction in air pollution using the "Basa njengo Magogo" methodology and applicability to low-smoke fuels (revised). Report no. ENV-D 2005-004. Durban: Division of Water, Environment & Forestry Technology, CSIR; 2005. [ Links ]
26. Le Roux LJ, Zunckel M, McCormick S. Reduction in air pollution using the 'Basa njengo Magogo' method and the applicability to low-smoke fuels. J Energy South Afr. 2009;20(3):3-10. [ Links ]
27. Van Niekerk WCA, Britton MTS, Laurens JB. Laboratory technical tests - Determination of emission factors. Pretoria: Department of Minerals and Energy; 1997. [ Links ]
28. Scorgie Y Kneen MA, Annegarn HJ, Burger LW. Air pollution in the Vaal Triangle - Quantifying source contribution and identifying cost-effective solutions. Clean Air J. 2003;13(2):5-18. [ Links ]
29. Wei W, Zhang W, Hu D, Ou L, Tong Y Shen G, et al. Emissions of carbon monoxide and carbon dioxide from uncompressed and pelletized biomass fuel burning in typical household stoves in China. Atmos Environ. 2012;56:136-142. http://dx.doi.org/10.1016/j.atmosenv.2012.03.060 [ Links ]
30. Kimemia DK, Annegarn HJ, Robinson J, Pemberton-Pigott C, Molapo V Optimising the imbaula stove. Paper presented at: The Domestic Energy Use (DUE) Conference; 2011 April 04; Cape Town, South Africa. [ Links ]
31. Ahuja DR, Veena J, Smith KR, Venkataraman C. Thermal performance and emission characteristics of unvented biomass-burning cook-stoves: A proposed standard method for evaluation. Biomass. 1987;12:247-270. http://dx.doi.org/10.1016/0144-4565(87)90039-4 [ Links ]
32. Bhattacharya SC, Albina DO, Salam PA. Emission factors of wood and charcoal-fired cookstoves. Biomass Bioenerg. 2002;23:453-469. http://dx.doi.org/10.1016/S0961-9534(02)00072-7 [ Links ]
33. Zhang J, Smith KR, Uma R, Ma Y Kishore WN, Lata K, et al. Carbon monoxide from cookstoves in developing countries 1: Emission factors. Chemosphere. 1999;1:353-366. http://dx.doi.org/10.1016/S1465-9972(99)00004-5 [ Links ]
34. Masekameni D, Makonese T, Masekameni D, Forbes P, Annegarn HJ. A comparison of emissions and thermal efficiency of three improved liquid fuel stoves. In: Proceedings of the Domestic Use of Energy (DUE) Conference; 2015 March 31 - April 02; Cape Town, South Africa. Cape Town: IEEE Conference Publications; 2015. p. 71-76. http://dx.doi.org/10.1109/DUE.2015.7102965 [ Links ]
35. Language B, Piketh SJ, Burger RP. Correcting respirable photometric particulate measurements using a gravimetric sampling method. Clean Air J. 2016;26(1):10-15. http://dx.doi.org/10.17159/2410-972X/2016/v26n1a7 [ Links ]
36. Kimemia D, Makonese T, Annegarn HJ. Comparative evaluation of emissions from selected paraffin lamps and a paraffin thermoelectric generator. In: Proceedings of the Domestic Use of Energy (DUE) Conference; 2015 March 31 - April 02; Cape Town, South Africa. Cape Town: IEEE Conference Publications; 2015. p. 57-62. http://dx.doi.org/10.1109/DUE.2015.7102963 [ Links ]
37. Liu GZ, Swor TA, Schauer JJ, Debilzen JA, Severance CL. A source dilution sampling system for characterization of engine emissions under transient or steady-state operation. Aerosol Sci Tech. 2008;42:270-280. http://dx.doi.org/10.1080/02786820801992907 [ Links ]
 Correspondence:
Tafadzwa Makonese
taffywandi@gmail.com
Received: 23 June 2016
Revised: 01 Oct. 2016
Accepted: 14 Oct. 2016
FUNDING: University of Johannesburg; Global Alliance for Clean Cookstoves; South African National Energy Development Institute (SANEDI); GTZ

