


Servicios Personalizados
Articulo
 Inglés (pdf)
 Articulo en XML
 Referencias del artículo
Indicadores

Links relacionados
-
 Citado por Google
 -
 Similares en Google
Compartir

 Permalink
South African Journal of Science
versión On-line ISSN 1996-7489
versión impresa ISSN 0038-2353
S. Afr. j. sci. vol.113 no.3-4 Pretoria mar./abr. 2017
http://dx.doi.org/10.17159/sajs.2017/20160190
RESEARCH ARTICLE
The enduring and spatial nature of the enterprise richness of South African towns
Daan F. Toerien
Centre for Environmental Management, University of the Free State, Bloemfontein, South Africa
ABSTRACT
Enterprise richness (measured by the number of enterprise types) showed a statistically significant log-log relationship (or power law) with the total number of enterprises in (1) towns in different regions of South Africa and (2) towns in the same region but seven decades apart. Entrepreneurial space in towns develops or disappears in a regular way as towns grow or regress, which is further proof of orderliness in the enterprise dynamics of South African towns. The power laws are very similar to one another, which was powerfully illustrated by the fact that one relationship extracted from seven-decade-old information could accurately predict the enterprise richness of modern towns in South Africa. The enterprise richness power law of towns in South Africa extends over space and time. Recent reviews of research on small towns and local economic development in South Africa have ignored the orderliness detected in their enterprise structures. Islands have provided laboratories for the study of natural evolution and the MacArthur-Wilson Species Equilibrium Model based on island biogeography was a main contributor to progress in ecology. Research on regional economic geography in South Africa should move beyond the merely descriptive/narrative to more quantified research. In considering the lack of employment and poverty in South Africa, the National Development Plan suggests that towns and rural areas are important cogs in efforts to overcome these problems. Development plans that are out of sync with the observed regularities are perhaps bound to fail.
SIGNIFICANCE:
• Prediction of enterprise composition and dynamics in South African towns.
Keywords: entrepreneurial spaces; enterprise dynamics; enterprise ecology; regional economics; business evolution
Introduction
There are similarities between economic wealth and biological wealth because they are thermodynamically the same sort of phenomena. Beinhocker1 stated that both are systems of low entropy and patterns of order that have evolved over time under constraint of fitness functions. Like a living organism, each individual enterprise is in constant competition for survival and only the fittest survive. The similarities between living organisms and enterprises offer the opportunity to apply lessons from natural ecology to the study of enterprise dynamics. For instance, South African towns have been likened to enterprise ecosystems2 or to 'islands in a sea of farms'3.
Most people would intuitively accept that larger towns have a higher abundance of different types of enterprises than smaller towns. If so, can the phenomenon be quantified and predicted? These questions led to a study of a group of 134 South African towns.4 It was found that the abundance of enterprise types is a function of the total enterprise numbers of the towns and follows a power law with an exponent of 0.7164. (Ball5 remarked that there is no hidden Hobbesian significance in the word 'power' - it is just a mathematical term. The term power law is used as a mathematical term in this contribution.) Therefore, for every doubling of the number of enterprises in a town, the abundance of enterprise types will increase by 71.6%. The power law confers quantitative predictability - a utility recently employed to predict impacts of potential shale gas exploitation on the enterprise structures of Karoo towns.6
The term enterprise richness was proposed to describe the abundance of enterprise types in towns4. It is analogous to the term species richness used in natural ecology, which is a measure of the variety of species, i.e. the number of species, in a given area or in a given sample.7 Species richness is a component of the MacArthur-Wilson Species Equilibrium Model, which marked 'the coming of age of ecological science as a discipline with a theoretical/ conceptual base'8. Simply put, this model proposed that the rate at which new species immigrate to an island is balanced by the rate at which species are eliminated from the island, hence a species equilibrium is reached. By the same token, one could postulate that if towns were 'islands in a sea of farms'3, the rate by which new enterprise types appear in the business structure of a town should be balanced by the rate at which existing enterprise types disappear from the business structure of the town, resulting in an equilibrium of enterprise types, i.e. an enterprise richness equilibrium. Results obtained so far4 seem to support this contention.
Further investigation of enterprise richness as a potentially useful component of attempts to improve the quantitative understanding of enterprise dynamics in South African towns, raised three questions: (1) Is it important to study the enterprise dynamics of South African towns? (2) Are there differences in the enterprise richness-total enterprises relationships of different regions of South Africa? (3) Does the enterprise richness-total enterprises relationship change over time?
Purpose of this study
The prime purpose of this study was to address the three questions outlined above by (1) overviewing research on small towns in South Africa, (2) examining the enterprise richness power laws of three South African regions - the Free State9, the Karoo6 and the Gouritz Cluster Biosphere Reserve (GCBR)10 - and (3) testing the durability of the enterprise richness power law of a single region (the Free State) in two different periods seen decades apart. More context - which sheds additional light on the possibility that an enterprise richness equilibrium model might be attainable - is provided before the analyses are presented.
Research on small towns in South Africa
The National Planning Commission11 noted that, at present, most South Africans live in a complex network of towns and cities, which generates about 85% of all economic activity. A review of recent themes in the investigation of small towns in South Africa argued that a narrow set of issues, mainly concerning economic expansion and change, have formed the key vantage point from which to view small town South Africa.12 Depopulation and small town decline13 and migration of individuals and households to places that are better able to provide livelihoods14 set the scene against which the National Development Plan 203011 considers towns and rural areas important cogs in the planning of a better future for South Africans.
South African small town research has been limited in scope and scale.12 It has for the most part been region specific and place specific, done by a limited number of researchers and with a glaring absence of contributions from parts of the country where a large number of small towns are located. The economic restructuring of rural South Africa in the light of changes in agriculture and closure of mines resulted in the majority of investigations being concerned with overviews and analyses of locally driven strategies for economic development. The restructuring of the South African economy in general, and the rural economy in particular, to a more post-productive landscape, intensified research on small towns and their hinterlands.15
Many small town investigations have been framed as single case studies, often with a focus on issues such as job creation through small, micro and medium enterprises (SMMEs), Public Works programmes and tourism development.12 Local economic development (LED) provided a strategic vantage point from which to analyse small towns.12,16 For instance, developmental LED policies and practices12,16, infrastructure development17, the development of small town tourism18, and the impact of the changing fortunes of the mining sector received attention. Yet results were disappointing. Boom and bust cycles of mining resulted in many settlements being shadows of their former economic selves.12
Surprisingly, recent reviews of South African towns12,16 did not pay much attention to quantitative research that revealed a strong orderliness in and predictability about the enterprise dynamics of these towns2-4,9,10,19-24. The latter studies have led to conclusions that challenge some long-held tenets about LED and job creation.19,20 The former reviews and much of the research on which they are based have mostly been descriptive or narrative in nature. The understanding of what drives small towns in South Africa lacks the type of quantitative contribution that the MacArthur-Wilson Species Equilibrium Model has made to natural ecology.18 A better understanding and control of the dynamics of small town growth and decline requires more holistic and quantitative and less descriptive/narrative research.
The aforementioned studies of the orderliness (regularities or proportionalities) in enterprise development and dynamics in towns moved in this direction. The regularities (proportionalities) have been detected as statistically significant correlations between entrepreneurial (e.g. total number of enterprises in towns or number of enterprises in certain business sectors in towns), economic (e.g. gross regional value added [GRVA], total regional personal income and regional employment) and demographic (e.g. town populations) characteristics in regional studies in South Africa. These regularities are expressions of an orderliness that prevails in enterprise development in South African towns. They indicate that in specific locations there are definitive limits to what can be attained and what not. The orderliness, therefore, confers quantitative predictive powers about enterprise development and dynamics of South African towns. Daniel Kahneman, a psychologist and economics Nobel laureate, lauded the predictive powers of simple algorithms, which according to him are often more accurate than the predictions of experts.25 An economic systems model that links these regularities has been proposed for South Africa.26 The present contribution enhances the understanding of the enterprise richness power law, adds predictive power, contributes to the information pool on which the model is based and could guide LED decision-making.
This discussion provides an affirmative answer to the first question: it is important to study the enterprise dynamics of South African towns.
Regional analysis
To answer the second question about the geographical spread of the power law requires comparison of different regions and information about the enterprise structures and dynamics of towns in those regions. National and regional information about enterprise structures is lacking in most countries. South Africa is probably the only country for which detailed enterprise structures and dynamics have been determined for different regions, i.e. towns in the Free State9, the Karoo6 and the GCBR10.
The Free State
In the 1830s, European farmers disillusioned with the British authorities departed from the Cape Colony in the Great Trek.27 Many settled in the sparsely inhabited area north of the Orange River on land traditionally occupied by African tribes. After the so-called Bloemfontein Convention in 1854 this area became the Republic of the Orange Free State, and later one of the adversaries in the South African War. Its rural areas were devastated during this war. The province is mostly a high plain centrally located in South Africa, and close on 130 000 km2 in area. Livestock and grain farming formed the mainstay of the economy until gold was discovered in the mid-1940s.28 A coal-to-oil plant and a new town, Sasolburg, followed in the 1950s. It has a rainfall gradient from the southwest to the northeast and in 2011 the population was 2.475 million. In 1910, when the Union of South Africa was formed, the Free State became the Orange Free State Province.27 Currently known as the Free State, it is one of the nine provinces of the 'New South Africa'.
Most towns in the Free State were founded between the 1830s and 191029 and grew around newly built churches ('church towns') and some were located on important connection routes (e.g. Bethlehem and Kroonstad). Some on the eastern border, e.g. Ficksburg and Lady Brand, were founded for security reasons following the Basuto War of 1867. The discovery of gold in the mid-1940s and subsequent development of mines in the western Free State resulted in the founding of some new towns (e.g. Welkom, the second largest settlement in the province, and Allanridge) and the rapid growth of some existing towns (e.g. Odendaalsrus, Virginia and Hennenman). Sasolburg was specially founded in 1954 in the northern Free State to house workers of Sasol, a new coal-to-oil factory. Over time it became the third largest settlement in the Free State.29
A 2012/2013 study of the enterprise structures of Free State towns entailed 77 towns and villages (hereafter referred to as towns) and the city of Bloemfontein.9 The ages of the towns and their geographical spread over the province differed widely. These data are used in this contribution and provide a strict test for the presence of a power law.
The Karoo
The Karoo is a vast arid region located in the centre of South Africa, comprising about 400 000 km2, i.e. about 40% of South Africa's land surface.30 It is a vast inland desert, with characteristic small, hardy, deciduous shrubs, low and variable rainfall (ranging from less than 100 mm per annum in the winter-rainfall west to 500 mm in the summerrainfall east), occasional spectacular thunderstorms, and about 60 towns typically located 60-80 km from one another.
Karoo towns were slowly established from the late 1700s and throughout the 1800s; many were originally 'church towns' that served surrounding farm communities.30 The Karoo economy was based on livestock, including cattle, goats and sheep. The region benefitted from the diamond and gold booms in the 1870s and 1880s, but because of drought, overgrazing, economic depression and the ravages of the South African War, a long-term economic decline began in the early 20th century. Recently, some Karoo towns have grown economically, while others have declined, showing a relatively uneven developmental profile.13
The Karoo is quite different from most of the Free State and, therefore, the enterprise structures of its towns would be useful in a comparison of regional enterprise richness power laws.
The Gouritz Cluster Biosphere Reserve
The GCBR is globally unique: it is the only area in the world where three recognised biodiversity hotspots - the Fynbos, Succulent Karoo and Maputaland-Pondoland-Albany - hotspots converge.10 It also includes three recognised UNESCO World Heritage sites: the Swartberg Complex, Boosmansbos Nature Reserve and the western portion of the Baviaanskloof. It is located in the southern Cape of South Africa and covers a large area from the coast across the Langeberg Mountains to the Little Karoo, and even partly across the Swartberg Mountains. It includes 16 towns, which vary markedly in size.10 Mossel Bay and Oudtshoorn are the two largest towns and Witsand, a small coastal town at the mouth of the Breede River, is the smallest. Several important routes cross the biosphere: the N2 and R62 from west to east, and the N9 and N12 (both national roads) from south to north. Route 62 is a well-known tourist route that passes through the Little Karoo.
The GCBR is also quite different from the Karoo and Free State and would also be useful in a comparison of regional enterprise richness power laws needed to answer the second question.
Time-based analysis of enterprise structures
To answer the third question about the durability of the power law, two sets of analyses of the same towns - but from different periods - were needed. The year 1946 was a special year in the history of the Free State.
It was just after the end of World War II and its impacts, and just before gold mining in the Free State commenced with consequential economic development.27 The donation of a telephone directory for 1946/1947 enabled an assessment of whether a power law relationship existed at that time between the enterprise richness and total enterprise numbers in Free State towns. This proved to be the case. Together with the analysis of Free State towns in 2012/20139, a comparison of enterprise richness power laws of the same region some seven decades apart was therefore possible, and which included a period of significant economic development in the Free State. This comparison would answer the third question.
Methods and results
Regional durability
Enterprise dynamics in Free State towns in 2012/2013
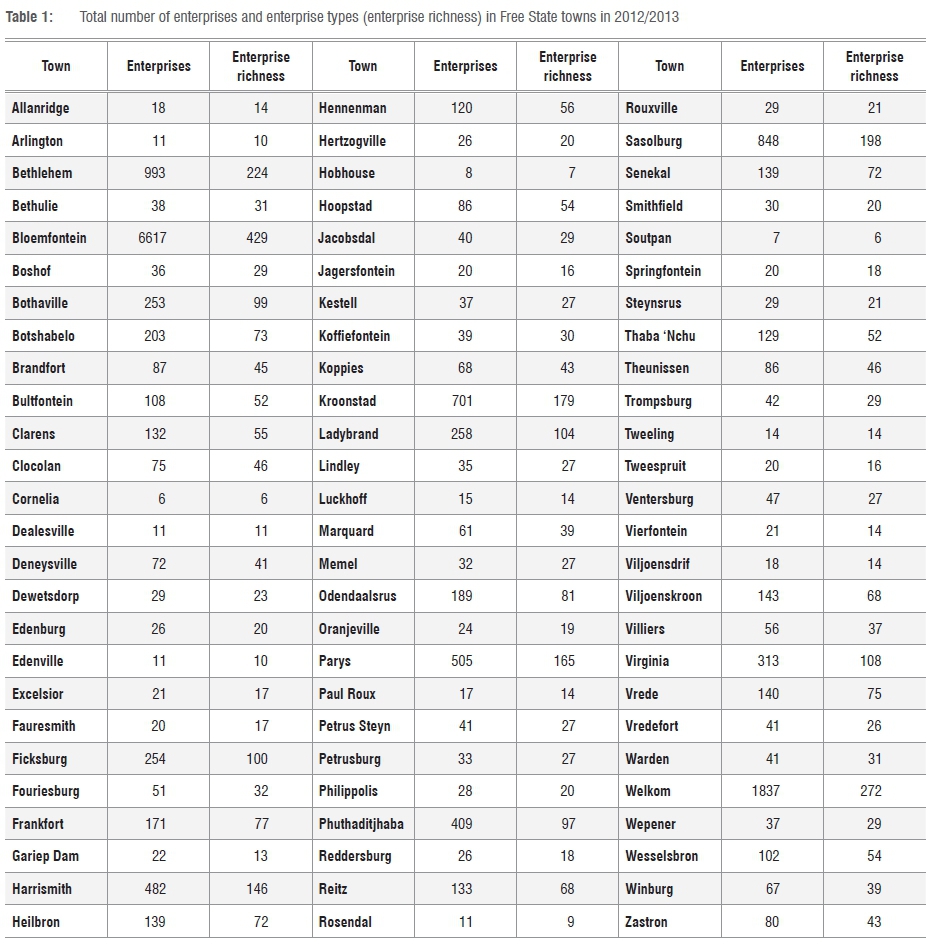
A first regional analysis involved data for 2012/2013 of 77 Free State towns (Table 1) as well as the provincial capital Bloemfontein (a metropolitan area). The data set formed part of an earlier study of the enterprise dynamics of Free State towns.9
The enterprises of each town were identified from the 2012/2013 Free State telephone31 directory by previously described methods23,19. The type of each of the 17 184 enterprises recorded in the 78 settlements was identified from a list (at the time of writing of this document) of more than 670 enterprise types encountered in South African towns. The total number of enterprise types in each town represents its enterprise richness (Table 1).
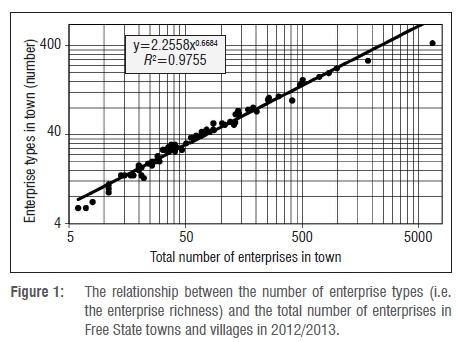
The total enterprises to enterprise richness ratio of the Free State towns in 2012/2013 varied from 6:6 for Cornelia to 6617:429 for Bloemfontein (Table 1), thus covering a wide range of ratios. The enterprise richness in 2012/2013 of Free State towns exhibited a statistically significant (p<0.01) log-log (i.e. power law) relationship with total enterprise numbers (Figure 1). Just over 97% of the variance was explained by the power law which extended over a range from 6 to more than 6600 enterprises per settlement (Table 1). This result supports recent findings about the enterprise richness of South African towns.4
Enterprise dynamics in Karoo towns
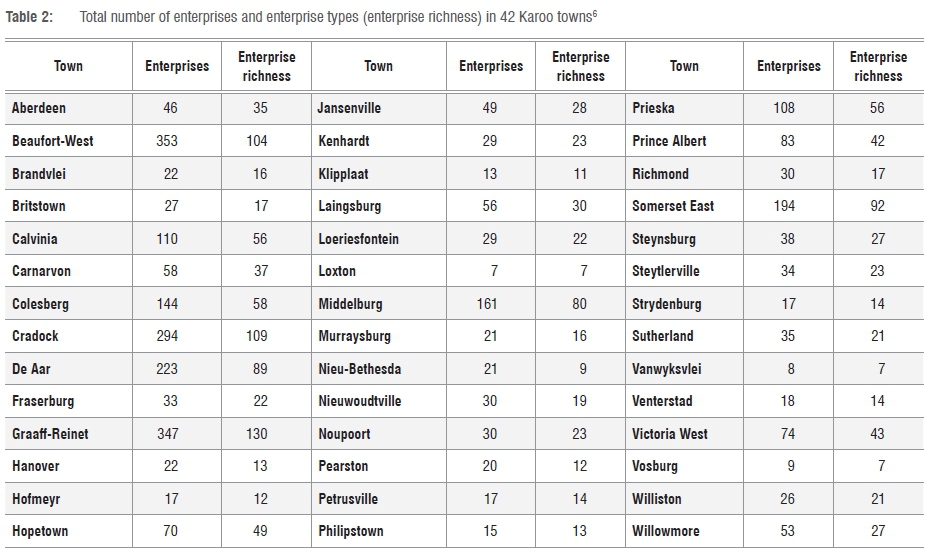
The Karoo is subject to a number of development and research initiatives, which include construction of the Square Kilometre Array (SKA) observatory, various solar power installations, power lines and potential shale gas production.6 The dynamics of the enterprise richness of Karoo towns, i.e. whether they grow or regress, are therefore of interest. An earlier examination of the enterprise richness in 2014-2016 of 42 Karoo towns (Table 2) reported a statistically highly significant (p<0.01) power law relationship:

with r=0.98 and n=42, and where x is the total number of enterprises in the town.12 This was the first indication that the enterprise richness of towns in the semi-arid to arid Karoo region of South Africa is a statistically significant (p<0.01) power law function of the total enterprises of the towns of the region.
The ratios of total enterprises to enterprise richness of the Karoo towns varied from 7:7 for Loxton to 353:104 for Beaufort West (Table 2). The power law relationship was, therefore, determined over a wide range of town sizes and was used in 'what-if' analyses of potential economic and entrepreneurial impacts of shale gas production on Karoo towns.6
Enterprise dynamics in 2013/2014 of towns of the GCBR
The GCBR is the only biosphere reserve in South Africa of which the enterprise structures of its towns have been analysed.10 There are 16 towns of varying sizes in the GCBR (Table 3). Their total enterprises to enterprise richness ratios varied from 61:11 for Witsand to 1949:276 for Mossel Bay.

Enterprise richness in 2013/2014 of GCBR towns was also a statistically significant (p<0.01) power law function of the total enterprise numbers:

with r=0.93 and n =16, and where x is the total number of enterprises in the town.
Almost 87% of the variance was explained by the power law which was estimated over a wide range of town sizes: 61 enterprises in Uniondale and Witsand to almost 1950 enterprises in Mossel Bay (Table 3 and Equation 2). The findings also support recent results about the enterprise richness of South African towns.4
The combined results of the three regional analyses demonstrate that power laws between enterprise richness and total enterprise numbers are not only characteristic of South African towns in general, or of groups of towns with similar enterprise structures, but also of regions in South Africa. This finding provided an answer to the second question.
The enduring nature of the enterprise richness of towns in South Africa
Two approaches were used to examine the enduring nature of the enterprise richness-total enterprises relationship: (1) using data obtained from a 1946/1947 telephone directory to determine if a power law also described the relationship at that time and then to compare the power laws of 1946/1947 and 2012/2013 and (2) using the 1946/1947 power law to predict the current enterprise richness of towns in the Free State, the Karoo and the GCBR.
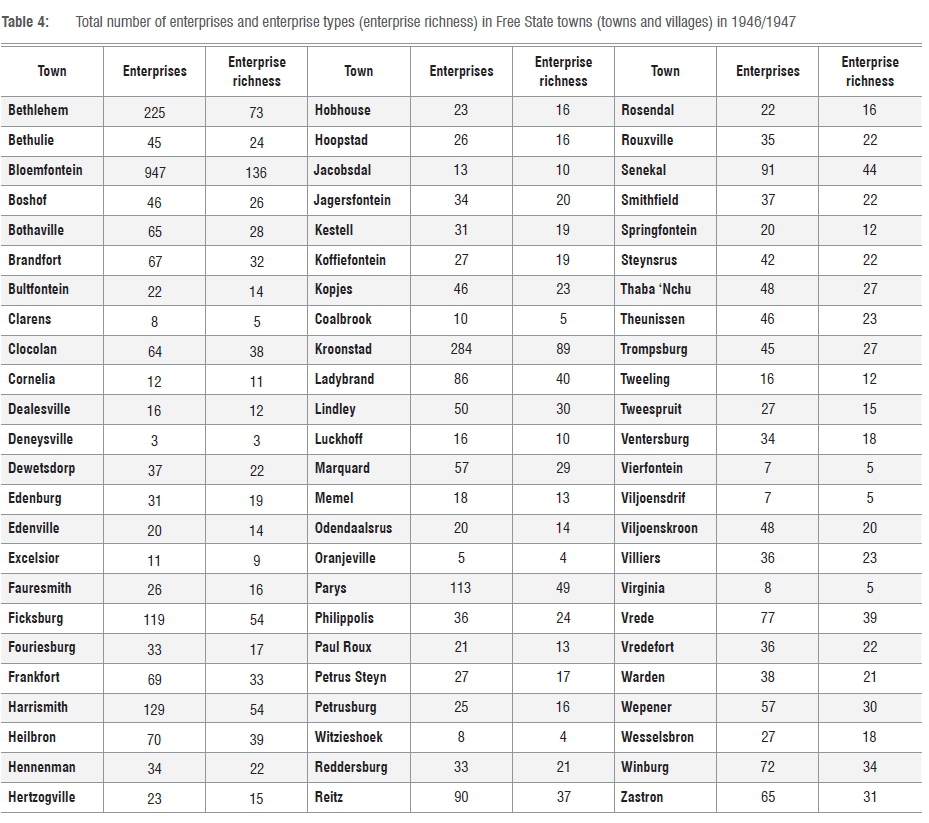
For 1946/1947, 72 towns in the Free State, including the provincial capital Bloemfontein, were considered (Table 4). A list of all enterprises in each of the towns was prepared from a telephone directory for 1946/1947.32 For provinces (including the Free State) other than the Cape Province, the directory contains a list of all trades (i.e. enterprises) for each town. The enterprise type of each of the 4177 enterprises listed in the 72 towns was identified from a list of more than 670 enterprise types encountered in South African towns. The number of enterprise types in each town represents its enterprise richness (Table 4).
The total enterprises to enterprise richness ratio of the Free State towns in 1946/1947 varied from 3:3 for Deneysville to 947:136 for Bloemfontein (Table 4). In the seven decades after 1946, the total number of enterprises in Free State towns had grown approximately fourfold, in part reflecting the stimulation of entrepreneurship by the development of the Free State goldmines and the coal-to-oil industry located in Sasolburg.9
The 1946/1947 enterprise richness of Free State towns was a statistically significant (p<0.01) power law function of their total enterprise numbers. Just over 96% of the variance was explained by the power law which extended over a range from 3 to close on 950 enterprises per town (Figure 2). Seven decades ago, entrepreneurial space in Free State towns increased or decreased similarly to modern times as town sizes respectively increased or decreased.

As the size of towns (measured by their total enterprise numbers) increases, enterprise types appear that have not been present before. However, there are also more enterprises of enterprise types already present in the town. Toerien and Seaman4 interpreted the power law in terms of how entrepreneurial space is created or destroyed as towns grow or regress. They distinguish between 'new entrepreneurs', who are those starting enterprises of enterprise types not yet present in towns, and 'existing entrepreneurs' who are those starting new enterprises of types already present in a town.
A graphic technique based on these considerations was developed to illustrate the roles of these two types of entrepreneurs in Karoo towns.6 The same technique is used here to examine the enduring nature of the enterprise type-total enterprise power law. Using the power laws for 1946/1947 and 2012/2013, the relative roles of new and existing entrepreneurs were plotted over a wide range of town sizes (measured in number of enterprises) (Figure 3). There is a remarkable similarity in the definition of the entrepreneurial spaces in towns in the Free State seven decades apart. The way in which entrepreneurial space increased or decreased as towns respectively grew or regressed did not change much over seven decades.

New entrepreneurs are more important in small towns (with fewer than 60 to 100 enterprises) than are existing entrepreneurs (Figure 4). Small towns are expected to contribute to the growth of employment in South Africa. This expectation is clearly a huge challenge given that there are limitations in human capital and that the new entrepreneurs have to identify opportunities that are not obvious and cannot use 'me too' strategies. As towns grow, the importance of new entrepreneurs reduces: at approximately 60 to 100 enterprises the new to existing entrepreneurs ratio is 50:50 and thereafter the importance of existing entrepreneurs (and 'me too' strategies) increases, reaching about 80% at around 1800 enterprises. However, under all conditions, enterprise growth in Free State towns remains partly dependent on new entrepreneurs. For instance, this dependency is about 20% at 1800 or more enterprises per town. The graphic analysis is one illustration of the enduring nature of enterprise richness dynamics.

The durability of the enterprise richness-total enterprises power law can also be tested by examining the ability of the 1946/1947 power law to predict the enterprise richness of Free State towns in 2012/2013 (Figure 4), in Karoo towns (Figure 5), and in GCBR towns in 2013/2014 (Figure 6). The comparisons used town size ranges limited to the maximum size of Free State towns in 1946/1947 (i.e. 947 enterprises in Bloemfontein). In each case, the actual number of enterprises of a town was used with the 1946/1947 power law to predict the expected enterprise richness. Best-fit regression lines of actual and predicted enterprise richness were calculated using Microsoft Excel.
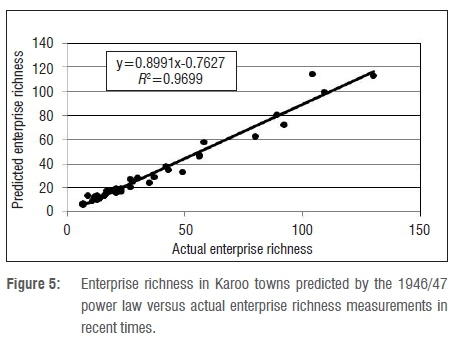

The expected enterprise richness was statistically significantly (p<0.01) predicted in every case (Figures 4, 5 and 6). Over seven decades, in different regions of the country and with vastly different socio-economic and political conditions in South Africa, the enterprise richness-total enterprises relationship has essentially stayed the same. This analysis answered the third question and provided a powerful demonstration of the universality of the enterprise richness power law in South Africa: entrepreneurial space develops or disappears in a regular way as towns grow or regress.
Discussion and conclusions
Empirical regularities in economics and finance often take the form of power laws.33 Power laws were also detected in this study, and led to several important conclusions. Firstly, the presence of power laws serves as further proof of the presence of regularities in the enterprise dynamics of South African towns. The recorded power laws are very similar to each other. In fact, so similar that a power law extracted from seven-decade-old information could accurately predict the modern enterprise richness of regional South African towns (Figures 4, 5 and 6). The universality of enterprise richness power laws in South Africa indicates that entrepreneurial space in towns develops or disappears in a regular way as towns grow or regress.
The observed power laws form part of a set of a number of regularities observed in the enterprise dynamics of South African towns.20,22-24 These regularities, not taken into account in recent reviews of South African towns12,16, define the 'playing field' of enterprise development in South African towns, and set the boundaries of what is possible in terms of enterprise development and what is not. For instance, this study provides quantified insight into and predictive power about the role of new and existing entrepreneurs in the growth and decline of South African towns - concepts that are apparently alien to current wisdom about LED in South Africa. Development plans that are out of sync with these realities, are bound to fail. Research and planning of local economic and enterprise development in South Africa should move beyond descriptive or narrative approaches to more quantitative approaches.
Since Darwin's time, islands have provided laboratories for the study of evolution, including examining changes following colonisation.34 Islands are ecological systems; and eventually the MacArthur-Wilson Species Equilibrium Model was developed as a fundamental basis of island biogeography.18 It was shown that the species equilibria of islands are functions of island size and distance from mainlands.
Beinhocker1 stressed the similarities between natural and economic systems. South African towns have been shown to be enterprise ecosystems2 and to exhibit 'island effects' in the way enterprises develop in their domains3. This study has added to these ideas and provides quantified evidence that specific ratios of new and existing enterprise types are associated with specific sizes of towns (when expressed as total enterprises). It is an intriguing possibility that, analogous to the Species Equilibrium Model of natural ecology, it might be possible to develop an enterprise richness equilibrium model for South African towns. This possibility should receive further research attention.
The National Development Plan 203011 considers how two central South African problems, namely a lack of employment and poverty, could be addressed. The National Planning Commission considers towns and rural areas to be important cogs in such efforts.11 The reshaping of South Africa's cities, towns and rural villages will be a complex and long-term project that requires major reforms, political will and differentiated planning responses in relation to varying town types.11 An important aspect of discussions about the growth or regression of towns and the creation or disappearance of employment opportunities is enterprise structures and dynamics as towns grow or regress. This study supplies quantified information that should be applied.
Finally, it is necessary to consider why the enterprise richness power laws have apparently first been detected in South Africa. A possible reason is that in most countries there is limited, if any, information available on the enterprise richness of local economies. For instance, the US Census Bureau presents information on the number of firms (enterprises) on a state, county, city or town basis35, but the type of each business is not recorded. In South Africa, the use of telephone directories to identify and enumerate enterprises in towns not only enabled their classification into 19 functional groups (e.g. enterprises involved in construction or trade services or tourism and hospitality services19-23) but also classification into more than 670 enterprise types.4 The resulting unique database offers a unique opportunity to study and apply the enterprise richness relationships of South African towns.
Acknowledgements
Belinda Gordon is thanked for the donation of the 1946/1947 telephone directory. Marie Toerien and Estelle Zeelie provided technical assistance.
References
1. Beinhocker E. The origin of wealth: Evolution complexity, and the radical remaking of economics. Boston: Harvard Business School Press; 2006. [ Links ]
2. Toerien DF, Seaman MT. The enterprise ecology of towns in the Karoo, South Africa. S Afr J Sci. 2010;106(5/6):24-33. http://dx.doi.org/10.4102/sajs.v106i5/6.182 [ Links ]
3. Toerien DF, Seaman MT. Evidence of island effects in South African enterprise ecosystems. In: Mahamane A, editor. The functioning of ecosystems. Rijeka: Intech; 2012. p. 229-248. http://dx.doi.org/10.5772/36641 [ Links ]
4. Toerien DF, Seaman MT. Enterprise richness as an important characteristic of South African towns. S Afr J Sci. 2014;110(11/12), Art. #2014-0018, 9 pages. http://dx.doi.org/10.1590/sajs.2014/20140018 [ Links ]
5. Ball P. Critial mass: How one thing leads to another. Random House: London; 2005. [ Links ]
6. Toerien DF. New utilization/conservation dilemmas in the Karoo, South Africa: Potential economic, demographic and entrepreneurial consequences. In: Ferguson G, editor. Arid and semi-arid environments: Biogeodiversity, impacts and environmental challenges. New York: Nova Science Publishers; 2015. [ Links ]
7. Spellerberg IF, Fedor PJ. A tribute to Claude Shannon (1916-2001) and a plea for more rigorous use of species richness, species diversity and the 'Shannon-Wiener' Index. Glob Ecol Biogeogr. 2003;12:177-179. http://dx.doi.org/10.1046/j.1466-822X.2003.00015.x [ Links ]
8. May RM. Foreword. In: Losos JB, Ricklets ER, editors. The theory of island biogeography revisited. New Jersey: Princeton University Press; 2010. p. vii-ix. [ Links ]
9. Toerien DF. The enterprise architecture of Free State towns. Technical report 2014. http://dx.doi.org/10.13140/2.1.1902.7521 [ Links ]
10. Toerien DF. Enterprise profiles and dynamics in a South African biosphere reserve. Technical report 2016. http://dx.doi.org/10.13140/RG.2.1.1434.4083 [ Links ]
11. South African National Planning Commission (NPC). Our future - make it work. National Development Plan 2030. Pretoria: NPC; 2011. [ Links ]
12. Hoogendoorn G, Visser G. South Africa's small towns: A review on recent research. Local Econ. 2016;31:95-108. http://dx.doi.org/10.1177/0269094215618865 [ Links ]
13. Nel E, Hill T, Taylor B, Atkinson D. Demographic and economic changes in small towns in South Africa's Karoo: Looking from the inside out. Urban Forum. 2011;22:395-410. http://dx.doi.org/10.1007/s12132-011-9131-z [ Links ]
14. Harrison P Todes A. Spatial transformations in a 'loosening state': South Africa in a comparative perspective. Geoforum. 2015;61:148-162. http://dx.doi.org/10.1016/j.geoforum.2015.03.003 [ Links ]
15. Hoogendoorn G, Nel E. Exploring small town development dynamics in rural South Africa's post-productivist landscapes. In: Donaldson R, Marais L, editors. Small town geographies in Africa: Experiences from South Africa and elsewhere. New York: Nova Science Publishers; 2012. p. 21-34. [ Links ]
16. Rogerson CM, Nel E. The contested trajectory of applied local economic development in South Africa. Local Econ. 2016;31:109-123. http://dx.doi.org/10.1177/0269094215623729 [ Links ]
17. Rogerson CM. Reframing place-based economic development in South Africa: The example of local economic development. Bull Geogr Socio-Econ Ser. 2014;24:203-218. http://dx.doi.org/10.2478/bog-2014-0023 [ Links ]
18. Schoener TW. The MacArthur-Wilson Equilibrium Model: A chronicle of what it said and how it was tested. In: Losos JB, Ricklets ER, editors. The theory of island biogeography revisited. New Jersey: Princeton University Press; 2010. p. 52-87. [ Links ]
19. Toerien DF, Seaman MT. Ecology, water and enterprise development in selected rural South African towns. Water SA. 2011;37(1):47-56. http://dx.doi.org/10.4314/wsa.v37i1.64106 [ Links ]
20. Toerien DF, Seaman MT. Proportionality in enterprise development of South African towns. S Afr J Sci. 2012;108(5/6):38-17. http://dx.doi.org/10.4102/sajs.v108i5/6.588 [ Links ]
21. Toerien DF, Seaman MT. Regional order in the enterprise structures of selected Eastern Cape Karoo towns. S Afr Geogr J. 2012;94(2):1-15. http://dx.doi.org/10.1080/03736245.2012.742782 [ Links ]
22. Toerien DF. Enterprise proportionalities in the tourism sector of South African towns. In: Kasimoglu M, editor. Visions of global tourism industry: Creating and sustaining competitive strategies. Rijeka: Intech; 2012. p. 113-138. http://dx.doi.org/10.5772/37319 [ Links ]
23. Toerien DF. 'n Eeu van orde in sakeondernemings in dorpe van die Oos-Kaapse Karoo [A century of order in businesses in towns of the Eastern Cape Karoo]. LitNet Akad. 2014;11(1):330-371. Afrikaans. [ Links ]
24. Toerien DF. Economic value addition, employment, and enterprise profiles of local authorities in the Free State, South Africa. Cogent Soc Sci. 2015;1(1), Art. #1054610, 21 pages. http://dx.doi.org/10.1080/23311886.2015.1054610 [ Links ]
25. Kahneman D. Thinking, fast and slow. Kindle ed. London: Penguin; 2013. [ Links ]
26. Toerien DF, Seaman MT. Paradoxes, the tyranny of structures and enterprise development in South African towns. Paper presented at: Strategies to overcome poverty and inequality: Towards Carnegie3; 2012 September 3-7; Cape Town, South Africa. Available from: http://carnegie3.org.za/docs/papers/269_Toerien_Paradoxes,%20the%20tyranny%20of% 20structures%20and%20enterprise%20development%20in%20SA%20towns.pdf [ Links ]
27. Giliomee H, Mbenga B. New history of South Africa. Cape Town: Tafelberg; 2007. [ Links ]
28. Free State Provincial Government. Free State Growth and Development Strategy: Free State vision 2030 - the future we want. Bloemfontein: Free State Provincial Government; 2013. [ Links ]
29. Erasmus BPJ. Op pad in Suid-Afrika [On the road in South Africa]. Johannesburg: Jonathan Ball; 1995. Afrikaans. [ Links ]
30. Atkinson D. Is South Africa's Great Karoo region becoming a tourism destination? J Arid Environ. 2016;127:199-210. http://dx.doi.org/10.1016/j.jaridenv.2015.12.006 [ Links ]
31. Free State 2012/2013 telephone directory. Johannesburg: Trudon; 2012. [ Links ]
32. Cape Times Ltd. South African directory 1946-47. Cape Town: Cape Times Ltd.; 1946. [ Links ]
33. Gabaix X. Power laws in economics and finance. Annu Rev Econ. 2009;1:255-293. http://dx.doi.org/10.1146/annurev.economics.050708.142940 [ Links ]
34. Losos JB, Ricklefs RE. Foreword. In: Losos JB, Ricklefs RE, editors. The theory of island biogeography revisited. Princeton, NJ: Princeton University Press; 2010. p. xi-xiv. [ Links ]
35. United States Census Bureau. Quick facts: United States [database on the Internet]. No date [cited 2016 Aug 30]. [ Links ] Available from: https://www.census.gov/quickfacts/table/PST045215/00
 Correspondence:
Daan Toerien
dtoerien@gonet.co.za
Received: 27 June 2016
Revised: 06 Sep. 2016
Accepted: 25 Sep. 2016
FUNDING: None

