


Services on Demand
Article
 English (pdf)
 Article in xml format
 Article references
Indicators

Related links
-
 Cited by Google
 -
 Similars in Google
Share

 Permalink
South African Journal of Science
On-line version ISSN 1996-7489
Print version ISSN 0038-2353
S. Afr. j. sci. vol.113 n.1-2 Pretoria Jan./Feb. 2017
http://dx.doi.org/10.17159/sajs.2017/20160141
RESEARCH ARTICLE
Soil fertility constraints and yield gaps of irrigation wheat in South Africa
Nondumiso Z. SosiboI, II; Pardon MuchaonyerwaII; Lientjie VisserI; Annelie BarnardI; Ernest DubeI; Toi J. TsiloI, III
IAgricultural Research Council -Small Grain Institute, Bethlehem, South Africa
IISoil Science, School of Agricultural, Earth and Environmental Sciences, University of KwaZulu-Natal, Pietermaritzburg, South Africa
IIILife and Consumer Sciences, University of South Africa, Pretoria, South Africa
ABSTRACT
South Africa currently faces a wheat (Triticum aestivum L.) crisis as production has declined significantly over the past few years. The objective of this study was to explore opportunities for improving yields in intensive irrigated wheat production systems of South Africa through analyses of yield gaps, soil fertility constraints and conservation agriculture practices. The study was conducted in the major irrigation wheat production areas across four geographical regions: KwaZulu-Natal, eastern Highveld, warmer northern and cooler central. Actual yield (Ya) based on long-term yield data ranged from 5.99±0.15 t/ha to 8.32±0.10 t/ha across different geographical regions. The yield potential (Yp) ranged from 7.57 t/ha to 11.45 t/ha. Yield gaps (Yp-Ya) were in the range of 1.58-3.13 t/ha. Yields could be increased by 26-38% through closing yield gaps. On 88.37% and 13.89% of the fields in the KwaZulu-Natal and warmer northern regions, respectively, there was strong evidence of the practise of conservation agriculture, but none in the other regions. On 42.31% of irrigated wheat fields, soil organic carbon was below 1% at a soil depth of 0-20 cm. Fields in which conservation tillage was practised had double the soil organic carbon of conventionally tilled fields (2.15±0.10% versus 1.02±0.05%), but greater acidity and phosphorus deficiency problems. Sustainable approaches for addressing phosphorus deficiency and acidity under conservation tillage practices need to be sought, especially in the KwaZulu-Natal region.
SIGNIFICANCE:
• Opportunities for improving wheat yields in South Africa need to be explored to address the wheat crisis.
• Sustainable approaches for addressing phosphorus deficiency and acidity of soil under conservation tillage practices need to be sought, especially in the KwaZulu-Natal region.
Keywords: tillage; wheat yield potential; yield gap analysis; conservation agriculture
Introduction
South Africa's wheat (Triticum aestivum L.) production has declined progressively from 2.5 million tonnes, produced on 974 000 ha in 2002, to approximately 1.7 million tonnes, produced on 500 000 ha in 2013.1 The country is therefore increasingly reliant on imports of wheat to sustain domestic demand. A decline in land area under wheat suggests producer disinterest in wheat production in South Africa, because of the low profitability of the crop.2,3 Much of the wheat production area is being lost to other economically important crops such as maize (Zea mays L.) and soybean (Glycine max L.) as the country has limited land and water resources for expansion of the crop production area. Therefore, in search of solutions for increasing wheat production, the focus has not only been on how to return some land area to wheat, but also on how to immediately and realistically improve yields on current production lands.
Irrigation is an effective tool for increasing yield potential on cropped lands in South Africa; currently, irrigation wheat covers approximately 21% of the total wheat production area, but produces 41% of the crop.1 The irrigation wheat area in South Africa is divided into four main geographical regions: (1) the cooler central irrigation region in the Free State and Northern Cape Provinces, (2) the warmer northern irrigation region in the North West, Limpopo and Gauteng Provinces, (3) the Highveld region in Mpumalanga and the Free State and (4) the KwaZulu-Natal region. The yield potential of irrigation wheat in South Africa is increasing progressively because of improvements in the genetic yield potential of cultivars, pest and disease resistance as well as technological advancements that enable producers to improve crop management.4 Hence, in recent years, researchers and industry agronomists conducting cultivar trials in South Africa have documented potential yields of up to 12 t/ha under controlled field experiments.5 When these yields are compared with the national average yield of approximately 6 t/ha, it appears that there may be opportunity for improving wheat yield in some production areas of South Africa through refinements of crop and resource management strategies.
Yield gaps refer to the difference between attainable yields and actual yields, and are caused by poor crop management practices.6,7 Therefore, yield gap analysis could be an effective policy framing device for addressing the yield challenge in the ailing South African wheat sector. According to Armour et al.8, the environmental and management circumstances that enable the production of a 15 t/ha wheat crop are a combination of cultivar and sowing date that lead to grain growing through the solar radiation peak, cool but sunny grain filling conditions and, most importantly, attention to agronomic detail so that no growth constraints occur.
Nutrient demand and removal inevitably increases as producers intensify crop production and target higher yields, which suggests that it is critical for producers to refine soil fertility management practices in improving yield, production efficiency and profitability. Poor nutrient management appears as the most frequently reported yield limiting factor in intensive crop production systems.9-13 A policy document of the Food and Agriculture Organization of the United Nations on constraints to food production across the world identified high nutrient removal in irrigation crop production as a major cause of deterioration in soil fertility in developing countries.14 As a result, application rates of inorganic fertilisers have increased, in order to meet the increased nutrient demands. These high rates of inorganic fertiliser may negatively affect soil properties such as soil pH and organic carbon, resulting in reduced soil fertility and productivity. Meanwhile, there is no record of studies carried out to determine the extent to which poor soil fertility constrains the production capacity of irrigation wheat producers in South Africa. Hence, research and development projects aimed at resuscitating the wheat sector may not be aligned well to farmer priorities.
Soil organic matter is important for improving soil fertility, crop yields and the efficient cycling of nutrients within the system. Soil organic carbon (SOC) content is commonly used as an index of soil organic matter, and sandy soils with less than 1% SOC are prone to structural destabilisation and crop yield reduction.15 At such SOC levels, it may not be possible to obtain the potential wheat yields, irrespective of soil type.16 There is agreement in the current literature about the proposition that conservation agriculture (CA) is a sustainable way of managing SOC in such a way that soil structure and fertility is well sustained for the future. The three principles of CA are no-tillage or conservation tillage, crop rotation and a permanent crop residue cover.17 The need to manage fertiliser efficiently for the success of CA has been recently proposed as a fourth principle.18 The adoption of CA in Africa is reported as slow, as highlighted in the case of resource poor smallholder producers.17,19 There is a general preference to use crop residues as fodder and not as soil cover during winter.19
Intensive irrigation systems combining winter wheat and a summer crop (usually maize or soybean), whereby producer's harvest eight or more crops in the course of 5 years are common in South Africa. Winter wheat production provides an opportunity for maximising the benefits of CA through provision of continuous soil cover in such systems. The objective of the current study was to explore opportunities to improve wheat yields in the intensive irrigation systems of South Africa through analyses of yield gaps, soil fertility constraints and CA practices.
Materials and method
Description of study sites
The study covered the major irrigation wheat production regions of South Africa which are the cooler central, warmer northern, eastern Highveld and KwaZulu-Natal regions as shown in Figure 1. Wheat producers within each of these geographical regions have broadly similar resource bases, enterprise patterns and constraints. The cooler central region is arid, with average annual temperatures ranging from 15 °C to 31 °C and predominantly deep, loamy oxidic soils20 which are ideal for irrigation; average rainfall varies between 200 mm and 715 mm annually. In the warmer northern irrigation region, the climate is semi-arid, with average monthly temperatures ranging between 18 °C and 32 °C; the average annual rainfall varies between 200 mm and 600 mm and the region has oxidic soils. The Highveld region has a semi-arid climate and receives an average rainfall of 200 mm to 500 mm annually; mean monthly temperatures range between 14 °C and 26 °C and the area is dominated by plinthic soils. Irrigation wheat in KwaZulu-Natal is mostly produced around Bergville and Winterton (Figure 1), at high altitude areas with highly weathered and well-drained oxidic soils. The climate of KwaZulu-Natal is sub-humid and warm, with average temperatures ranging between 15 °C and 32 °C and average annual rainfall of 600-1000 mm.
Calculation of yield gaps
The Agricultural Research Council - Small Grain Institute (ARC-SGI) of South Africa conducts an annual National Wheat Cultivar Evaluation Programme (NWCEP) to evaluate and characterise all commercial wheat cultivars in the major production areas under farmers' cultivation practices. The NWCEP uses four to eight test locations for each geographical region annually. Test sites are systematically selected in such a way that they are representative of all the production conditions in the geographical region of interest.
A randomised complete block design is used for trial layout. All trials are planted inside wheat farmer's fields in line with the farmer's crop management practices with regard to tillage practices, seed rates, weed control, fertiliser application, irrigation scheduling, pest and disease control as well as planting date. Therefore, ARC-SGI has archives of reliable wheat yield data from production systems of South Africa. These data were useful for analysing yield gaps.
The NWCEP includes between 20 and 30 commercial wheat cultivars. Poorly performing cultivars are consistently replaced with newly released cultivars in the programme. Since its inception over three decades ago, nearly all experimental entries - except the yield and quality check cultivar called Buffels - have changed through the evaluation period. The grain yield data of Buffels provided a standard measure of farmer yields. Grain yield data of Buffels under the NWCEP are available from wheat production guidelines that were published annually by the ARC-SGI for the entire period (2009-2014) and online from the ARC. The yield gap (Yg) is the difference between yield potential (Yp) and actual yield (Ya), i.e. Yg=Yp-Ya. Data from on-farm trials such as those of the NWCEP can provide a robust estimate of Yp for a given location under a specific set of management practices provided that the trials are replicated over many years.21
Recent reviews of methods for assessing yield gaps with a global relevance6,22 provided some guidelines for properly estimating Yp based on maximum yields achieved among a sizable sample of farmers in a region of interest. Based on these reviews, 5 years' data from the most recent period is considered adequate for estimates of Ya in favourable, high-yielding environments such as irrigated systems. The upper (95th) percentile of farmer yield data is also recommended as an ideal approach for calculating Yp, based on the assumption that in any given production system of many farmers, it is likely for a few progressive farmers to come quite close to the Yp through best cultivation practices.6,22 Before the analysis of Buffels yield data to determine mean yields and variance components, the data were validated to check and remove outliers. Summary statistics for means, standard deviations and percentiles of the combined data were determined using GenStat® 17 statistical software.
Selection of irrigation wheat farms for soil fertility evaluation
The fields of producers who planted irrigation wheat during the 2015 season were used for the soil fertility evaluation. Representative producers for each of the geographical regions were identified in collaboration with the NWCEP. The geographical regions were further sub-divided into localities of interest where most irrigation wheat producers were concentrated. Producers were contacted and only those who gave permission for sampling on their wheat fields were considered in this study. A limitation of the purposive sampling procedure used in this study is that it excluded the fields of those irrigation wheat producers who were not willing to have their fields surveyed. It also excluded the fields of wheat producers who did not plant irrigation wheat during the 2015/2016 season. However, the results from this study may also be indicative of the conditions in the fields of these producers, as long as the soils are from the same parent materials and are managed the same way.
Different tillage systems were identified through observation of the fields. Within the context of the current study, conservation tillage fields were identified as those fields in which wheat was either planted directly into the previous crop's residues with no soil disturbance, or where there were signs of slight soil disturbance and about 30% of crop residues on the soil surface. Conventional tillage fields were those with signs of complete turning of soil and less than 30% or no residues on the soil surface. The residues of the crops which preceded wheat were used to identify the crop rotation system as either legume or non-legume. CA fields were those in which conservation or no-till was combined with a legume-wheat crop rotation system, assuming the wheat also served as a winter cover crop for permanent cover.
Soil sampling and analysis
Soil samples were collected from the 0-20 cm and 20-40 cm depths using a graduated auger, after clearing the litter layer. A simple random sampling procedure was used. Soil sampling was carried out from May to September 2015, after the emergence of wheat seedlings to ensure clear identification of wheat fields. At least 10 random samples were collected from each of the fields and bulked to form a composite sample. The samples were air dried (visible organic debris removed), ground (< 2 mm) and analysed at the ARC-SGI soil laboratory. The samples were analysed for electrical conductivity (EC; 1:1 soil to water suspension), pH (1:5 soil to 1 M KCl suspension), exchangeable acidity (1 M KCl), extractable P (Bray 1), exchangeable cations and extractable S (1 N NH4OAc at pH 7) and extractable Zn (0.1 M HCl) using procedures of the Non-affiliated Soil Analysis Working Committee.23 In addition to these analyses, organic C (Walkley-Black method)24 and particle size distribution (hydrometer and sieve method)25 were also determined. Using equivalent values (cmol/kg), cation exchange capacity (CEC; sum of exchangeable acidic [H and Al] and basic [Ca, Mg, K and Na] cations), acid saturation (ratio of exchangeable acidic cations to CEC), exchangeable sodium percentage (ESP; exchangeable Na to CEC) and Ca:Mg ratio were calculated. Nitrogen adequacy was determined through visual assessments of irrigation wheat crops at the flag leaf stage using a guide for field identification by Snowball and Robson26.
The number of sites that were sampled varied across geographical regions, and the resulting soil fertility data were unbalanced, with both fixed (geographical regions, crop rotations, tillage systems, soil depth) and random (locations) effects. Therefore, a mixed model, the residual (or restricted) maximum likelihood (REML) algorithm was used to reliably estimate variance components.27,28 The REML was performed using GenStat® 17 statistical software. Third-order interactions were not included. Conclusions regarding nutrient status were made through comparisons between soil test results and nutrient management guidelines for cereal crops.29,30 The extractants used in the current study correspond to those used in the nutrient management guidelines.
Results
Actual yields, yield potentials and yield gaps
Actual yields for irrigated wheat ranged from 5.99±0.15 t/ha in the KwaZulu-Natal region to 8.32±0.10 t/ha in the cooler central region (Table 1). In agreement with Ya, Yp ranged from 7.57 t/ha in the KwaZulu-Natal region to 11.45 t/ha in the cooler central region. The resulting Yg range is therefore 1.58-3.13 t/ha, implying irrigation wheat yields could be increased by 26% to 38%.
Tillage and crop rotation practices
The majority (63.85%) of irrigation wheat producers who participated in the study practised conventional tillage, with 36.15% using conservation tillage (Table 2). Most (88.37%) of the producers in the KwaZulu-Natal region practised CA; that is conservation till combined with a legume-wheat crop rotation system, assuming the wheat also serves as a winter cover crop for permanent cover. In the warmer northern region, only 13.89% of the sampled farms practised conservation tillage with legume-wheat crop rotation. In the eastern Highveld and cooler central regions, all the farms (100%) practised conventional tillage. There were more farms practising a non-legume-wheat rotation than farms practising a legume-wheat rotation in the cooler central and warmer northern region. The overall adoption rate of CA was 33.08%.
Soil fertility variation across all irrigation wheat fields
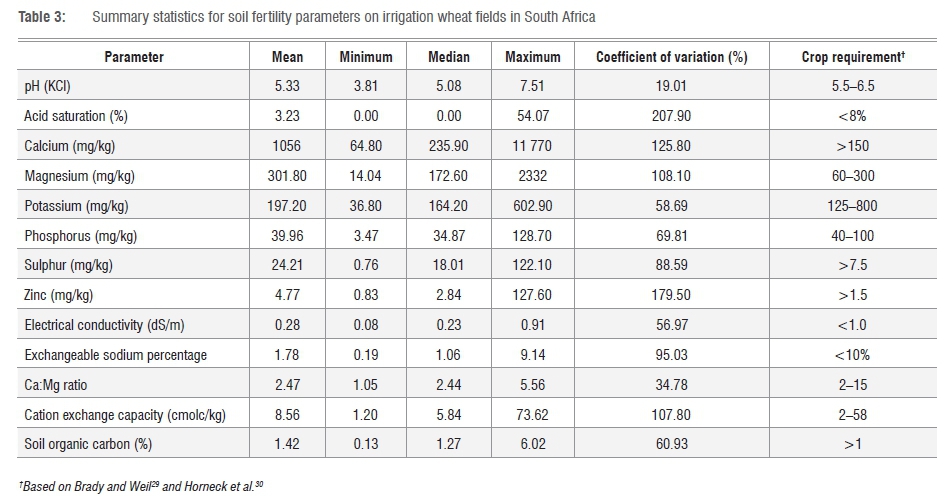
Summary statistics for soil fertility parameters are presented in Table 3. There was considerable variation within each of these parameters as shown by the high coefficients of variation and the corresponding large difference between minimum and maximum values. However, over 95% of sampled farms had acceptable values for Ca (>150 mg/kg), Mg (>60 mg/kg), Zn (>1.5 mg/kg), S (>7.5 mg/kg), ESP (<10), Ca:Mg ratio (>1<15) and EC(<1 dS/m). Field observations of wheat crops showed that there was generally adequate N on wheat fields across the geographical regions. These parameters were therefore excluded from further analysis and the study only focused on those parameters that appeared to be limiting on a considerable fraction of farms, i.e. >10%.
These parameters were SOC, P and pH. SOC content was below 1% at 0-20 cm soil depth on 43.85% of the farms. Soil pH on more than 40% of the farms was below the recommended range of 5.5-6.5 for optimal wheat growth at 0-20 cm. For P more than 30% of the farms had less than the minimum requirement of 40 mg/kg.
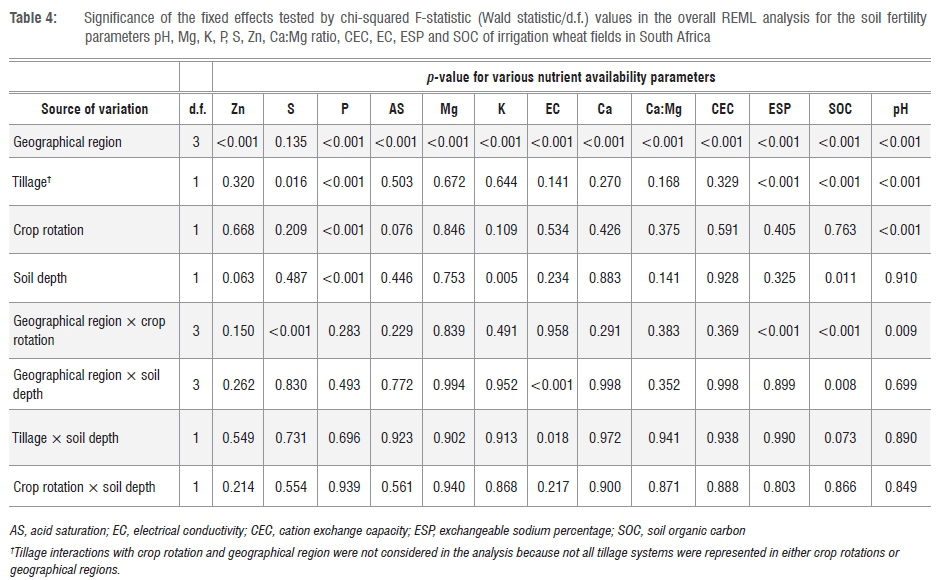
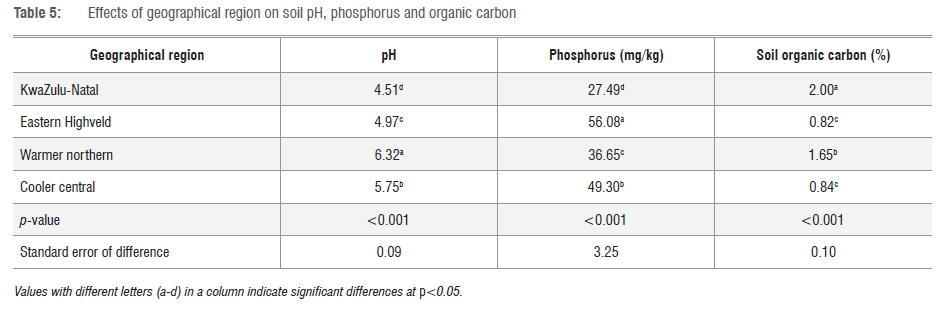
The SOC, pH and extractable P varied significantly (p<0.001) with different geographical regions and tillage systems, as shown in Table 4. KwaZulu-Natal (2.00±0.09%) had the highest level of SOC, followed by the warmer northern (1.65±0.14%), cooler central (0.84±0.08%) and eastern Highveld (0.82±0.07%) regions (Table 5). The eastern Highveld (56.08±4.53 mg/kg) and cooler central (49.30±2.77 mg/kg) regions had adequate P but the warmer northern (36.65±3.65 mg/kg) and KwaZulu-Natal (27.49±2.04 mg/kg) regions showed potential deficiencies (Table 5). Mean soil pH of all the geographical regions was in the acidic range; pH was outside the acceptable range of 5.5-6.5 in the KwaZulu-Natal (pH 4.51±0.05) and eastern Highveld (pH 4.97±0.08) regions.
Conservation tillage fields (2.15±0.10%) had more SOC than conventional tillage fields (1.02±0.05%) but lower pH (4.51±0.06) than conventional tillage fields (5.82±0.08). The P content of conventional tillage fields was adequate (48.48±2.27 mg/kg) when compared to that of conservation tillage fields (25.58±1.92 mg/kg). Soil pH and P levels varied significantly (p<0.001) across crop rotation systems (Table 4). Rotation systems in which wheat was preceded by non-legumes had acceptable P levels (52.20±3.01 mg/kg) and higher soil pH (5.9) than those in which wheat was preceded by legumes, which had low P levels (31.70±1.81 mg/kg) and lower soil pH (4.95).
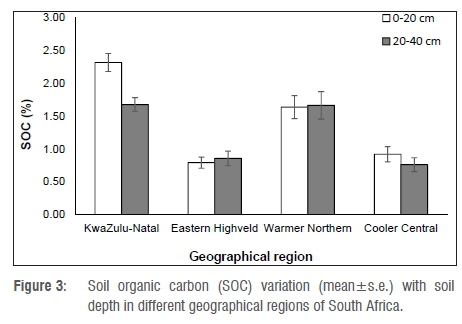
There was significantly more extractable P at a soil depth of 0-20 cm (45.57±2.54 mg/kg) than at 20-40 cm (34.36±2.28 mg/kg) (Table 4). Overall, there was also more SOC in the 0-20 cm soil layer (1.55±0.09%) than in the 20-40 cm soil layer (1.33±0.08%).
The geographical region and crop rotation interaction effect on soil pH and SOC was significant (p<0.001). The nature of the interactions is shown in Figure 2. The eastern Highveld and warmer northern regions had slightly lower soil pH for rotations in which wheat was preceded by a legume than when wheat was preceded by a non-legume. The rotations had similar pH results in the KwaZulu-Natal and cooler central regions. In KwaZulu-Natal, there was more SOC on non-legume-wheat crop rotations, whereas in the warmer northern region, the opposite was true.
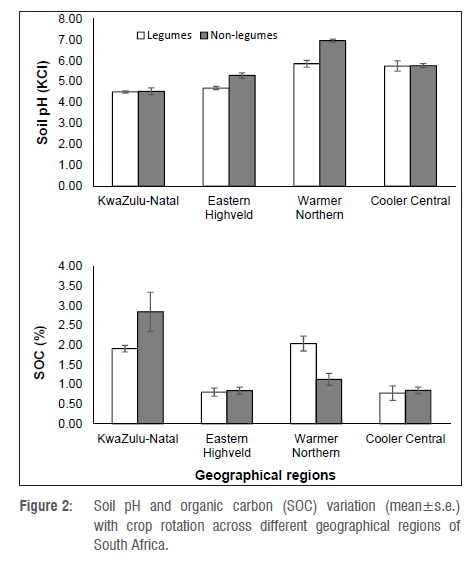
Similar amounts of SOC were observed for legumes and non-legumes in wheat rotations in the cooler central and the eastern Highveld regions. Fields in KwaZulu-Natal had more SOC in the topsoil (0-20 cm) than in the subsoil (20-40 cm) (Figure 3). In the warmer northern, eastern Highveld and cooler central regions, similar SOC levels were observed in soil from both depths.
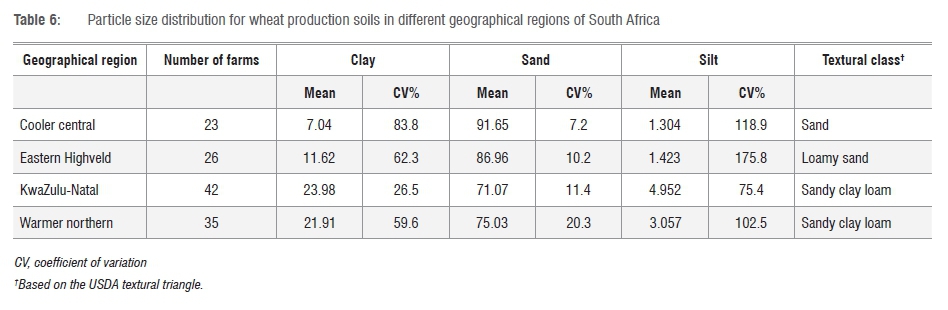
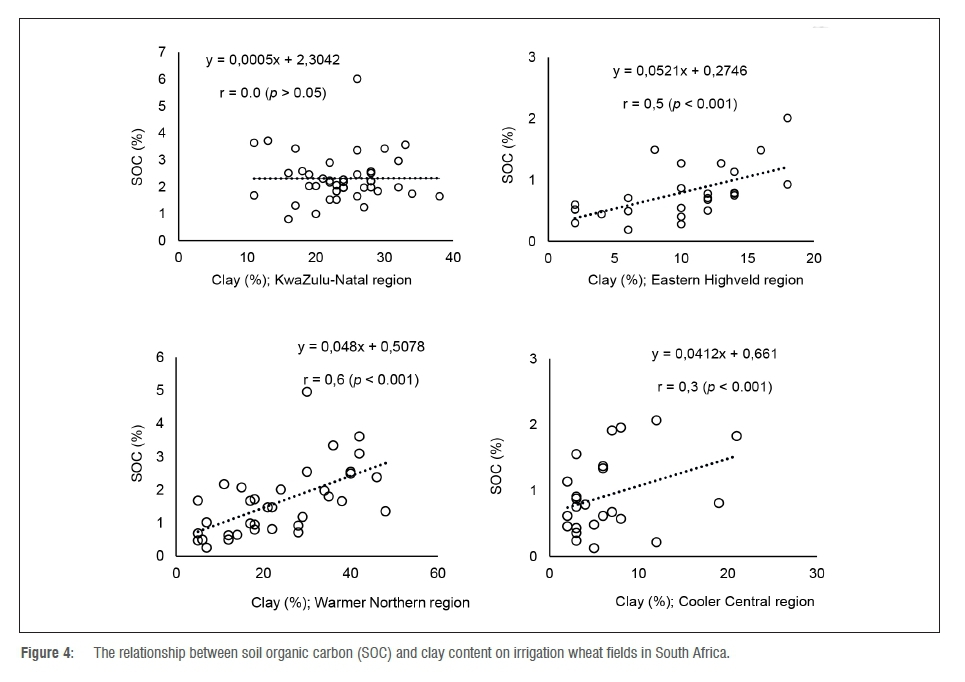
Analysis of particle size distribution showed that there were differences in mean textural classes of soils in the geographical regions (Table 6). Soils in the cooler central region were predominantly sandy and those of the eastern Highveld region were classed as loamy sands. The KwaZulu-Natal and warmer northern regions had higher clay contents and were classified as sandy clay loam soil. There was, however, considerable variation in clay and silt content of the soils within geographical regions as shown by the high coefficients of variation. Linear correlation of SOC against soil clay content showed that there was no relationship between SOC and clay content (r=0) in the KwaZulu-Natal region, but all the other regions showed significant positive Pearson's correlations (Figure 4).
Discussion
This study contributed to our knowledge pool through quantifying yield gaps and investigating CA practices and soil fertility constraints of irrigated wheat fields in different production areas of South Africa. It has been shown, using actual farm data, that wheat production in South Africa can be increased by exploiting the available potential for increasing yields in various production areas. These yield gaps range from 1.58 t/ha to 3.13 t/ha, representing up to 38% of the yield potential. The findings are in agreement with Licker et al.31 who stated that large yield gaps in grain production are concentrated in developing countries, and that poor crop management is the major cause of yield loss for grain crops. A yield potential of 13.67 t/ha which was calculated for the cooler central region is comparable to the world record for farm wheat yield of 16.52 t/ha, which was obtained in the United Kingdom.32 The study also identified regions such as KwaZulu-Natal where the yield gap (1.58 t/ha) and yield potential (7.57 t/ha) are rather low, and efforts would probably need to be channelled towards strategies for increasing the Yp. Although spring wheat can tolerate high temperatures between 22 °C and 34 °C33, cool and moist climate is the most ideal for growth of the currently recommended cultivars. It is most likely that temperature is one of the major limiting factors of wheat productivity in KwaZulu-Natal, where average monthly temperatures are in the range 15-32 °C. There is evidence suggesting that an increase in temperature of 1 °C above the optimal can reduce wheat yield by up to 50%.34
We also identified opportunities to improve soil fertility management on irrigated wheat fields. Most irrigation wheat producers who participated in the study practised conventional tillage and 43.85% of the sampled farms had less than 1% SOC. Kay and Angers16 found that when the SOC is less than 1%, yield potential of a crop is limited on low clay soils. This finding could mean that nearly half of the irrigation wheat producers fail to achieve the yield potential of irrigation wheat on their farms because of low SOC, among other reasons. The high adoption rate of CA amongst irrigation wheat producers in KwaZulu-Natal (Table 2) is remarkable, considering that there was very low adoption of the technology in other regions. The No Till Club of KwaZulu-Natal, formed more than 15 years ago, may have played a huge role in the promotion of CA adoption in this region. Currently, about 130 commercial producers from KwaZulu-Natal are members of the No-Till Club, and the club provides a no-till training course to these producers and any other interested parties.
More effort is required by non-profit farming organisations to actively promote CA in the other regions. Dumanski et al.35 pointed out that successful CA is achieved through community-driven development processes whereby local researchers, communities and producer associations identify and promote the best options for CA in their locations.
Another reason for wide-scale adoption of CA in KwaZulu-Natal could be the fact that the heavy soils of KwaZulu-Natal generally require heavier machinery and more fuel for tillage, and CA was an obvious attraction for reducing fuel and traction costs to the KwaZulu-Natal farmers. The heavy soils also compact easily when worked under wet conditions. The KwaZulu-Natal region is also warmer and wetter, such that producers have many options for increasing biomass to obtain the benefits of CA. Maize yields in excess of 10 t/ha are common in irrigation production systems of South Africa. The slow decomposition of the preceding summer crop's residues presents serious planting and crop emergence challenges for subsequent winter wheat, especially if the producers do not have the right planting equipment. Many producers resort to the plough to solve the problems, and this probably explains why most irrigation wheat farmers still practise conventional tillage.
However, soil acidity and Ρ deficiencies were most severe in the KwaZulu-Natal region in comparison to other regions. It appears as if the wide-scale adoption of CA has not addressed soil acidity and Ρ deficiency problems that may be inherent to this region. The KwaZulu-Natal region has well-weathered soils that are derived from dolerite.20 Under a humid climate, soils tend to have excess sesquioxides29 and the low Ρ could possibly be attributed to the high fixation of Ρ by sesquioxides in this region. Low soil pH and relatively high acid saturation are common in highly weathered soils. The accumulation of SOC in this region could have resulted in greater acidity, through degradation of SOM and mineralisation of N under the sub-humid conditions. It could also be deduced that producers in KwaZulu-Natal have always struggled with acidity and P deficiency. Therefore, they were better motivated to adopt CA, which is generally purported to increase Ρ availability, as well as reduce acidity problems over the long term.36 There is a need for dedicated research to refine the CA practice in KwaZulu-Natal to enhance Ρ availability, reduce Ρ stratification and reduce acidification of soils.
The pH of soil from more than 40% of the farms was below the recommended range of 5.5-6.5 for optimal wheat growth. Therefore, soil acidity could be a major concern in the fertility of irrigation wheat fields in South Africa. Soil pH was influenced by crop rotation, whereby there was lower soil pH on the legume-wheat crop rotations in comparison to non-legume-wheat crop rotations. The decrease in soil pH following legumes crop rotation (Figure 2) may be attributable to more rapid degradation of legume residues as a result of a favourable C:N ratio and the associated nitrification which has an acidifying effect.37 The decrease in soil pH and increase in exchangeable acidity on the conservation tillage systems observed in this study may be attributed to SOC accumulation. The accumulation of SOC leads to a dissociation of humic material which contains carboxylic and phenolic groups. When these groups dissociate, H+ is released which further reduces soil acidity. Accumulation of SOC could also result in more Ν and S mineralisation, thus increasing H+ concentrations and lowering soil ρΗ. 38,39 There was more plant available Ρ on rotations in which wheat was preceded by non-legumes than in legume-wheat rotations. This finding may be because legumes degrade rapidly as a result of a low C:N ratio, and, after decomposition of legumes, mineralisation of Ν can occur (which has acidifying effects), thus resulting in Ρ fixation and hence low Ρ availability.
Zn varied significantly across the geographical regions, but means were generally within the acceptable range (>1.5 mg/kg) in all the regions (Table 3). These results appear contradictory to findings by Herselman40 who reported that 91% of South African soils are Zn deficient as they contained <1.5 mg/kg. It should be noted that most N, P and K basal fertilisers that are used in South Africa by commercial producers are fortified with at least 0.5% Zn, and continuous use of these fertilisers probably explains the general adequacy of Zn on these fields. Field observations showed that there was generally adequate N on wheat fields across the geographical regions, suggesting that the producers are managing N well. Much of the fertilisers promoted by fertiliser companies in South Africa are N-based, hence producers are more inclined to purchase these above others. Secondly, N deficiency symptoms on wheat are relatively easy to diagnose as a characteristic yellowing of the lower leaves. The high mobility of N also means that the deficiency can be corrected at any stage using split applications during crop growth.
Soils in the different irrigation wheat production regions of South Africa developed from various parent materials and are subjected to different climatic conditions, thus they are of different properties and texture. The KwaZulu-Natal and warmer northern regions are relatively warmer and wetter than the eastern Highveld and cooler central regions. Hence, the soils in KwaZulu-Natal and warmer northern regions are predominantly well weathered and fine textured whereas those of the eastern Highveld and cooler central regions are coarse textured.20 Weathering of soils results in high Al and Fe oxides which enables SOC to exist as organo-oxide complexes,29 which could protect SOC. In general, clay content is thought to be the most important rate modifier of SOC accumulation.41 However, the higher SOC contents in the top soil (0-20 cm) of irrigation wheat fields in KwaZulu-Natal could be related to the level of adoption of CA in the region, as no significant relationship could be established between SOC and clay contents for this region (Figure 4).
The producers retain crop residues on their fields and the biomass is protected from rapid decomposition through reduced or no-tillage. The variations in SOC with geographical region and soil depth as observed in the study could also be the result of differences in predominant tillage systems in these regions. Under conservation tillage, SOC is concentrated on the topsoil because of a limited aggregate turnover41,42, while in the conventional tillage system SOC is evenly distributed in the soil profile as a result of regular mixing of aggregates during tillage43. SOC is more stable in the no-tillage and conservation tillage fields compared to conventionally tilled fields because of the limited turnover of aggregates.44-47 More action is needed to increase the awareness of wheat producers on the consequences of conventional tillage in terms of SOC losses, and hence soil fertility depletion. Wheat producers that practise conventional tillage could benefit from reducing soil disturbance if they convert to CA, as many already practise rotations, permanent soil cover and proper fertiliser management, which are requirements for CA.18
Soil organic matter was observed to vary with different crop rotation systems on different geographical regions. There was more SOC in the KwaZulu-Natal region when a non-legume crop rotation was practised and this could probably be attributed to slow decomposition of the non-legume residue under conservation till.48 In the warmer northern region where most producers practise conventional tillage, more SOC was measured in a legume-wheat crop rotation. These results suggest that inclusion of legumes in rotation could be offsetting some of the negative effects of conventional tillage on SOC. These unexpected findings are partly in agreement with the observations of Corbeels et al.17 and Naresh et al.49 who investigated the extent of global CA adoption in resource-poor environments. They reported that legume-based crop rotations enrich soil fertility. Wheat producers in arid and semi-arid areas could benefit from adopting CA practices with legumes in rotation systems, while producers from wetter regions could benefit from including non-legumes in their rotation systems.
Conclusions
Irrigated wheat production in South Africa could be increased by closing large yield gaps in production regions; these yield gaps ranged from 1.58 t/ha to 3.13 t/ha, representing 26-38% of the yield potential. Poor soil fertility may be a major yield constraint in intensive irrigated wheat production systems. It is recommended that future studies must focus on sustainable approaches for effectively enhancing P availability and addressing pH problems under conservation till and legume-wheat rotations, especially in KwaZulu-Natal. More action is required in order to increase wheat producer awareness on the soil fertility benefits of CA in the eastern Highveld and cooler central areas. EC, eSp N, K, Mg, S, Zn and Ca:Mg ratio were, however, acceptable on more than 90% of wheat fields. It is hoped that the knowledge generated in this study would be useful to policymakers and researchers in better orienting investments in research and development projects aimed at addressing the South African wheat production crisis.
Acknowledgements
We thank ARC-SGI technical staff for their assistance with the management of field trials and soil analysis. The Winter Cereal Trust and National Research Foundation of South Africa (Project TTK150717127405) are acknowledged for funding the 'Yield gaps analysis for irrigated wheat in South Africa' project, from which this study emerged.
Authors' contributions
N.Z.S. was the lead author and the MSc student responsible for soil data collection on the project. E.D. was the project leader who initiated the project under the 'Yield Gaps for Irrigated Wheat Production Systems of South Africa'. L.V. and A.B. were collaborators on the project who provided significant intellectual input as a soil scientist and crop physiologist, respectively. PM. and T.J.T. gave significant scientific input on context and relevance of the project and also revised and refined the manuscript to its current format. PM. was also the main MSc supervisor of N.Z.S.
References
1. South African Department of Agriculture, Forestry and Fisheries (DAFF). Agricultural statistics. Pretoria: DAFF; 2014. [ Links ]
2. Lemmer W, De Villiers J. Challenges in the wheat industry and the relevance of the import tariff. SA Grain. 2012;14:46-49. [ Links ]
3. Payne T. Maize production blossoms in SA. Mail and Guardian. 2012 May 18. Available from: http://mg.co.za/article/2012-05-18-maize-production-blossoms-in-sa/ [ Links ]
4. Smit HA, Tolmay VL, Barnard A, Jordaan JP Koekemoer FP Otto VM, et al. An overview of the context and scope of wheat (Triticum aestivum) research in South Africa from 1983 to 2008. S Afr J Plant Soil. 2010;27:81-96. http://dx.doi.org/10.1080/02571862.2010.10639973 [ Links ]
5. Agricultural Research Council Small Grain Institute (ARC-SGI). Wheat production guidelines: Production of the small grains in the summer rainfall area. Pretoria: South Africa; 2015. [ Links ]
6. Van Ittersum MK, Cassman KG, Grassini P, Wolf J, Tittonell P, Hochman Z. Yield gap analysis with local to global relevance - A review. Field Crops Res. 2013;143:4-17. http://dx.doi.org/10.1016/j.fcr.2012.09.009 [ Links ]
7. Bryan BA, King D, Zhao G. Influence of management and environment on Australian wheat: Information for sustainable intensification and closing yield gaps. Environ Res Lett. 2014;9:44-45. http://dx.doi.org/10.1088/1748-9326/9/4/044005 [ Links ]
8. Armour T, Jamieson PD, Nicholls A, Zyskowski R. Breaking the 15 t/ha wheat yield barrier. In: New directions for a diverse planet: Proceedings of the 4th International Crop Science Congress; 2004 September 26 - October 01; Brisbane, Australia. Erina, NSW: The Regional Institute Online Publishing; 2004.p. 1-4. [ Links ]
9. Neumann K, Verburg PH, Stehfest E, Müller C. The yield gap of global grain production: A spatial analysis. Agr Syst. 2010;103:316-326. http://dx.doi.org/10.1016/j.agsy.2010.02.004 [ Links ]
10. Nadim MA, Awan IU, Baloch MS, Khan EA, Naveed K, Khan MA. Micronutrient use deficiency in wheat as affected by different application methods. Pakistan J Bot. 2013;45:887-892. [ Links ]
11. Rani YS, Jayasree G, Sai MVRS. Yield gap analysis using oryza 2000 model in two rice growing districts of Andhra Pradesh. Am Eur J Agr Env Sci. 2013;13:930-934. [ Links ]
12. Tittonell P, Giller KE. When yield gaps are poverty traps: The paradigm of ecological intensification in African smallholder agriculture. Field Crops Res. 2013;143:76-90. http://dx.doi.org/10.1016/j.fcr.2012.10.007 [ Links ]
13. Affholder F, Poeydebat C, Corbeels M, Scopel E, Tittonell P. The yield gap of major food crops in family agriculture in the tropics: Assessment and analysis through field surveys and modelling. Field Crops Res. 2013;143:106-118. http://dx.doi.org/10.1016/j.fcr.2012.10.021 [ Links ]
14. Food and Agricultural Organization (FAO). Nutrient management guidelines for some major field crops. Plant Nutrition and Environ Issues. 2006;11:301-302. [ Links ]
15. Howard PJA, Howard DM. Use of organic carbon and loss-on-ignition to estimate soil organic matter in different soil types and horizons. Biol Fert Soils. 1990;9:306-310. http://dx.doi.org/10.1007/BF00634106 [ Links ]
16. Kay BD, Angers DA. Soil structure. In: Sumner ME, editor. Handbook of soil science. Boca Raton, FL: CRC Press; 1999. p. 229-276. [ Links ]
17. Corbeels M, De Graaff J, Ndah TH, Penot E, Baudron F, Naudin K, et al. Understanding the impact and adoption of conservation agriculture in Africa: A multi-scale analysis. Agr Ecosys Env. 2014;187:155-170. http://dx.doi.org/10.1016/j.agee.2013.10.011 [ Links ]
18. Vanlauwe B, Wendt J, Giller KE, Corbeels M, Gerard B, Nolte C. A fourth principle is required to define conservation agriculture in sub-saharan Africa: The appropriate use of fertiliser to enhance crop productivity. Field Crops Res. 2014;155:10-13. http://dx.doi.org/10.1016/j.fcr.2013.10.002 [ Links ]
19. Giller KE, Corbeels M, Nyamangara J, Triomphe B, Affholder F, Scopel E, et al. A research agenda to explore the role of conservation agriculture in African smallholder production systems. Field Crops Res. 2011;124:468-472. http://dx.doi.org/10.1016/j.fcr.2011.04.010 [ Links ]
20. Fey M. Soils of South Africa. Cambridge, MA: Cambridge University Press; 2010. http://dx.doi.org/10.1017/CBO9780511782183 [ Links ]
21. Cassman KG, Dobermann A, Walters DT, Yang H. Meeting cereal demand while protecting natural resources and improving environmental quality. Annu Rev Env Resour. 2003;28:315-358. http://dx.doi.org/10.1146/annurev.energy.28.040202.122858 [ Links ]
22. Lobell DB, Cassman KG, Field CB. Crop yield gaps: Their importance, magnitudes, and causes. Annu Rev Env Resour. 2009;34:179. http://dx.doi.org/10.1146/annurev.environ.041008.093740 [ Links ]
23. Non-Affiliated Soil Analysis Working Committee. Handbook of standard soil testing methods for advisory purposes. Pretoria: Soil Science Society of South Africa; 1990. [ Links ]
24. Nelson DW, Sommers LE. Total carbon, organic carbon, and organic matter. In: Sparks DL, Page AL, Helmke PA, Loeppert RH, Soltanpour PN, Tabatabai MA, et al., editors. Methods of soil analysis. Part 3: Chemical methods. SSSA Book Series no. 5. Madison, WI: SSSA and ASA; 1996. p. 961-1010. http://dx.doi.org/10.2136/sssabookser5.3.c34 [ Links ]
25. Bouyoucos GJ. Hydrometer method improved for making particle size analyses of soils. Agron J. 1962;464-l65. http://dx.doi.org/10.2134/agronj1962.00021962005400050028x [ Links ]
26. Snowball K, Robson AD. Nutrient deficiencies and toxicities in wheat: A guide for field identification. Mexico: CIMMYT; 1991. [ Links ]
27. Virk DS, Pandit DB, Sufian MA, Ahmed F, Siddique MAB, Samad MA, et al. REML is an effective analysis for mixed modelling of unbalanced on-farm varietal trials. Exp Agr. 2009;45:77-91. http://dx.doi.org/10.1017/S0014479708007047 [ Links ]
28. Payne RW, Murray DA, Harding SA, Baird DB, Soutar DM. GenStat for Windows. 15th ed. Hemel Hempstead: VSN International; 2013. [ Links ]
29. Brady NC, Weil RR. The nature and properties of soils. 13th ed. Upper Saddle River, NJ: Prentice Hall; 2008. [ Links ]
30. Horneck DA, Sullivan DM, Owen JS, Hart JM. Soil test interpretation guide. Corvallis, OR: Oregon State University Extension Service; 2011. [ Links ]
31. Licker R, Johnston M, Foley JA, Barford C, Kucharik CJ, Monfreda C, et al. Mind the gap: How do climate and agricultural management explain the 'yield gap' of croplands around the world? Global Ecol Biogeogr. 2010;19:769-782. http://dx.doi.org/10.1111/j.1466-8238.2010.00563.x [ Links ]
32. Guinness World Records. Wheat yield record [homepage on the Internet]. [ Links ] c2016. [cited 2016 Dec 06]. Available from: http://www.guinnessworldrecords.com/world-records/1/highest-wheat-yield
33. South African Department of Agriculture, Forestry and Fisheries (DAFF). Wheat production guidelines. Pretoria: DAFF; 2010. [ Links ]
34. You L, Rosegrant MW, Wood S, Sun D. Impact of growing season temperature on wheat productivity in China. Agr Forest Meteor. 2009;149:1009-1014. http://dx.doi.org/10.1016/j.agrformet.2008.12.004 [ Links ]
35. Dumanski J, Peiretti R, Benetis J, Mcgarry D, Pieri C. The paradigm of conservation agriculture. Procedures of the World Association on Soil and Water Conservation. p. 58-62. [ Links ]
36. Dube E, Chiduza C, Muchaonyerwa P. High biomass yielding winter cover crops can improve phosphorus availability in soil. S Afr J Sci. 2014;110(3/4), Art. #2013-0135, 4 pages. http://dx.doi.org/10.1590/sajs.2014/20130135 [ Links ]
37. Roosevelt FD. Understanding soil acidity. Magill, SA: Agricultural Bureau of South Australia; 2011. p. 1-8. [ Links ]
38. Zeng F, Ali S, Zhang H, Ouyang Y Qiu B, Wu F, et al. The influence of pH and organic matter content in paddy soil on heavy metal availability and their uptake by rice plants. Environ Pollut. 2011;159:84-91. http://dx.doi.org/10.1016/j.envpol.2010.09.019 [ Links ]
39. Mathew RP, Feng Y, Githinji L, Ankumah R, Balkcom KS. Impact of no-tillage and conventional tillage systems on soil microbial communities. Appl Environ Soil Sci. 2012;2012, Art. #548620, 10 pages. http://dx.doi.org/10.1155/2012/548620 [ Links ]
40. Herselman JE. The concentration of selected trace metals in South African soils [dissertation]. Stellenbosch: Stellenbosch University; 2007. [ Links ]
41. Six J, Elliott ET, Paustian K. Soil macroaggregate turnover and microaggregate formation: A mechanism for C sequestration under no-tillage agriculture. Soil Biol Biochem. 2000;32(14):2099-2103. http://dx.doi.org/10.1016/S0038-0717(00)00179-6 [ Links ]
42. Kay BD, Vandenbygaart AJ. Conservation tillage and depth stratification of porosity and soil organic matter. Soil Till Res. 2002;66:107-118. http://dx.doi.org/10.1016/S0167-1987(02)00019-3 [ Links ]
43. Bot A, Benites J. The Importance of soil organic matter: Key to drought-resistant soil and sustained food production. FAO Soils Bulletin #80. Rome: Food and Agriculture Organization; 2005. [ Links ]
44. Six J, Elliott ET, Paustian K. Aggregate and soil organic matter dynamics under conventional and no-tillage systems. Soil Sci Soc Am J. 1999;63:1350-1358. http://dx.doi.org/10.2136/sssaj1999.6351350x [ Links ]
45. De Moraes Sá JC, Séguy L, Tivet F, Lal R, Bouzinac S, Borszowskei PR, et al. Carbon depletion by plowing and its restoration by no-till cropping systems in oxisols of subtropical and tropical agro-ecoregions in Brazil. Land Degrad Develop. 2015;26(6):531-543. http://dx.doi.org/10.1002/ldr.2218 [ Links ]
46. Nascente AS, Li YC, Crusciol CAC. Cover crops and no-till effects on physical fractions of soil organic matter. Soil Till Res. 2013;130:52-57. http://dx.doi.org/10.1016/j.still.2013.02.008 [ Links ]
47. Shrestha BM, Singh BR, Forte C, Certini G. Long-term effects of tillage, nutrient application and crop rotation on soil organic matter quality assessed by NMR spectroscopy. Soil Use Manage. 2015;31:358-366. http://dx.doi.org/10.1111/sum.12198 [ Links ]
48. Chivenge PP, Murwira, HK, Giller KE, Mapfumo P, Six J. Long-term impact of reduced tillage and residue management on soil carbon stabilization: Implications for conservation agriculture on contrasting soils. Soil Till Res. 2007;94:328-337. http://dx.doi.org/10.1016/j.still.2006.08.006 [ Links ]
49. Naresh RK, Gupta RK, Misra AK, Kumar D, Kumar V, Kumar V. Conservation agriculture for smallholder irrigation production: Opportunities and constraints of new mechanized seeding systems: A review. Int J Life Sci Biotech Pharma Res. 2014;3:2250-3137. [ Links ]
 Correspondence:
Toi Tsilo
tsilot@arc.agric.za
Received: 15 May 2016
Revised: 30 June 2016
Accepted: 06 Sep. 2016
FUNDING: National Research Foundation (South Africa); South African Agency for Science and Technology Advancement; Winter Cereal Trust

