


Services on Demand
Article
 English (pdf)
 Article in xml format
 Article references
Indicators

Related links
-
 Cited by Google
 -
 Similars in Google
Share

 Permalink
South African Journal of Science
On-line version ISSN 1996-7489
Print version ISSN 0038-2353
S. Afr. j. sci. vol.113 n.1-2 Pretoria Jan./Feb. 2017
http://dx.doi.org/10.17159/sajs.2017/20160073
RESEARCH ARTICLE
Estimation of household income diversification in South Africa: A case study of three provinces
Jabulani MathebulaI; Maria MolokommeII; Siyanda JonasII; Charles NhemachenaIII
IDepartment of Agricultural Economics and Animal Production, University of Limpopo, Polokwane, South Africa
IIEconomic Performance and Development, Human Sciences Research Council, Pretoria, South Africa
IIIInternational Water Management Institute, Pretoria, South Africa
ABSTRACT
We estimated household income diversification in settlement types of the poorest provinces in South Africa - the Eastern Cape, Limpopo and KwaZulu-Natal. We obtained data from the 2010/2011 Income and Expenditure Survey from Statistics South Africa and Wave 3 data from the National Income Dynamics Study. We used the number of income sources, the number of income earners and the Shannon Diversity Index to estimate income diversification in the study provinces. The results show that households in the traditional and urban formal areas diversified income sources to a greater extent than households in urban informal and rural formal settlements. The varied degrees of income diversification in the three provinces suggest that targeted policy initiatives aimed at enhancing household income are important in these provinces.
SIGNIFICANCE:
• Indices yet to be used in South Africa were used in the analysis of StatsSA data to understand income diversification.
• Poverty is mostly concentrated in the traditional areas and urban informal areas.
• Households in the traditional areas and urban informal areas derive livelihood mostly from social transfers and remittances, whereas those in the urban formal areas derive income from business, labour income and financial capital returns.
Keywords: income diversification; livelihood diversification; poverty; unemployment; inequality
Introduction and problem statement
Livelihood diversification is increasingly seen as one of the pathways for poverty reduction and economic growth in sub-Saharan Africa.1 Asset, activity and income diversification characterises the livelihood strategies of many rural communities in sub-Saharan Africa. Income diversification refers to an increase in the number of sources of income, or the balance between different sources.2 There are multiple motives which prompt households or individuals to diversify assets and income-earning activities. These motives include the need to increase income to provide a sufficient livelihood3 - and to reduce risk and even out consumption - because reliance on one source of income increases the risk of destitution and prevents achievement of economies of scope.4 Thus, a household with two sources of income would be more diversified than a household with only one source5, and a household with two income sources, each contributing half of the combined total, would be more diversified than a household with two sources with one income accounting for 90% of the total6. Income diversification is a component of livelihood diversification, which is a process by which households construct a diverse portfolio of activities and social support capabilities in order to improve their living standards and manage risk.6
Barrett et al.2 further classifies motives for diversification into 'pull and push' factors. Pull factors are those which are related to risk reduction, whereas push factors are related to a need to expand the line of production in order to produce complementary goods. Unemployment is one of the pull factors which somehow compels households to diversify livelihood activities for the provision of sustenance. In South Africa, households or individuals diversify incomes to overcome the consumption challenges made worse by the high unemployment rate, which is amongst the highest in the world, with over 25% of the labour force unemployed.
The challenges of unemployment in South Africa are also compounded by high levels of poverty and inequality. South Africa is one of the countries which have a high Gini coefficient - the third highest in Africa after Namibia and the Seychelles.7 Since the advent of democracy in South Africa in 1994, various policies have been implemented to address these challenges. These include the Reconstruction and Development Programme (RDP) of the early 1990s; the Growth, Employment and Redistribution (GEAR) strategy in 1996; and the Accelerated and Shared Growth Initiative for South Africa (ASGISA) in 2005. A recent strategy is the National Development Plan (NDP) Vision 2030 - South Africa's long-term socio-economic development roadmap. In spite of all these strategies, South Africa seems not to have achieved the intended objectives of reducing poverty and inequality. It is, therefore, important to understand the livelihood strategies which households adopt in their struggle for survival and to improve incomes.
Studies on income diversification in developing countries, particularly in Africa, have concentrated on income diversification of households who are already participating in agriculture and seek to diversify within, and outside, agriculture.8-10 There is scarce literature, however, on income diversification and the variation of income sources in South Africa.
Efforts to measure income diversification in southern African countries include6,11-13 the work of Chitiga-Mabugu et al., on which this paper builds, who analysed the profile of poverty in the nine provinces of South Africa. Chitiga-Mabugu et al.13 used the Foster, Greer and Thorbecke family of poverty indices to measure important indicators of poverty (incidence, depth and severity of poverty). Although the study used poverty incidence to present poverty by income sources, one limitation was that household income diversification and the degree (scatteredness) of diversification was not explored.
Therefore, this study contributes to the existing knowledge of income diversification by analysing household income diversification and the degree of diversification in the three poorest provinces of South Africa, as identified in the study by Chitiga-Mabugu et al.13: the Eastern Cape, Limpopo and KwaZulu-Natal. We used the number of income sources (NIS) and the number of income earners (NYE) to estimate household income diversification, and the Shannon Equitability Index (SEI) to account for the degree of diversification. These indices, to the best of our knowledge, are yet to be used in South Africa to understand income diversification.
Review of income diversification studies
Livelihood diversification is a process involving the maintenance and continuous variation of a highly diverse portfolio of activities over time in order to secure survival and improve standards of living. Livelihood diversification has been coupled to the diversification of rural economies. The diversification of rural economies in sub-Saharan Africa has followed a different trajectory from those in Asia and Europe,14 but this does not necessarily mean that it has not taken place. Over the years, the diversification of small-holder rural economy in sub-Saharan Africa has been underpinned by household and livelihood diversification. Hilson15 traces smallholder agriculture and rural household diversification patterns over a period of structural adjustment, during which households experienced immense suffering. He argues that, during this time, a delicate balance between agriculture and off-farm activities existed.
It is largely within the context of smallholder rural economy diversification that the patterns of household and individual diversification became visible, and received scholarly attention. Patterns of rural livelihood diversification are characterised by the variation of activities which can be categorised by sector (farm activities and non-farm activities, or agricultural activities and non-agricultural activities); by function (wage employment activities and self-employment, depending on how labour is compensated); and by location (on-farm and off-farm activities, depending on where the activity takes place).14-16 In addition, Hosu and Mushunje17 highlight that on-farm diversification, such as a combination of crop and livestock, can raise incomes and mitigate against risk.
It is clear that rural households avert risk and respond to shock through diversification of their livelihoods. Rural households initially engaged in diversification of their income sources as a coping or risk aversion strategy and to accumulate wealth or assets to reduce household level uncertainty.15 The motives for livelihood diversification can be characterised as push (e.g. risk aversion or coping strategy) or pull factors (e.g. wealth accumulation strategy). Loison14 further categorises motives for diversification as survival-led and opportunity-led diversification. Survival-led diversification is mainly driven by push factors and occurs when poorer rural households engage in low-return activities to ensure survival, reduce vulnerability or avoid falling deeper into poverty. Opportunity-led diversification is mainly driven by pull factors and it occurs when wealthier rural households engage in high-return non-farm activities, with accumulation objectives, in order to increase household income by maximising returns from their assets.
A number of studies has focused on the diversification between agricultural activities and non-agricultural activities of smallholder farmers. A key assumption of these studies is that rural communities are agriculturally based economies. In spite of the appeal of this assumption, the viability of smallholder farming has decreased and by default has pushed unskilled labour to the non-agricultural sector.18,19 A decrease in the size of farms as well as the inability to produce a sufficient crop yield for the market place increases pressure on households to shift to participation in non-agriculture.15-19 Coupled with land constraints resulting from increased population concentration, this situation has led to the development of varied patterns of diversification strategies under new settlement typologies.
Empirical studies on income diversification
Measuring household income diversification is important in a number of ways. It facilitates the comparison of urban and rural household income sources,13 the understanding of income diversification of poor and better-off households, and the elucidation of the underlying factors influencing household income diversification. Empirical literature explores the concept of household income diversification from a number of different perspectives, each with varying findings.
Schwarze and Zeller20 examined two aspects of income diversification in Indonesia. The first aspect was diversification as a shift away from agricultural activities, and the second was diversification as an increasing mix of income-generating activities. They used the SEI to measure income diversification and the Tobit model to analyse the determinants of income diversification. The results of their study showed that the degree of participation in agricultural activities and non-agricultural activities differs. Wealth was found to increase diversification outside agriculture, and income of poor households seemed to be generated from different sources and to be evenly distributed between the sources.
Ersado6 examined changes in and welfare implications of income diversification in Zimbabwe using the NIS which is a relatively easy measure of income diversification. The findings showed that households with a more diversified income base were better able to withstand the unfavourable impacts of policy changes and could more easily weather shocks. However, the weakness of NIS as a measure is the assumption that if there are adult members in the household, the number of sources of income increases.13 The study by Ersado6 addressed this limitation by using the NYE instead of the number of adults in a household. Ersado6 then used the inverse of the Herfindahl Index to calculate the scatteredness of income sources.
Fausat9 examined the determinants of income diversification in rural farming households in Nigeria. The study used multiple regression analysis to analyse the determinants of income diversification among farming households in Borno State. Fausat9 estimated the impact of age of the respondent, education level of the household head, ownership of assets, household size, access to loans and marital status on income diversification. It was expected that the educational level of the household head, ownership of assets and age would have positive relationships with income diversification, whereas access to loans, household size and marital status would have a negative relationship with household consumption, age and ownership of assets, when conformed to the expected outcome. On the contrary, household size, access to loans and marital status did not predict the theoretical postulations.
In another study in Nigeria, Adebayo et al.10 applied the Tobit regression model to identify determinants of income diversification among farm households. They regressed socio-economic variables on the income diversification index. The results showed that non-farm income was a major determinant of the income diversification strategy of farm households. The coefficient of education was positive, showing that a high level of education raises income diversification. An increase in farm size will, other factors being equal, generate additional income. Conversely, a farming household is likely to reduce other nonfarm activities. Membership of cooperatives also increases income diversification because it increases access to credit.
The role of Civil Society Organisations in livelihood diversification in South Africa was assessed by Chitiga-Mabugu et al.21 The Civil Society Organisations participated in six income-generating activities: agricultural production (crops and livestock), agricultural wage employment, non-agricultural wage employment, non-farm enterprises, social transfers, and non-labour employment. These activities were important in providing additional benefits which included contributing to reducing poverty, improving the well-being as well as empowerment of the communities, self-reliance and community development.
A study conducted by Alemu22, which identified dominant livelihood activities in South Africa, is the most relevant for use as a baseline of livelihood activities in South Africa. Unlike in the previous studies, Alemu made use of a more recent data set (2009 General Household Survey) to calculate the dominance of livelihood activities; a first-order stochastic dominance test was applied and multinomial logistic regression was used to identify factors constraining household entry into high-income earning activities. The livelihood activities were ranked in order of their dominance: only non-farm wage earners, farm and non-farm wage earners, farm and non-farm non-wage earners, pensioners, only non-farm non-wage earners, remittances and social grants. The study found that various factors - such as age and gender of the household head, human capital and social infrastructure - influenced the chances of entry into high-income earning activities.
Similar studies were conducted in the Eastern Cape and Limpopo Provinces by Perret et al.11,12 These studies were undertaken in communities of the former Transkei in the Eastern Cape, and in the communities of Ga-Makgato and Sekgopo in Limpopo Province, with the objective of understanding the different livelihood systems people develop over time. The results in the Eastern Cape confirmed that diversity was a major trait of local livelihood systems, in which pensions and remittances were major sources of income and farming contributed to income for only a small proportion of households. The majority of households in Limpopo benefitted from social grants in the form of childhood allowances and old-age pensions. Fewer households benefitted from employment wages in Sekgopo than in Makgato, while a small proportion in Sekgopo benefitted from farming. There was a dramatic drop in the number of households benefitting from remittances and farming income in Limpopo, when compared to the study conducted previously by Barber23 in another two communities in this province.
Livelihood diversification has been researched internationally and in other parts of southern Africa; however, there is minimal evidence on the variation of diversification into different income sources. This study adds to existing knowledge by showing the differences in the levels of diversification in four settlement types (urban formal, urban informal, traditional and rural) in three provinces in South Africa.
Methodology, data and variables
Empirical model for measuring household income diversification
Studies on income diversification have adopted measures used in various disciplines to evaluate the scatteredness of individual or household income sources. Block and Webb24 used the inverse of the Herfindahl Index to calculate income diversification. The Herfindahl Index is a measure of market concentration. Ersado6 also adopted the Herfindahl Index to elaborate on the scatteredness of household income sources.
The Gini coefficient is also used to calculate income diversification. This measure is mostly used in income distribution studies. The Gini coefficient measures the area under the Lorenz curve as a complementary proportion of the area that would be captured were the variable (e.g. assets, activities, income) perfectly equally distributed. So, a value of zero represents perfect equality in income distribution studies. The disadvantage of the Gini coefficient is its computational complexity.25 Zhao and Barry25 employed numerical integration techniques to derive a reasonably accurate discrete approximation to the true Gini coefficient.
The advantage of the Herfindahl Index, in comparison to the Gini coefficient, is its computational simplicity. The Herfindahl Index is the sum of squared shares where i is income sources and S represents shares. Other studies have used measures equivalent to the Herfindahl Index, like the SEI and Simpson Index. The Simpson Index was adopted from agronomy and geology studies, and is simply the sum of squared levels divided by the squared total. The Simpson Index is the same as the Herfindahl Index and the SEI as they also estimate the evenness of the incomes.
To measure income diversification in the three provinces, the NIS - a relatively easy to use index - was used. The NIS involves accounting for the actual household incomes from various sources. Despite the simplicity of measurement, it has been criticised for its arbitrariness. For instance, it assumes that households with more economically active adults would have more income sources.14 To overcome this weakness, we used the number of per capita sources and the number of household members. Ersado6 also used these approaches in similar settings.
To measure the degree of household income diversification (scatteredness), we applied the SEI, a commonly used measure of diversification, which is derived from the Shannon Diversity Index (SDI). This index is used in biodiversity studies to reflect how many different types of species are in a data set, and simultaneously takes into account how evenly the basic entities (such as individuals) are distributed among those types.26 The SDI (H) is expressed as follows:

where S is the number of income sources and incshareiis the share of income from activity i in total household income. SEI takes into account the evenness of the income sources, with the values 0 and 1 representing complete evenness. Based on this index H, the SEI (E) is calculated as:
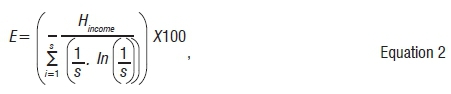
where the denominator is the maximal possible SDI and E ranges from 0 to 100 and reflects the percentage share of the actual income diversification in relation to the maximal possible diversity of income.
The measures of income diversification can also be classified into dimensions. Zhao and Barry25, in their endeavour to identify income diversification measures which better represent rural household income diversification in China, noted that diversification can be divided into one-dimensional and two-dimensional measures. One-dimensional measures comprise counts of the number of business activities or evaluate changes in the volumes of different divisions, whereas two-dimensional measures consider both the number of areas of activities and their relative volumes of turnover.
Both one-dimensional and two-dimensional measures were used in this study. NIS and NYE are one-dimensional measures and the SDI is a two-dimensional measure because it goes beyond counting the income sources to including shares from each source. These measures were used to support the assessment of income diversification of both poor and better-off households.
Data sources and variables
The Income and Expenditure Survey (IES) of 2010/2011, produced by Statistics South Africa (StatsSA)27, was used to estimate income diversification in the provinces of Limpopo, the Eastern Cape and KwaZulu-Natal. The IES's primary objective was to provide relevant statistical information on household consumption expenditure patterns that inform the updating of the Consumer Price Index (CPI) basket of goods and services. Moreover, the IES also encompasses the individual incomes and household characteristics which were used in this study. Diary and recall methodology was employed in the collection of the data. The sample size was 31 419 dwelling units in 2010/2011. Table 1 gives a description of the variables used in this study. Questions 1.6 and 1.7 from the IES were mostly used in the classification of the variables and calculations.
Two data files from IES were merged prior to the analysis: person information and person income. A total of 96 281 persons was recognised across all nine provinces. Limpopo, Eastern Cape and KwaZulu-Natal contributed 42 312 to this total. As the unit of analysis was a 'household', the data were reshaped to represent household data. The realised households were 25 328 and the three provinces constituted 10 264 households.
The main data source was IES; however, because of challenges related to the structure of some questions and responses in the data source, such as lack of continuous income responses, it was difficult to measure the degree of income diversification in the respective provinces. To address this challenge, we used the Wave 3 data set from the National Income Dynamic Study to estimate the degree of diversification, because of its richness in continuous income data. The weakness of this data set is that it was not possible to disaggregate to settlement type because of differences with that of the IES 2010.
Settlement types
The four settlement types distinguished in the study are defined as follows:
1. Urban formal - non-metropolitan urban areas that include secondary and tertiary towns28, for example Nelspruit and Polokwane.
2. Urban informal - settlements on the peri-urban fringe27, for example Soweto and Gugulethu.
3. Traditional areas (former homelands) - areas that were created during the apartheid era to house black populations to prevent them from living in urban areas27, for example Transkei and Venda.
4. Rural areas - sparsely populated areas in which people farm or are dependent on natural resources, including dispersed villages and small towns. These areas can also include larger settlements from the former homelands, which are dependent on migratory labour and remittances as well as government grants for survival27, for example Hlankomo and Mdeni.
Poverty profile of the study provinces
StatsSA released inflation adjusted poverty line types to be used for poverty measurements in the country in 2012. These poverty lines are the food poverty line and lower and upper bound poverty lines. Table 2 shows the poverty lines applicable in South Africa.

The Human Sciences Research Council's report on the state of poverty and its manifestation in South Africa13 - which is the premise of this study - applied the upper bound poverty line to analyse the state of poverty in the nine provinces of South Africa. Figure 1 plots the poverty incidence for South Africa and the nine provinces by poverty line. The figure indicates that, irrespective of the choice of poverty line, poverty comparisons across provinces remain consistent. Only three provinces have a poverty incidence below the national average for all the poverty lines. These provinces are Gauteng, Western Cape and Free State, in order of increasing poverty incidence. The poorest provinces are Limpopo, the Eastern Cape and KwaZulu-Natal, in order of decreasing poverty incidence.
Table 3 shows conditions of poverty in the settlement types of the three provinces. In Limpopo, 39% of poor households reside in traditional areas and 37% reside in rural formal settlements. In the Eastern Cape, again 39% reside in traditional areas, followed by 36% residing in urban informal areas. In KwaZulu-Natal, 46% reside in traditional areas followed by 35% in urban informal areas. These results show that poverty occurs mostly in traditional and urban informal areas.
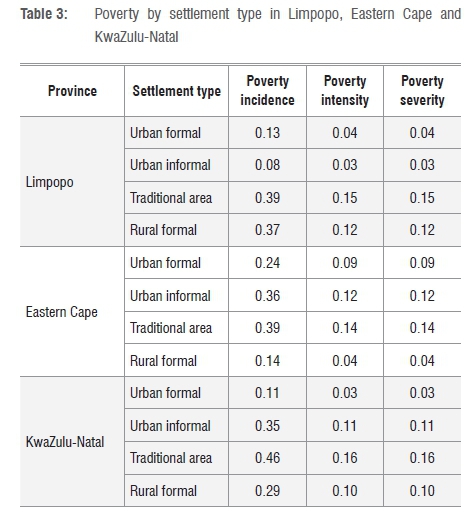
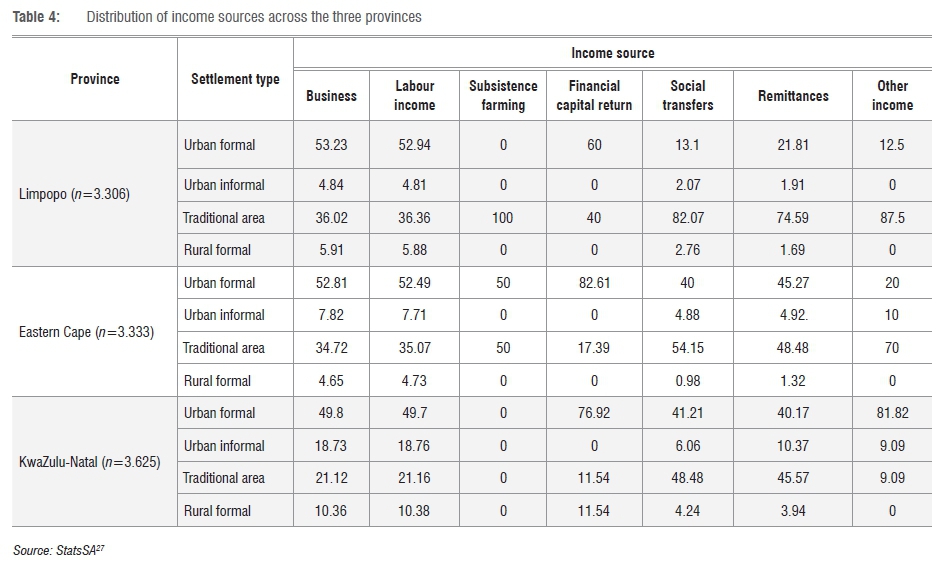
Table 4 presents the distribution of income sources in the households. The results show that 53% of households in urban formal settlements in Limpopo relied on income from business and labour (including wage and salaries). In addition, 60% of these households relied on financial capital return. In the traditional areas, 82% and 75% of the households relied on social transfers and remittances, respectively. Households across all the settlement types seemed to rely less on subsistence farming than on other income sources.
In the Eastern Cape, 83% of households in urban formal settlements relied on income from financial capital return. The results also indicated that 53% of households in urban formal settlements relied on income from business activities and labour, while 50% relied on income from subsistence farming. In traditional areas in the Eastern Cape, 54% and 48% of households relied on social transfers and remittances, respectively. These percentages are lower than those of households in Limpopo for the same sources.
In urban formal settlements in KwaZulu-Natal, 50% of households earned income from business and labour activities and 77% and 82% of households reported income from financial capital returns and other income, respectively. In traditional settlements, 48% and 46% of households reported income from social transfers and remittances, respectively. In rural settlements of KwaZulu-Natal, 12% of households reported income from financial capital return.
In the rural areas of both the Eastern Cape and Limpopo Provinces, income earned from other sources was less than 11%.
Results and discussions
The main income sources of members of households in all three provinces are shown in Table 5. In urban formal settlements in Limpopo, the main sources of income of the household members were: social transfers (86%), financial capital return (45%) and labour income (38%). In contrast, in the urban informal settlements, the main sources of income were: subsistence farming (88%), other income (74%) and financial capital return (55%). In the traditional settlements, the main income sources were: remittances (83%), business (74%) and labour income (56%). In rural areas, social transfers and labour income were the highest sources of income at 4.24% and 2.8%, respectively.
In the Eastern Cape, the main sources of income reported by individuals in in urban formal settlements were: social transfers (89%), financial capital return (71%) and other income (26%). Similar to Limpopo Province, in the urban informal settlements, the main source of income was subsistence farming (75%). In traditional settlements, the main sources of income were remittances (73%), labour income and business (both 71%) and other income (69%). In rural areas, business and labour income contributed the most to income, at 8.8% each.
Households in urban formal settlements in KwaZulu-Natal reported the following main income sources: social transfers (73%), financial capital return (69%), other income (53%) and business (52%). In the urban informal settlements, subsistence farming was again reported as the main income source (85%). The main sources of income reported in the traditional settlements were: labour income (63%), remittances (58%) and other income (41%). In rural areas, social transfers contributed 9.02% to total household income.
The results from the three provinces indicate that high proportions of individuals from urban formal settlements received income from social transfers (73% to 89%). In the traditional areas, the main source of income reported across the three provinces was remittances, while in the urban informal settlement types, subsistence farming was reported as the main source of income. It is important to note that because the incomes earned from these sources could be insufficient to provide household necessities, these households are most likely to diversify incomes to complement the main source of income (mostly earned by the household head).
Table 6 presents the results based on the NIS in households. The largest proportion of households with no source of income was reported in the traditional settlement type (68%) for Limpopo Province; while in the Eastern Cape and KwaZulu-Natal Provinces, households reporting no source of income represented 53% and 48%, respectively, of households in urban formal settlements, and 40% and 36%, respectively, of households in traditional settlements. Furthermore, the largest proportion of households with at least two income sources was for households in traditional settlements in Limpopo (60%) and households in urban formal areas in the Eastern Cape (58%) and KwaZulu-Natal (51%). Some households in traditional areas in all three provinces had diversified into three income sources, with a few in urban formal areas also diversifying into three income sources. Households which diversified into four sources of income were mostly in traditional areas, followed by those in urban formal areas in Limpopo Province, and (equally) by both urban formal and urban informal areas in KwaZulu-Natal and the Eastern Cape. This diversification could be driven by the small incomes from various sources and high level of poverty, especially in the traditional settlement type, which pushes households to diversify their income sources. Households in the rural formal and urban informal areas did not diversify income as much as households in traditional and urban formal areas. Perret et al.11 also found diversification in the Eastern Cape Province among poor households.
The proportions of income earners across households by age group are presented in Table 7. In traditional settlements in Limpopo, 58% of youth relied on one source of income. In urban formal settlements in Limpopo, 24% of the youth had no income compared to 8% for those above 35 years old. This finding is not surprising as there is a relatively higher youth unemployment in South Africa. In the urban informal settlements in Limpopo, 49% of those above 35 years of age and 29% of the youth had three income sources. In traditional areas in Limpopo, 34% of the youth had two income sources, while 29% of those above 35 years had no income. As a largely rural province, subsistence farming is one of the livelihoods of those above 35 years of age.
The Eastern Cape has one of the highest unemployment rates (38%). In urban formal settlements in the Eastern Cape, 38% of the youth had two income sources, while a striking 2% of those above 35 years had two income sources. A similar trend is observed in traditional areas, where 28% of those below 35 years had at least one source of income and 28% of those above 35 years had no income.
In urban formal settlements of KwaZulu-Natal, 29% of those above 35 years had two sources of income, and of those who were below 35 years, 24% had two sources of income. A similar trend was observed in urban informal settlements with 26% of those above 35 years having three sources of income compared to 21% of the youth.
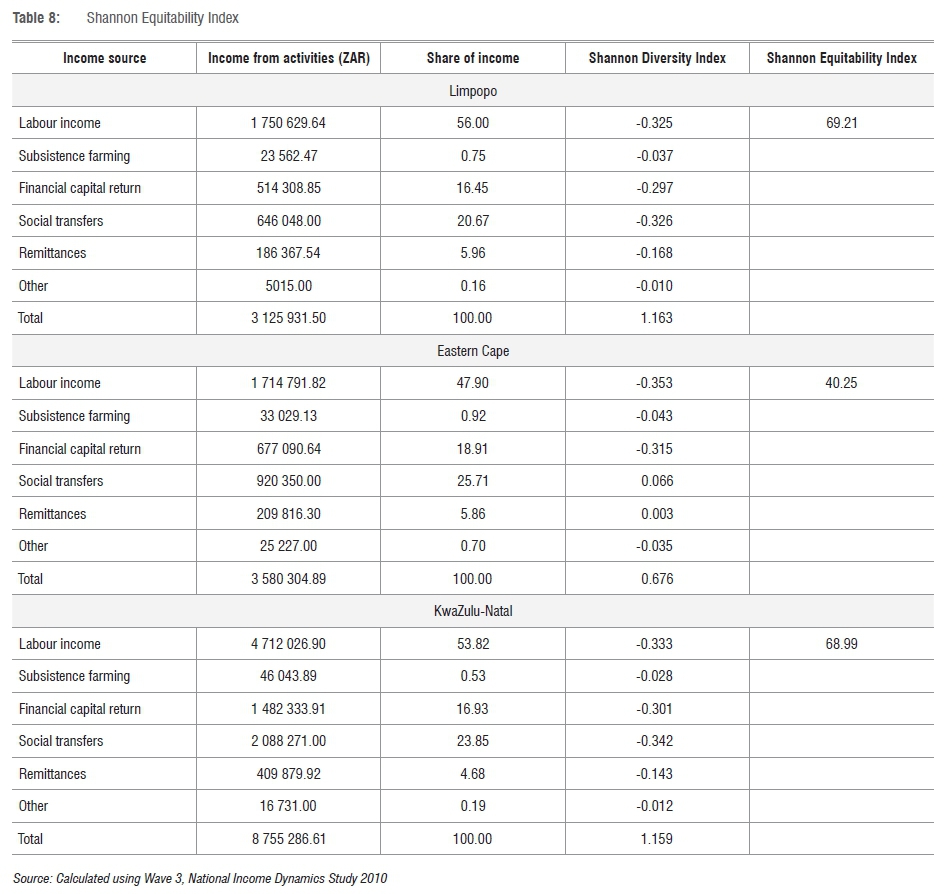
The results of the SEI analyses are shown in Table 8. Total household income ranged from ZAR3 million in Limpopo to nearly ZAR9 million in KwaZulu-Natal in 2010. Labour income constituted a high share of the total household income in all three provinces at 56%, 48% and 54% in Limpopo, the Eastern Cape and KwaZulu-Natal, respectively. Social transfers were the second source of income which contributed significantly to the total household income in all three provinces, at 21%, 26% and 24% in Limpopo, the Eastern Cape and KwaZulu-Natal, respectively. There was a small share of income from subsistence farming for households in all the provinces. A plausible reason for this could be that these households sold smaller portions of their produce.
The SDI was calculated as it was a prerequisite to measure the degree of income diversification using SEI. The SDI reached 1 in the Limpopo and KwaZulu-Natal Provinces, indicating that the household income was evenly distributed across the six sources of income. In the Eastern Cape, the SDI was 0.676, indicating less evenness than in Limpopo and KwaZulu-Natal.
The SEI, which ranges from 0 to 100, was then calculated. The SEI increases with the number of income sources. The SEI was 69% in Limpopo and KwaZulu-Natal and 40% in the Eastern Cape; households in the Limpopo and KwaZulu-Natal therefore generally diversified around the portfolio of activities in Table 8, more so than households in the Eastern Cape.
The SEI also illustrates the evenness of incomes; therefore 69% of household income in Limpopo and KwaZulu-Natal was evenly distributed across the sources of income investigated, whereas only 40% of the income was evenly distributed across the income sources in the Eastern Cape.
These results are similar to the findings of Schwarze and Zeller20 who also used the SEI. Their results illustrated that poor households tended to have more income sources and a more even distribution of income among these sources. Perret11 found that diversity was a major trait of local livelihood systems in the Eastern Cape. Households mostly relied on pension and remittances but also pursued other sources of incomes for supplementary purposes.
Conclusion and policy recommendations
We analysed household income diversification and the degree of diversification in the three poorest provinces of South Africa - the Eastern Cape, Limpopo and KwaZulu-Natal. Specifically, we analysed income diversification of households in different settlement types in each of the provinces and measured the degree of income diversification in these provinces. Data for empirical estimates were obtained from the 2010/2011 IES from StatsSA and Wave 3 data from the National Income Dynamic Study. NIS, NYE and the SDI were calculated to estimate income diversification.
The Chitiga-Mabugu et al.13 report on which this paper builds, highlighted that poverty was concentrated in the traditional areas and urban informal areas. It was illustrated in this paper that households in traditional areas derive their livelihood mostly from social transfers and remittances, while those in the urban formal areas derive income from business, labour and financial capital returns. It is crucial that government interventions that aim at creating employment and enhancing the incomes of households focus on the rural areas of these provinces. Schwarze and Zeller20 revealed that wealth increases the likelihood of income diversification. We confirmed these findings by revealing that households in the urban formal settlements follow those in the traditional area settlements in terms of diversifying.
The social wage policy of government which provides social wages (such as old-age pensions and child support grants) seems to have played an important role as a source of income for most households in the traditional and urban informal areas. These sources of income are not enough, however, as these households turn to diversify livelihoods into agriculture and off-farm activities. To address this, in an effort to achieve economic restructuring and poverty alleviation, government should increase its momentum in the provision of incentives to households in these settlement types to assist them in venturing into businesses, most especially in the provision of financial and skills development support to small, medium and micro enterprises (SMMEs).
Acknowledgements
This paper builds on the research project funded by the National Development Agency in 2014 entitled 'The state of poverty and its manifestation in the nine provinces of South Africa'.
Authors' contributions
J.M. and C.N. worked on the original report and conceptualised the paper; M.M. and S.J. participated in data analysis and editing of the manuscript.
References
1. World Bank. World development report 2008. Washington DC: The World Bank; 2007. [ Links ]
2. Barrett CB, Reardon T, Webb P. Nonfarm income diversification and household livelihood strategies in rural Africa: Concepts, dynamics, and policy implications. Food Policy. 2001;26(4):315-331. http://dx.doi.org/10.1016/s0306-9192(01)00014-8 [ Links ]
3. Minot N, Epprecht M, Thi T, Anh T, Trung Q. Income diversification and poverty in the northern uplands of Vietnam. Washington DC: International Food Policy Research Institute; 2006. [ Links ]
4. Meyer W, Mollers J, Buchenrieder G. Does non-farm income diversification in Northern Albania offer an escape from rural poverty? [document on the Internet]. [ Links ] c2008 [cited 2016 Dec 19]. Available from: http://nbn-resolving.de/urn:nbn:de:gbv:3:2-11375
5. Ibrahim H, Rahman SA, Envulus EE, Oyewole SO. Income and crop diversification among farming households in a rural area of north central Nigeria. J Trop Agric Food Environ Extension. 2009;8(2):84-89. [ Links ]
6. Ersado L. Income diversification in Zimbabwe: Welfare implications from urban and rural areas. Washington DC: World Bank; 2003. [ Links ]
7. Keeton G. Inequality in South Africa. Journal of the Helen Suzman Foundation. 2014; 74:26-31. [ Links ]
8. Awoniyi OA, Salman KK. Non-farm income diversification and welfare status of rural household in South West Zone of Nigeria. Washington DC: International Food Policy Research Institute; 2008. [ Links ]
9. Fausat AF. Income diversification determinants among farming household in Konduga, Borno state, Nigeria. Acad Res Int. 2012; 2(1):555-561. [ Links ]
10. Adebayo CO, Akogwu GO, Yisa ES. Determinants of income diversification among farm households in Kaduna State: Application of Tobit regression model. Prod Agric Technol J. 2012;8(2):1-10. [ Links ]
11. Perret SR. Poverty and diversity of livelihood systems in post-apartheid rural South Africa: Insights into local levels in the Eastern Cape Province. Pretoria: Department of Agricultural Economics, Extension and Rural Development, University of Pretoria; 2001. [ Links ]
12. Perret S, Anseeuw W, Mathebula N. Poverty and livelihoods in rural South Africa. Investigating diversity and dynamics of livelihoods: Case studies in Limpopo. Number 05/01. Battle Creek, MI: Kellogg's Foundation; 2005. [ Links ]
13. Chitiga-Mabugu M, Ngepah N, Nhemachena C, Motala S, Mathebula J, Mupela E. The state of poverty and its manifestation in the nine provinces of South Africa. Johannesburg: National Development Agency; 2014. [ Links ]
14. Loison SA. Rural livelihood diversification in sub-Saharan Africa: A literature review. J Dev Stud. 201551(9):1125-1138. http://dx.doi.org/10.1080/00220388.2015.1046445 [ Links ]
15. Hilson G. Farming, small-scale mining and rural livelihoods in sub-Saharan Africa: A critical overview. Extractive Ind Soc. 2016;3(2):547-563. http://dx.doi.org/10.1016/j.exis.2016.02.003 [ Links ]
16. Barrett C. Rural poverty dynamics: Development policy implications. Paper presented at: International Conference for Agricultural Economists; 2003, Aug 17-23; Durban, South Africa. [ Links ]
17. Hosu S, Mushunje A. Optimizing resource use and economics of crop- livestock integration among small farmers in semiarid regions of South Africa. Agroecol Sustain Food Syst. 2013;37(9):985-1000. http://dx.doi.org/10.1080/21683565.2013.802755 [ Links ]
18. Jayne TS, Chamberlin J, Headey DD. Land pressures, the evolution of farming systems, and development strategies in Africa: A synthesis. Food Policy. 2014;48:1-17. http://dx.doi.org/10.1016/j.foodpol.2014.05.014 [ Links ]
19. Headey D, Jayne TS. Adaptation to land constraints: Is Africa different? Food Policy. 2014;48:18-33. http://dx.doi.org/10.1016/j.foodpol.2014.05.005 [ Links ]
20. Schwarze S, Zeller M. Income diversification of rural households in Central Sulawesi, Indonesia. Quar J Int Agric. 2005;44(1):61-74. [ Links ]
21. Chitiga-Mabugu M, Nhemachena C, Karuaihe S, Motala S, Tsoanamatsie N, Mashile L. Civil society participation in income generating activities in South Africa. Johannesburg: National Development Agency; 2013. [ Links ]
22. Alemu ZG. Livelihood strategies in rural South Africa; Implications for poverty reduction. Foz do Iguacu: Zarihun Gudeta Alemu; 2012. [ Links ]
23. Barber BM, Odean T, Zheng L. Out of sight, out of mind: The effects of expenses on mutual fund flows. Journal of Business. 2005;78(6):2095-2119. [ Links ]
24. Block S, Webb P The dynamics of livelihood diversification in post-famine Ethiopia. Food Policy. 2001;26(4):333-350. http://dx.doi.org/10.1016/S0306-9192(01)00015-X [ Links ]
25. Zhao J, Barry PJ. Implications of different income diversification indexes: The case of rural China. Econ Bus Lett. 2013;2(3):13-20. http://dx.doi.org/10.17811/ebl.2.1.2013.13-20 [ Links ]
26. Tuomisto HA. Diversity of beta diversities: Straightening up a concept gone away. Part 1. Defining beta diversity as a function of alpha and gamma diversity. Ecography. 2010;33:2-22. http://dx.doi.org/10.1111/j.1600-0587.2009.05880.x [ Links ]
27. Statistics South Africa (StatsSA). Income and expenditure of households 2010/2011. Pretoria: StatsSA; 2012. Available from: http://www.statssa.gov.za/publications/P0100/P01002011.pdf [ Links ]
28. Statistics South Africa (StatsSA). Investigation into appropriate definitions of urban and rural areas for South Africa: Discussion document. Report no. 03-02-20. Pretoria: StatsSA; 2001. [ Links ]
 Correspondence:
Jabulani Mathebula
jabulani.hazel@gmail.com
Received: 09 Mar. 2016
Revised: 05 July 2016
Accepted: 15 Aug. 2016
FUNDING: None

