


Services on Demand
Article
 English (pdf)
 Article in xml format
 Article references
Indicators

Related links
-
 Cited by Google
 -
 Similars in Google
Share

 Permalink
South African Journal of Science
On-line version ISSN 1996-7489
Print version ISSN 0038-2353
S. Afr. j. sci. vol.112 n.11-12 Pretoria Nov./Dec. 2016
http://dx.doi.org/10.17159/sajs.2017/20160136
RESEARCH ARTICLE
A morphometric analysis of hominin teeth attributed to Australopithecus, Paranthropus and Homo
Susan J. Dykes
Evolutionary Studies Institute, School of Geosciences, University of the Witwatersrand, Johannesburg, South Africa
ABSTRACT
Teeth are the most common element in the fossil record and play a critical role in taxonomic assessments. Variability in extant hominoid species is commonly used as a basis to gauge expected ranges of variability in fossil hominin species. In this study, variability in lower first molars is visualised in morphospace for four extant hominoid species and seven fossil hominin species. A size-versus-shape-based principle component analysis plot was used to recognise spatial patterns applicable to sexual dimorphism in extant species for comparison with fossil hominin species. In three African great ape species, variability occurs predominantly according to size (rather than shape), with the gorilla sample further separating into a male and a female group according to size. A different pattern is apparent for the modern human sample, in which shape variability is more evident. There is overlap between male and female modern humans and some evidence of grouping by linguistic/tribal populations. When fossil hominin species are analysed using equivalent axes of variance, the specimens group around species holotypes in quite similar patterns to those of the extant African great apes, but six individual fossil molars fall well outside of polygons circumscribing holotype clusters; at least three of these specimens are of interest for discussion in the context of sexual dimorphism, species variability and current species classifications. An implication of this study is that, especially in the case of modern humans, great caution needs to be exercised in using extant species as analogues for assessing variability considered to be a result of sexual dimorphism in fossil hominin species.
SIGNIFICANCE:
• Caution should be exercised in using modern analogue species as proxies for fossil hominin species variability.
• Exceptionally wide ranges of molar variability between certain fossil hominin specimens currently allocated to the same species might indicate possible misclassification.
• Molar morphology in gorillas tends to reflect primarily size, rather than shape, variability between the sexes, which is a consideration in the context of assessing possible sexual dimorphism in fossil hominin species.
Keywords: Plio-Pleistocene; molar variability; taxonomy; log sem; analogue species
Introduction
Previous research has established that analyses of dental metrics and morphology on the post-canine dentition of extant hominoids are reasonably successful at differentiating between specimens at the species level and even at the subspecies/regional level.1-7 Likewise, in the fossil hominin context, molar crown size, shape and cusp arrangements have traditionally been used as diagnostic tools to help to identify specimens attributed to different species of Australopithecus, Paranthropus and Homo.8-14However, taxonomic decisions cannot always be made with accuracy, particularly when the fossil record is incomplete, and boundaries between species are sometimes very indistinct.15 It is common to use observed variability ranges in extant species as proxies for the quantification of expected variability in similar fossil species (for example, extant hominoids are often used as analogues for extinct hominins), but some caution needs to be observed in doing so.16 Certain species, such as gorillas and orangutans, are known to be highly sexually dimorphic. In terms of their dental morphometrics, Uchida1-2 has noted that although teeth vary greatly in size between the sexes, there are no significant differences between male and female gorillas and orangutans in terms of molar shape, in the context of their mean shape indices and cusp proportions. In the case of modern Homo sapiens, however, size differences are known to occur along regional or biogeographical lines, and although there may be regional variability and some sexual dimorphism in each region, certain groups globally have extremely large ('megadont') molars, while other groups have very small ('microdont') teeth by comparison.17-19
If molar morphology is linked to form and function, as researchers such as Kay20 and Ungar21 have postulated, then size reduction and shape changes are more likely to have occurred as a result of selective pressures over time in modern H. sapiens as diets and subsistence lifestyles have diverged between groups over millennia. Indeed, studies conducted on femora of modern human groups with differing lifestyles (e.g. hunter-gatherer; sedentary/ farming; small-scale farmers) have noted that variability occurs as a function of subsistence lifestyle.22,23 Other researchers have confirmed that this form-function variation along subsistence lifestyle lines is also found in molar metric variability as a result of long-standing divergences in diet in some groups after the Neolithic Revolution. As diets have become predominantly based on soft cereals and higher levels of cooking and food processing, tooth reduction has generally occurred in these groups19,24-27, while other groups, such as Australian Aboriginal hunter-gatherers/terrestrial foragers, have retained large, robust molars17,18,28. Dietary and subsistence-lifestyle histories may not be the only factors at play in determining the wide variability in size and shape of modern human molars, but the fact remains that although there may be measures of sexual dimorphism within biogeographical groups individually,29 if molar morphology were to be viewed in morphospace in the same way as that of other hominoids, while gorilla teeth should separate (by species/sub-species) into a male group and a female group primarily by size,1 modern human teeth would be expected to group by biogeographical population or by historical subsistence lifestyle divergences initially, and by sex thereafter.
In the case of Pan species, variation between the lower first molars of common chimpanzees and bonobos is linked to allometry, such that when the effects of allometry are factored out, 'chimpanzee and bonobo molars are not morphometrically distinguishable'7. It is not within the scope of this study to correct for allometry, but because mandibular molar morphometrics are strongly correlated with size in Pan, a visualisation in morphospace using size as the first principal component axis should achieve a good degree of discrimination between these two closely related species.
The aim of this study was to build upon previous studies by using geometric morphometric methods to provide a visual analysis of size-versus-shape variability patterns in the post-canine dentition of extant hominoid species and their implications for the analysis of molar variability within and between fossil hominin species. The goal was to obtain a general understanding, not only of patterns of size-versus-shape variability in the lower first molars of African ape species, but also of how these African ape variability patterns differ to those observed in H. sapiens. Understanding this difference is important because the typically high ranges of variability in modern human skeletal elements (including teeth) are often used as benchmarks for quantifying the expected range of variability in skeletal elements of fossil hominin species, and further, in species such as Australopithecus afarensis, modern human-like sexual dimorphism is cited as the primary factor to explain such high variability between specimens of this species.30,31 In this context, Ferguson32 strongly emphasises the need to take into account factors such as globalisation and differences in self-domestication between modern human populations before comparing dental variation between a fossil hominin species such as Au. afarensis and modern H. sapiens. His conclusion is that dental variation in modern H. sapiens is 'not evidence of normal dental variation in hominids'32. The aim of the present study was to provide a visualisation of both the range of variability and, more importantly, the pattern of general size/shape variability that would be expected of selected hominoid species, in the context of sexual dimorphism.
In particular, the following specific questions are addressed:
• Do specimens of selected extant hominoids group in morphospace in a way that confirms previous research (using a size-versus-shape principal components analysis to visualise the main axes of variability), particularly in the context of sexual dimorphism?
• Does the pattern of variability in morphospace (size versus shape) of modern H. sapiens differ from that of extant African great apes?
• Using equivalent principal components axes (size versus shape), do fossil hominin lower first molars group in morphospace in a similar way to those of gorillas, other African great apes, or modern H. sapiens, and if so, what conclusions should be drawn from these groupings?
• Are there certain instances in the fossil hominin record where the lower first molars of individual specimens attributed to a particular hominin species differ so significantly in size and/or shape from those of the other specimens in the group (including the type specimen or holotype of the species) that these specimens warrant further discussion in respect of species variability, sexual dimorphism or potential misclassification?
The aim of the present study was thus to test the predictions (1) that sexual dimorphism should be observable between lower first molars of male and female Gorilla gorilla gorilla, primarily according to size; (2) that variability between lower first molars of male and female modern humans may follow a different pattern in morphospace to that of African great ape species, possibly being observable primarily along biogeographical lines, and only secondarily according to sex; and (3) that certain specimens in the fossil hominin record may appear as outliers from the typical individuals of their species, raising the possibility of misclassification.
Materials and methods
Digital two-dimensional images of 40 lower first molars (occlusal crown images) from 20 (10 male, 10 female, both antimeres) individuals each of Gorilla gorilla gorilla, Pan troglodytes schweinfurthii, Pan paniscus (from the Royal Museum for Central Africa in Tervuren, Belgium), and modern Homo sapiens (from the R. A. Dart Collection of the University of the Witwatersrand, Johannesburg, South Africa) were analysed to determine variability within and between species, and between sex within species, for comparison with 36 African Plio-Pleistocene lower first molars from 27 individuals [including five holotypes (Australopithecus afarensis, Australopithecus africanus, Paranthropus robustus, Homo habilis and Homo erectus) as well as Peninj 1, which is a mandibular proxy for the holotype of Paranthropus boisei]. Because all of the fossil specimens were from African Plio-Pleistocene hominin species, African great apes and modern humans from southern Africa were selected for comparative purposes.
Two-dimensional imagery was chosen for the study because holotypes of certain of the fossil hominin species were extremely worn (e.g. Au. afarensis and P. boisei), and would not have been able to be included in a three-dimensional analysis, but these specimens were still usable in a study relying on landmark analyses wherein homologous cusp intersections at the perimeter of the occlusal crown view were still discernible. Coupled with a geometric approach to landmarking the surfaces of the crowns, this enabled more fossil specimens (including holotypes and proxies thereof) to be included in the study, even if most of the topography and surface features on the crowns were worn or obliterated. Right antimeres were mirrored to appear as left molars.
Where possible, antimeres were included, because in many individuals there is odontometric asymmetry, which has been linked to tooth eruption patterns, masticatory loads and laterality (handedness) in modern humans.33-35 As this asymmetry is generally manifested in the form of dimension differences between the two sides, the inclusion of antimeres enabled observations of the potential cause of spatial patterning differences to be controlled for, between sex as well as hemisphere, because for the fossil sample (where sex is unknown but laterality is known), in some cases only left lower molars or right lower molars were available, and to select only left or right specimens would cause a significant reduction in n for an already limited fossil hominin sample. Details for the specimens used are given in Tables 1-3.
Photographic and image-processing methods
Digital photographs were taken using a Nikon D3200 digital SLR 24-megapixel camera, with an adjustable scale bar placed in each image at the height of the plane of the occlusal crown surface. The tooth being photographed was centred orthogonally below the lens of the camera, well in the centre of the frame of the image, and was aligned in the horizontal using the cervical plane as a horizontal guide; however, because it was not always possible to verify this plane, particularly along the buccolingual axis, and where immersion in levelled sand was not advisable because of the delicate nature of the specimens, visual alignment of the vertical lingual and buccal crown edges was used. The accuracy of the horizontal/vertical alignment of the tooth was tested by using three- to two-dimensional image superimpositions, wherein three two-dimensional digital images, taken for the same tooth at different times, were each inserted into the correct plane of a three-dimensional image of the same tooth using Amira® software, after which differences in the x-, y- and z-axes between the three alignments were measured. The resultant error (averaging 0.014° along the x-axis, 0.107° along the y-axis and 0.098° along the z-axis) was considered to be within acceptable limits, after correlations of landmark measurements at varying degrees of tilt had previously established that errors of tilt of up to 2° from the horizontal produced a correlation coefficient of 0.99 in relation to the same measurements at zero tilt. For purposes of the analyses and the landmark placements, the digital images were each aligned horizontally on screen along the longitudinal axis of the tooth, using the protocols of Wood9 and Goose62 as guidelines for this alignment (taking into account the 'normal' alignment62 of the tooth in question as well as that of its immediate neighbours). A rectangle was superimposed over the image in the form of a bounding box (using Adobe Illustrator®) to act as a proxy for the mesiodistal (minimum) diameter and the buccolingual (maximum) diameter, respectively, according to definitions by Wood9. The centre of the bounding box was then calculated for purposes of a fan overlay placement, which would serve as a basis for the placement of landmarks at each 15° interval around the perimeter of the occlusal crown shape. The alignment and the position of this mathematical centre point were subjected to inter-observer tests for accuracy (average error: 0.295% in the x-axis and 0.316% in the y-axis).
Landmarking method
Five Type I (homologous or 'anatomical') landmarks63 were sited at the intersection of each of the cusps at the perimeter outline of the occlusal crown surface in the image, and a further 44 Type III (mathematical or 'constructed') landmarks63 were placed in such a way as to define (1) the buccolingual and mesiodistal diameters of each tooth (four landmarks placed on a bounding box enclosing the tooth plus a fifth at the mathematical centre of the bounding box); (2) the peripheral shape of the tooth (24 landmarks, every 15° around the tooth perimeter); and (3) the orientation of the cusps (five landmarks denoting the midpoint between cusp intersections and five landmarks measured equidistantly from the central landmark to the centre of the cusp arc at the perimeter, along the midline of the cusp, with a further five landmarks equidistant between these central cusp landmarks; in cases where a diagnostic sixth cusp was evident, the landmark normally sited midway between the landmarks at the centre points of the entoconid and the hypoconulid was sited instead at the midpoint between the landmark at the centre of the entoconid and the landmark at the intersection between the sixth cusp and the hypoconulid at the perimeter, so that the landmark would be sited over the sixth cusp). The position of the landmarks is shown in Figure 1.

The images were scaled and landmarks digitised using ImageJ® software and processed via Microsoft Excel® into IBM SPSS® and Morphologika® for purposes of performing Procrustes superimposition, principal components analyses and discriminant function analyses. Lastly, a custom-written macro for MS Excel®, named 'Professor Regressor'64 was created to produce a high-speed throughput of pairwise regressions for purposes of conducting log sem analyses to determine average conspecific variation.65
Methods: Analyses
A principal components analysis (PCA) was first performed on the sample from the four extant species' lower first molars in Morphologika after performing a generalised Procrustes superimposition wherein specimens are translated, rotated and scaled and then plotted on a graph showing the main axes of differentiation from a 'consensus' tooth; a second PCA was conducted using 'Procrustes form space', wherein size is factored back into the analysis by including the log of the centroid size for each shape as a variable in the analysis.66 This second PCA thus provides a 'size-shape' analysis, aimed at visualising differentiation between similarly shaped, but differently sized, molars (e.g. male and female gorilla molars) on the graph. In a form space analysis, size becomes the predominant factor of variance along the first principal component (PC) axis (the x-axis). The second PC axis (the y-axis) summarises the main shape differences between specimens, statistically independently of size.67 In the case of the extant species, PC2 summarised the primary shape variation to be a function mainly of relative breadth of the occlusal surface (high to low mesiodistal:buccolingual ratios), together with aspects of cusp orientation and perimeter shape differences. When fossil specimens were added to the analysis, examination of the thin plate spline warps for higher-order PCs showed that PC3 accounted for almost exactly the same variability factors as PC2 had done in the analysis for the extant species alone (relative breadth, cusp orientation and perimeter shape), and for all PC plots involving fossil specimens PC3 was selected as the y-axis component of the plot.
Thereafter, a discriminant function analysis (DFA) was carried out using the first eight PC scores on the four extant species and fossils together. The number of PC scores to include was decided on the basis of a sensitivity test to determine the minimum number of PC scores needed before the four extant species in the analysis were classified 100% correctly. The data were previously verified as being normally distributed, using a Shapiro-Wilk test.
A further analysis of intra-species variability was carried out using the 'log sem' methodology pioneered by Thackeray et al.68 The basic premise behind this analysis is that within any one species, skeletal variability falls within a certain range, and although the range varies from species to species, there is an average range or central tendency of variability across species in general, that approaches what Thackeray et al.15,65,69 call an approximation of a biological species constant (T=-1.61), and a comparison between any two specimens of unknown species group can be compared against this figure to establish a statistical probability of conspecificity68,70. To calculate the log sem values, pairwise regressions of measurements for specific skeletal elements are conducted, firstly with specimen A on the x-axis and specimen B on the y-axis, and then with specimen B on the x-axis with specimen A on the y-axis. The standard error of the slope m is calculated for the regression equation y=mx+c, and this is then log transformed to provide two paired log sem values, with the difference between the two values being designated as 'delta log sem'.64,65 Specimens of a similar size from the same species will be expected to have very low log sem values, because the standard error of the slope is a measure of 'scatter' around the regression slope between the two specimens, and there should be a high degree of correlation between points along a regression line for two specimens with similar shape, with more predictable expected y-values as a result; and because the specimens are similarly sized, both of the slopes would approach a gradient of 1, and the x-on-y and y-on-x values would be barely distinguishable from each other, thus the delta value should also be low. However, two specimens from different species with large shape and size differences between them will not only be poorly correlated in terms of shape (the standard error of the slope would be larger, as a result of the large amount of scatter around both lines), giving a high log sem value in at least one of the two slopes, but the delta value between the two log sem values would be high, as the two slopes for each pairwise comparison would have very different gradients as a result of the size differences.
A total of 760 pairwise comparisons of conspecific pairs of lower first molars of G. gorilla, P. troglodytes, P. paniscus and H. sapiens were analysed using measurements taken radially from the centre of the tooth to the landmark points as described above. A further 252 pairwise comparisons of conspecific pairs of lower first molars of the fossil hominin species were analysed, and the average species variability was compared against the average obtained for the extant species groups. After exclusion of any atypical (potentially misclassified) outlier specimens from the analysis, the remaining 176 pairwise comparisons of conspecific pairs were averaged and the results again compared with the results for the extant species groups.
Results
Sexual dimorphism in gorillas identified in morphospace
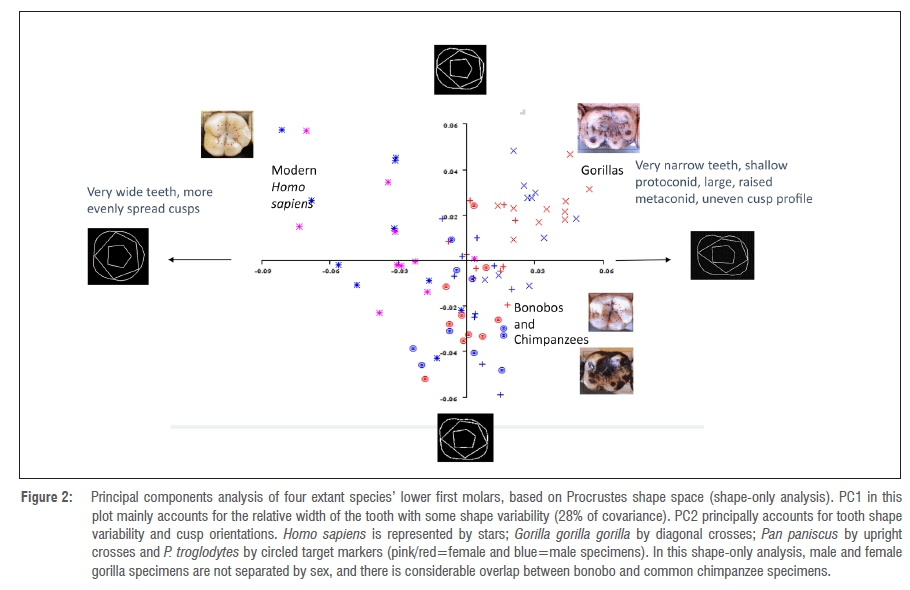
Three main clusters in morphospace are detectable from the four extant species' samples using a shape-only PCA (Figure 2). Modern H. sapiens exhibit a high degree of shape variability, and have generally relatively wider lower first molars than those of the great apes (Figure 2). Gorilla molars exhibit a distinctive shape, while those of bonobos and common chimpanzees exhibit overlap in the PCA because their molars are less distinguishable between species in terms of shape when scaling is used (Figure 2).
As expected, sexual dimorphism is not evident even within the highly sexually dimorphic gorilla sample in the shape-only analysis, which suggests that lower first molars of male and female gorillas do not vary significantly in their shape. This finding confirms those of previous studies.1,2 The second PCA, in which size was factored back into the analysis, is shown in Figure 3.
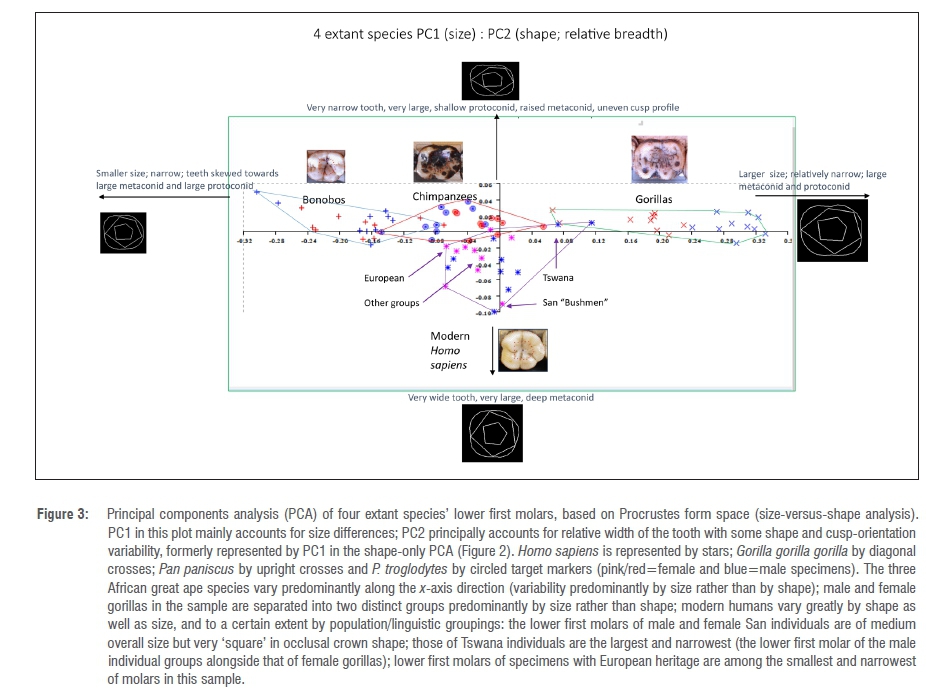
In Figure 3 (size versus shape), all four species are now relatively separate (as the inclusion of size now allows a better separation of bonobos from common chimpanzees). Additionally, there is a very clear separation between male gorillas and female gorillas as a result of differences in size of lower first molars (but as has been seen, not in overall shape).
Modern Homo sapiens: Shape variability by population group
All three African great ape species seem to have a limited range of shape variability within the species/subspecies selected for this study, which fall within narrow limits in terms of their relative length:breadth ratio (relative breadth of crown and cusp arrangements being the primary factors of variation shown along the y-axis). It is evident that the most variable within-species group is the modern H. sapiens sample, which varies mostly in overall proportion and shape (y-axis), rather than overall size (x-axis). On further analysis, the variability within this group appears to occur not primarily by sex (as in the gorilla sample, falling as it does into two distinct groups according to sex) but by biogeographical groupings, with teeth from the African San population being relatively square in shape (those from both male and female individuals), and those from the African Tswana group being very large and relatively very narrow in overall proportion - in fact, the teeth from two male Tswana individuals, chosen to represent megadont populations for the analysis, group with the female gorilla sample on the size-shape PC analysis because they are much larger and narrower.
When the same size-shape PC analysis as that applied to extant hominoid species is then applied to include the fossil hominin lower first molar sample (with the same shape parameters selected for the y-axis as were used for the extant species alone), the African great apes all group similarly as they had before - largely above the x-axis (narrow teeth), with size being the main source of variance between species and between male and female gorillas. The modern human sample again varies largely along the y-axis (wider range of shape variance - from wide to narrow across the breadth of the tooth) and most of the fossil specimens group in the bottom right quadrant (larger and wider teeth, as would be expected). Paranthropus species seem to follow a gorilla-like grouping parallel to the x-axis (variability being predominantly according to size), with this species exhibiting tight cohesion as a well-defined group on the plot, while Au. afarensis specimens exhibit wider variance along both size and shape axes, with individuals overlapping with modern H. sapiens, H. erectus and Au. africanus (Figure 4).
After removing the extant species from the PCA plot, a much clearer picture of shape versus size variability in morphospace is obtained for the fossil hominin species. There is generally good discrimination between species, around their holotypes or holotype proxies (Figure 5).
The distribution of specimens within species groups in this plot shows groupings visually akin to those in the shape-size analysis of the PCA plot of the extant African ape species. The group of Paranthropus spp. (P. robustus in green squares and P. boisei in brown squares) cluster along the x-axis in a similar pattern to the gorilla sample (predominantly varying in size rather than shape). The fact that they seem additionally to group in two size clusters (smaller teeth on the left, larger on the right) might possibly hint at sexual dimorphism within this group, as with the gorillas. Specimens from H. erectus, the species with the smallest molars in the analysis, cluster visually in morphospace in a similar manner to bonobos.
In the case of Au. afarensis, the majority of specimens cluster horizontally around the holotype (varying mainly by size, parallel to the x-axis, in a similar manner to the gorilla grouping in morphospace), but two specimens fail to cluster with their group.
Anomalous 'outliers'
Six specimens among the 36 fossil hominin lower first molars failed to group in morphospace with the clusters located around the holotypes for each species.
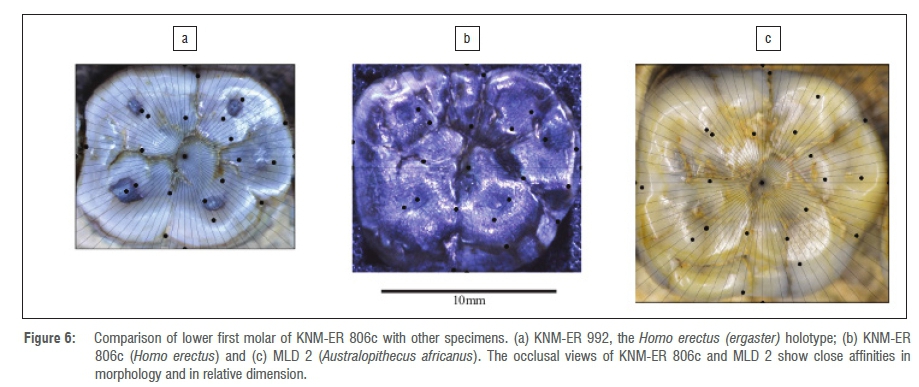
One outlier from the main cluster of H. erectus in morphospace is KNM-ER 806c, a specimen with wider buccolingual dimensions than the generally smaller and narrow molars typical of this species. This specimen also has a sixth and seventh cusp, a protostylid and a morphology extremely similar to that of the lower first molar of MLD 2, currently classified as Au. africanus.
Other specimens that do not seem to be typical of their species (which otherwise cluster well in morphospace) are Sts 52b, which groups with Au. afarensis rather than with Au. africanus; OH 16, which is wider, buccolingually, than the holotype of H. habilis, into which it has been classified; and KNM-ER 15930, which has been attributed to P. boisei but which is well outside of the normal size range for this species, being closer to the 'early Homo' group.
Notably, there are two specimens from Au. afarensis which group well away from the cluster around the holotype of the species in morphospace. At first glance, the Au. afarensis sample seems to mirror the spatial distribution of Paranthropus and gorillas, with several specimens clustering around the holotype (LH 4) in a polygon suggesting more size variability than shape variability. The first atypical outlier, LH 2, which is from a juvenile from the Laetoli area of Tanzania, groups closely with the Au. africanus cluster, being larger than the remaining specimens in the species group, and relatively more narrow in overall dimension. The second, AL 288-1, 'Lucy', groups into the quadrant in which H. erectus is located, but is even smaller in dimension than specimens clustering in this group.
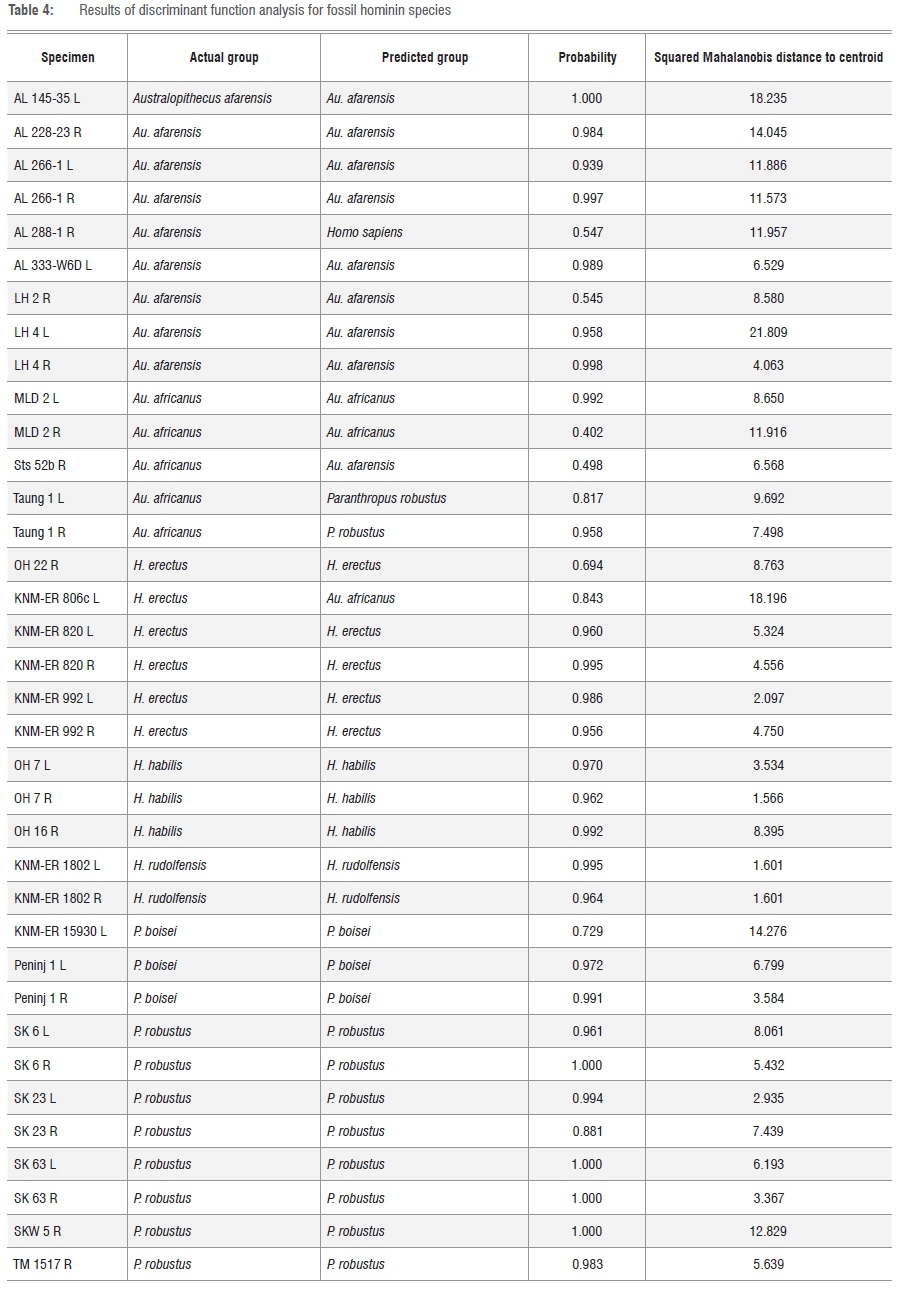
A DFA conducted on all 116 specimens in the study confirmed that for the four extant species, the most variability was exhibited between specimens in the modern H. sapiens group as demonstrated by the mean squared Mahalanobis distance from the group centroid (modern H. sapiens: mean = 9.69±4.41 (n=20); G. g. gorilla: mean = 6.0±3.51 (n=20); P. t. schweinfurthii: mean = 4.51±1.94 (n=20); P. paniscus: mean = 5.36±3.20 (n=20)). For the fossil hominin species, the DFA confirmed that as a group, Au. afarensis was most variably distributed, with a mean squared Mahalanobis distance of specimens from their group centroid at 12.075±5.52 (n=9). P. robustus, with a mean of 6.49±3.11 (n=8) seems again to parallel the gorilla sample in terms of variability. P. boisei, with only three specimens in the sample, had a high mean Mahalanobis distance from the group centroid at 8.22±5.49 (n=3), as a result of the huge size difference between the smallest in the group (KNM-ER 15930) and the large Peninj molars that are more typical of this megadont species. The H. erectus group's mean squared Mahalanobis distance was also fairly high at 7.28±5.76 (n=6), but, if the one outlier (KNM-ER 806c) is excluded from the sample, this group, otherwise very homogeneous, would have a much lower mean distance from the centroid, as this single outlier's distance from the group centroid was 18.20. Another fossil hominin group with a high mean Mahalanobis distance from the group centroid was Au. africanus at 8.87±2.07 (n=5).
With respect to group classification predictions for individual specimens in the fossil hominin species, the DFA output confirms the anomalous status of AL 288-1 (grouped with H. sapiens because of its narrowness and relatively tiny size). KNM-ER 806c is predicted to classify, unsurprisingly, with the Au. africanus group, because of its extreme similarity with MLD 2. The third potential misclassification in this analysis is Sts 52b, which is more predictably classified as Au. afarensis, confirming the PCA plot results. One other instance of potential misclassification according to the DFA was that of Taung 1 (left and right antimeres), which classifies more readily with Paranthropus. However, this apparent anomaly is because this specimen has an obvious sixth cusp, and was landmarked with six cusps accordingly. The C6 or 'tuberculum sextum'10,71-73 is diagnostic of Paranthropus spp., and all the specimens attributed to P robustus and P boisei were landmarked for this cusp, so it is not surprising that Taung 1 groups with the paranthropines.
Table 4 presents the summary of the results for the fossil hominin specimens. The full table, including the 80 extant species specimens, is provided in the supplementary material.
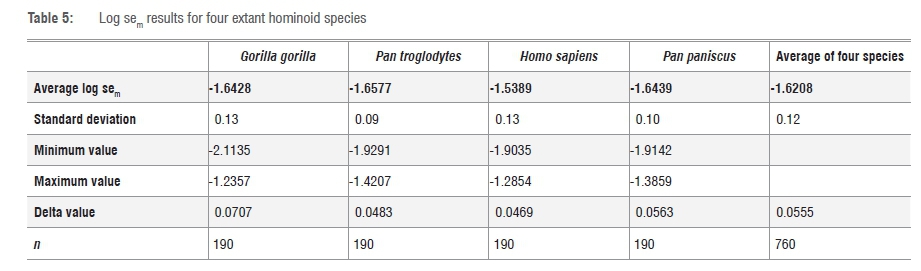
The results of the log sem pairwise comparisons for the four extant hominoid species confirmed the results of the PCA plot: the widest ranges of values were shown by G. g. gorilla (low degree of shape, but high degree of size, and disparity between the smallest female and the largest male specimen, i.e. low average log sem value coupled with high delta value) and by H. sapiens (most variability in shape, rather than size, of all four species, i.e. high average log sem value with lower delta value). The average log sem value for all conspecific comparisons was -1.6208, which is only a very slightly lower value than the average central tendency of average log sem values for conspecific specimens of -1.61 as calculated by Thackeray69. The results are presented in Table 5.
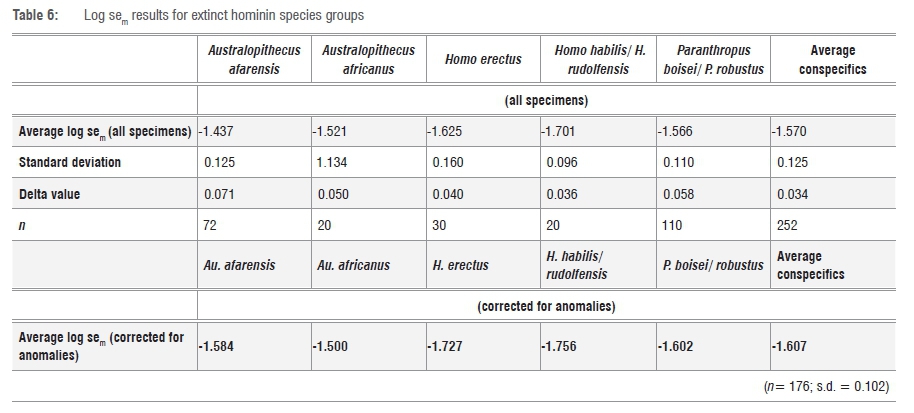
Log sem results similarly calculated for the lower first molars of fossil hominins included in the study also confirmed the PCA results and the DFA species-wide distributions of squared Mahalanobis distances. Au. afarensis, with its main 'holotype-like' group and two outliers/anomalies - one significantly tiny and narrow by comparison with the holotype, and the other more in the range of Au. africanus in dimension - had the highest average log sem and delta values of all the species (indicating both shape and size disparity within the group as currently classified). Specifically, Al 288-1 ('Lucy') had a log sem value of -1.278 in a pairwise comparison with LH 4 (the holotype of the species) and the equivalent value for LH 2 against LH 4 was -1.486. This result confirms the DFA results, in that the group mean log sem showed extreme variability between specimens in the species sample, but that AL 288-1 was the specimen most likely not to be conspecific with LH 4. H. erectus and other early Homo species were the most cohesive of the groups, despite anomalous specimens in each group that both tended more towards Au. africanus in dimension. In particular, KNM-ER 806c was the main anomaly in the H. erectus group, with a log sem value of -1.396, in comparison to KNM-ER 992 (the holotype of the species). The mean value for this group is -1.625±0.16 (n=30 pairwise comparisons), but if KNM-ER 806c had been excluded from the group, the mean value would have been -1.727.
The results for the species groups including and excluding the six anomalous specimens as identified by the PCA are presented in Table 6. Once the anomalous specimens are removed from the analysis, the mean log sem value for conspecific comparisons is -1.607, with a standard deviation of 0.102 (n=176 pairwise comparisons), which is very much in line with Thackeray's mean log sem value of -1.61 with a standard deviation of 0.230 for 70 species.69
Discussion
Sexual dimorphism evident in gorilla lower first molars
Lower first molars of male and female gorillas are undifferentiated in morphospace in a shape-only PCA (Figure 2), but are well separated when size is factored back into the analysis in a shape-and-size PCA (Figure 3). There was no overlap at all along the x-axis (PC1 accounting mainly for size) between male and female gorillas in the sample used for this analysis, with molars of all female gorillas being smaller than all molars belonging to male gorillas. The implication is that shape is not a determining factor in distinguishing between sexes within this sample from G. g. gorilla, but rather, the main difference is in the size of the molars. Bonobo lower first molars and common chimpanzee lower first molars similarly group together in morphospace in a shape-only analysis (Figure 2); but in a shape-and-size analysis (Figure 3), while separation is achieved between the species on the basis of size differences, there is no marked separation evident between male and female individuals, as there is with gorillas.
Variability between molars of Homo sapiens
The modern human molars included in the analysis showed the greatest within-species variability of the four species included in the study (Figure 2). When size was included in the analysis (Figure 3), these molars still failed to cluster closely, because of differences in relative mesiodistal:buccolingual ratios (relative width of the teeth) and in overall shape. Not only do modern human molars vary more in shape than the other modern African ape species according to the PC analyses, but molars belonging to male and female humans are not differentiated in the same way as gorilla molars are in morphospace within the species as a whole (distinct groups of male and female individuals).
On further inspection, shape and size variability of both male and female humans is noted at the level of individual population groups: the male and female San individuals in the sample both have molars with almost equal mesiodistal and buccolingual diameters (they appear almost square in the occlusal view), while the molars of the megadont male Tswana individual in this study were large and relatively narrow and overlapped with the smallest female gorilla teeth in the shape-and-size PCA. Molars of individuals with European heritage were among the smallest in the sample.
This finding would seem to fit with previous studies which have suggested that because modern humans have migrated globally and different populations have followed variable histories of subsistence lifestyles and diet, tooth size has evolved biogeographically.17,26,28 Tooth size reduction, in particular, has occurred in specific regions (particularly Europe, North Africa, the Levant and the Anatolian area) as a result of changes from hunter-gatherer lifestyles to semi-sedentary herding, and particularly to large-scale farming lifestyles. This change in lifestyle involving sedentary or urban living has resulted in increased consumption of soft cereals and more efficient food-processing and cooking technologies, which set these groups on a different dietary trajectory from hunter-gatherer societies since the Neolithic Revolution.24-27 Stark odontometric differences are also reflected in other skeletal elements such as femora (with European groups having long, gracile femora, with hunter-gatherers and certain Bantu groups having more robust, shorter femora.22,23) In the small sample chosen for this study, there are representatives from populations whose lifestyles, until recently, have revolved around hunter-gathering (the San), small-scale subsistence herder-agriculturalists (Tswana and Sotho), and sedentary/ post-Neolithic large-scale farmers (individuals with European heritage).
Fossil 'outliers'
In all, from the PCA plot, there appears to be six lower first molar specimens that do not seem to cluster in morphospace with their own species groups: (1) AL 288-1 and (2) LH 2 (from Au. afarensis); (3) Sts 52b, which has been allocated to Au. africanus but whose classification has been questioned within this group by other researchers74,75; (4) OH 16, classified as H. habilis but which is notably larger and wider than the holotype and has been likened to molars of Au. africanus in size50; (5) KNM-ER 15930, which is classified into P. boisei but which is extremely tiny by comparison with the typically megadont examples of this species; and (6) KNM-ER 806c, classified as H. erectus,9but visually almost identical to (albeit slightly smaller than) MLD 2 - this particular specimen is currently classified as Au. africanus but has been identified as a 'larger-toothed' specimen,42 and one of a group of specimens being considered for reclassification into a 'second species', Au. prometheus.42
Three of these specimens - Sts 52b, OH 16 and KNM-ER 15930 - are in species groups with low sample numbers in this study, and so it is difficult to draw firm conclusions. H. habilis as a species has been challenged since its first introduction into the literature; KNM-ER 15930 may represent extreme sexual dimorphism in P. boisei, as postulated by Leakey and Walker52. The status of the specimens representing Au. africanus in general warrants some further comment, as Taung 1 appeared to be anomalous in the context of the DFA, alongside Sts 52b. Unfortunately, the species in this particular study was represented by only five molars from three individuals, each of which has been the object of some discussion as to its inclusion within the species. Firstly, Taung 1, which is the holotype, has a sixth cusp more typical of Paranthropus, and its inclusion within the group of 'robust australopithecines' has been previously discussed by researchers.76 MLD 2 has characteristics associated with Au. africanus, including a protostylid, but its attribution to Au. africanus has recently been reconsidered by Clarke42. Sts 52b is a slightly damaged molar with a great deal of wear, but certain researchers have confirmed the anomalous status noted in this study of the specimen.42,74,75 The high mean Mahalanobis distance for this species might be explained by the heterogeneity of this sample.
The other three anomalous specimens from the PCA are interesting for further discussion regarding potential misclassification and/or unusually high variability within one single species, as currently defined.
The striking morphological similarities between KNM-ER 806c (currently attributed to H. erectus but grouping closely with Au. africanus both on the PCA and the DFA) and MLD 2 (Au. africanus - or possibly Au. prometheus42) can be seen in Figure 6. In view of this similarity, and the dissimilarity of KNM-ER 806c with its current species holotype, KNM-ER 992, it would be interesting in future to look at comparisons of other molars of KNM-ER 806 to see with which species they group best.
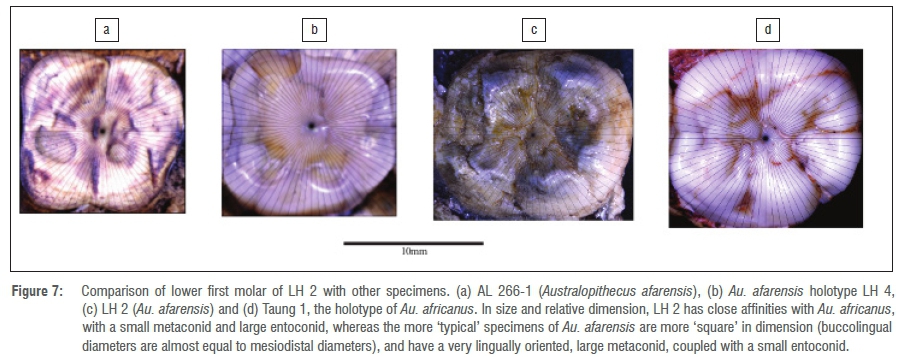
Two of the atypical specimens identified from the shape-and-size PCA are currently classified into Au. afarensis. The first of these, LH 2, is from a juvenile mandible from Laetoli. In the PCA plots, LH 2 groups consistently towards Au. africanus in morphospace, being more robust in size and less square in relative dimensions in the occlusal view than the typical Au. afarensis molars, as shown in Figure 7. Morphologically, LH 2 shares lower first molar occlusal crown characteristics similar to those of Taung 1, the holotype of Au. africanus.
The second atypical specimen currently classified as belonging to the Au. afarensis species group is AL 288-1, or 'Lucy'. This molar clusters well away from the holotype of Au. afarensis (LH 4) in all of the PCAs, and this apparent misclassification is supported by the DFA and the log sem analysis.
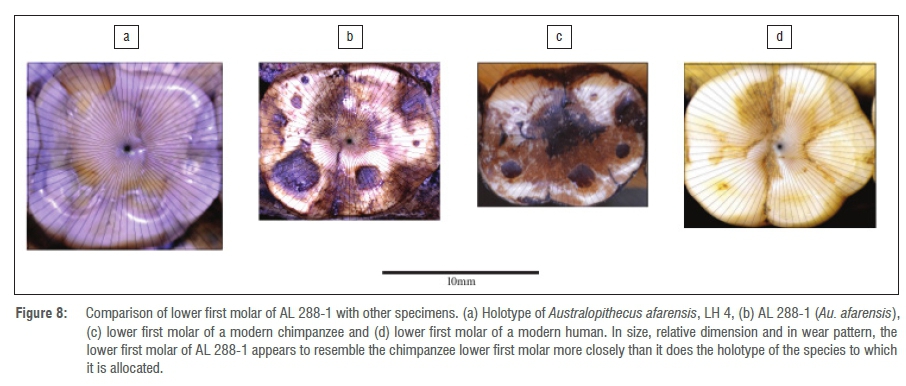
Donald Johanson, the team leader for the discovery of this specimen and whose PhD thesis was on primate molars, remarked that 'Lucy' was more chimpanzee-like37,77 than the other specimens ultimately attributed to Au. afarensis, with an 'odd lower jaw', which he initially assigned to a different species than that assigned to the typically larger and squarer Hadar molars and those of the mandible from Laetoli, LH 4 (eventually designated as the holotype for Au. afarensis). Without wishing to suggest that the mandible of AL 288-1 is indeed from a chimpanzee, what is clear from the PCA plots of the occlusal crown morphometrics of the relatively tiny and narrow lower first molar of this specimen, is that the positions where this specimen consistently plots, away from the holotype group, would seem to add a point of initial agreement with Johanson that 'Lucy is different'77. Figure 8 shows occlusal views of the lower first molar of AL 288-1 between LH 4 (Au. afarensis holotype) on the one side, and of a chimpanzee and a modern human on the other side.
With these two outliers grouping in different directions in morphospace away from the holotype cluster, it might be interesting to revisit the question of how much variability is normal within any one species. Leonard and Hegmon78 have suggested that, based on P3 morphology, vast differences between certain specimens can be explained if female individuals of the species were subject to different selective pressures than male individuals. This conclusion is rejected by Ferguson32. Perhaps, as Schmid argues79, Lucy does not belong to the same species as the presumed 'males' of the species; or there may be more than one morphotype in this hypodigm.
Conclusions
Gorilla gorilla gorilla is well established as a highly sexually dimorphic species, and in the analyses the lower first molars demonstrate well-defined size differences between male and female individuals. However, as with the other two African great ape species in the study, the degree of shape variability is reasonably limited, particularly with respect to the mesiodistal:buccolingual proportions of the teeth in general. When extinct hominin species' lower first molars are landmarked and plotted in a similar analysis, species such as H. erectus and other early Homo specimens seem to follow the spatial variability patterning of extant ape species such as P. paniscus and P. troglodytes. Paranthropus species' lower first molars group together in morphospace within a limited range in respect of shape, but show some size disparity that is reminiscent of the way G. g. gorilla specimens clustered laterally on the shape-versus-size pCa plot. At first glance, Au. afarensis also shows signs of gorillalike shape similarity, clustering around the very square-shaped holotype, the main difference being size variability (therefore possibly showing some sexual dimorphism observable by size differences rather than excessive shape variance between specimens), but on closer analysis, two very significant anomalies are plotted well away from the main cluster. The only other extant species group that displays such stark within-species shape and size differences in the analysis as a whole is the modern H. sapiens group, but unlike the African ape species and the fossil hominin species, modern H. sapiens has migrated globally, with individual groups exploiting extremely diverse environments and practising subsistence lifestyles that diverged from each other at least 12 000 years ago. In areas where farming groups have been exposed to soft cereals and have utilised more varied food-processing and cooking technologies than hunter-gatherers since the Neolithic Revolution, facial and tooth-size reduction have been reported (for example in Europe, the Middle East, North Africa and Anatolia). As this kind of dietary and subsistence lifestyle divergence within a single species cannot be applied by proxy as the cause of the range of variability seen between the molars of Au. afarensis, it might be argued that some measure of caution should be exercised before using modern H. sapiens as an analogue species for comparisons of ranges of variability in molar size and shape in fossil hominin species. If a more cautious approach is taken, a species with an arguably similar-sized range and dietary options available to it should ideally be chosen upon which to assess a likely range of variability of molar shape and the effects thereon of sexual dimorphism within a species. Based on the manner in which the molars of gorillas (the most sexually dimorphic species in the study) plot in morphospace, it could therefore be argued that anomalies or outliers from main species groupings that do not follow a similar clustering pattern (size variability, with limited shape variability) might indicate that some fossil hominin species as currently defined either consist of two (or three) distinct morphotypes within the same species, or that specimens currently attributed to single species belong, in fact, to several different species, or simply that certain specimens may have been wrongly classified. Future studies should include sample sizes that are enlarged sufficiently to encompass the full range of variability of extant species included in the study before confirming such conclusions. The sample representing the fossil species should also be expanded so that each species is adequately represented.
Acknowledgements
Grateful acknowledgement is made to the National Research Foundation of South Africa (grant number 102169), the DST-NRF Centre of Excellence in Palaeosciences (D2015/01SD) and the Palaeontological Scientific Trust (PAST) for their financial support in ongoing research into this subject. This work was also further supported by the National Research Foundation via Professor J Francis Thackeray, to whom I owe a great debt of gratitude for his supervisory support and for facilitating visits to collections in Tervuren, Nairobi and Dar es Salaam to acquire images for this study. The curators and managers from these collections and those in Johannesburg (University of the Witwatersrand) and Pretoria (Ditsong Museum) are also gratefully acknowledged. Appreciation is also given to numerous scholars who assisted with supervision, 3D images, training and other advice. Thanks to my husband for generous support and to my children, in particular, Richard, who helped develop 'Professor Regressor', without which I would probably still be manually conducting pairwise regression comparisons.
References
1. Uchida A. Variation in tooth morphology of Gorilla gorilla. J Hum Evol. 1998;34:55-70. http://dx.doi.org/10.1006/jhev.1997.0186 [ Links ]
2. Uchida A. Variation in tooth morphology of Pongo pygmaeus. J Hum Evol. 1998;34:71-79. http://dx.doi.org/10.1006/jhev.1997.0187 [ Links ]
3. Pilbrow VC. Dental variation in African apes with implications for understanding patterns of variation in species of fossil apes. New York: New York University; 2003. [ Links ]
4. Pilbrow VC. Patterns of molar variation in great apes and their implications for hominin taxonomy. In: Bailey SE, Hublin J-J, editors. Dental perspectives on human evolution. New York: Springer; 2007. p. 9-32. http://dx.doi.org/10.1007/978-1-4020-5845-5_2 [ Links ]
5. Pilbrow VC. Population systematics of chimpanzees using molar morphometrics. J Hum Evol. 2006;51:646-662. http://dx.doi.org/10.1016/j.jhevol.2006.07.008 [ Links ]
6. Pilbrow VC. Dental and phylogeographic patterns of variation in gorillas. J Hum Evol. 2010;59:16-34. http://dx.doi.org/10.1016/j.jhevol.2010.01.009 [ Links ]
7. Singleton M, Rosenberger AL, Robinson C, O'Neill R. Allometric and metameric shape variation in Pan mandibular molars: A digital morphometric analysis. Anat Rec. 2011;294(2):322-334. http://dx.doi.org/10.1002/ar.21315 [ Links ]
8. Bailey SE, Wood B. Trends in postcanine occlusal morphology within the hominin clade: The case of Paranthropus. In: Bailey SE, Hublin J-J, editors. Dental perspectives on human evolution: Dordrecht: Springer; 2007. p. 3352. http://dx.doi.org/10.1007/978-1-4020-5845-5_3 [ Links ]
9. Wood B. Koobi Fora Research Project. Volume 4: Hominid cranial remains. Oxford: Clarendon Press; 1991. [ Links ]
10. Wood B, Abbott SA. Analysis of the dental morphology of Plio-Pleistocene hominids. I: Mandibular molars: Crown area measurements and morphological traits. J Anat. 1983;136(1):197-219. [ Links ]
11. Wood B, Abbott SA, Graham SH. Analysis of the dental morphology of Plio-Pleistocene hominids. II: Mandibular molars - Study of cusp areas, fissure pattern and cross sectional shape of the crown. J Anat. 1983;137:287-314. [ Links ]
12. Wood B, Engleman CA. Analysis of the dental morphology of Plio-Pleistocene hominids. V: Maxillary postcanine tooth morphology. J Anat. 1988;161:1-35. [ Links ]
13. Gómez-Robles A, Bermúdez de Castro JM, Martinón-Torres M, Prado-Simón I, Arsuaga JL. A geometric morphometric analysis of hominin upper second and third molars, with particular emphasis on European Pleistocene populations. J Hum Evol. 2012;63(3):512-526. http://dx.doi.org/10.1016/j.jhevol.2012.06.002 [ Links ]
14. Gómez-Robles A, Martinón-Torres M, Bermúdez de Castro JM, Margvelashvili A, Bastir M, Arsuaga JL, et al. A geometric morphometric analysis of hominin upper first molar shape. J Hum Evol. 2007;53(3):272-285. http://dx.doi.org/10.1016/j.jhevol.2007.02.002 [ Links ]
15. Thackeray JF, Odes E. Morphometric analysis of early Pleistocene African hominin crania in the context of a statistical (probabilistic) definition of a species. Antiquity. 2013;87:1-2. [ Links ]
16. Ackermann RR. Using extant morphological variation to understand fossil relationships: A cautionary tale. S Afr J Sci. 2003;99:255-258. [ Links ]
17. Hanihara T, Ishida H. Metric dental variation of major human populations. Am J Phys Anthropol. 2005;128:287-298. http://dx.doi.org/10.1002/ajpa.20080 [ Links ]
18. Kieser JA. Human adult odontometrics: The study of variation in adult tooth size. Cambridge: Cambridge University Press; 1990. http://dx.doi.org/10.1017/CBO9780511983610 [ Links ]
19. Dempsey PJ, Townsend GC. Genetic and environmental contributions to variation in human tooth size. Heredity. 2001;86:685-693. http://dx.doi.org/10.1046/j.1365-2540.2001.00878.x [ Links ]
20. Kay RF, Hiiemae KM. Jaw movement and tooth use in recent and fossil primates. Am J Phys Anthropol. 1974;138:136-148. http://dx.doi.org/10.1002/ajpa.1330400210 [ Links ]
21. Ungar PS. Dental topography and diets of Australopithecus and early Homo. J Hum Evol. 2004;46:605-622. http://dx.doi.org/10.1016/j.jhevol.2004.03.004 [ Links ]
22. Püschel TA, Benítez HA. Femoral function adaptation: a comparison between hunter gatherers and farmers using geometric morphometrics. Int J Morphol. 2014;32(2):627-633. http://dx.doi.org/10.4067/S0717-95022014000200041 [ Links ]
23. Siddiqi N. Comparison of osteometric femoral bone dimensions among the South Africans of different ethnic groups and South African whites. Egypt J For Sci. 2013;3:8-14. http://dx.doi.org/10.1016/j.ejfs.2012.11.001 [ Links ]
24. Dahlberg AA. The dentition of the first agriculturalists (Jarmo, Iraq). Am J Phys Anthropol. 1960;18:243-256. [ Links ]
25. Emes Y,Aybar B, Yalcin S. On the evolution of human jaws and teeth: A review. Bull Int Assoc Paleodont. 2011;5(1):37-47. [ Links ]
26. Pinhasi R, Eshed V, Shaw P. Evolutionary changes in the masticatory complex following the transition to farming in the Southern Levant. Am J Phys Anthropol. 2008;135:136-148. http://dx.doi.org/10.1002/ajpa.20715 [ Links ]
27. Pinhasi R, Eshed V, Von Cramon-Taubadel N. Incongruity between affinity patterns on mandibular lower dental dimensions following the transition to agriculture in the near East, Anatolia and Europe. PLoS One. 2015;10(2):e0117301. http://dx.doi.org/10.1371/journal.pone.0117301 [ Links ]
28. Campbell TD. Dentition and palate of the Australian Aboriginal. Adelaide: Hassell Press; 1925. [ Links ]
29. Schwartz GT, Dean C. Sexual dimorphism in modern human permanent teeth. Am J Phys Anthropol. 2005;128:312-317. http://dx.doi.org/10.1002/ajpa.20211 [ Links ]
30. Reno PL, Meindl RS, McCollum MA, Lovejoy CO. Sexual dimorphism in Australopithecus afarensis was similar to that of modern humans. Proc Natl Acad Sci USA. 2003;100(16):9404-9409. http://dx.doi.org/10.1073/pnas.1133180100 [ Links ]
31. Reno PL, McCollum MA, Meindl RS, Lovejoy CO. An enlarged postcranial sample confirms Australopithecus afarensis dimorphism was similar to modern humans. Philos Trans R Soc Lond Ser B Biol Sci. 2010;365:3355-3363. http://dx.doi.org/10.1098/rstb.2010.0086 [ Links ]
32. Ferguson WW. Critique of 'Australopithecus afarensis' as a single species based on dental metrics and morphology. Primates. 1989;30(4):561-569. http://dx.doi.org/10.1007/BF02380881 [ Links ]
33. Martinez-Gomis J, Lujan-Climent M, Palau S, Bizar J, Salsench J, Peraire M. Relationship between chewing side preference and handedness and lateral asymmetry of peripheral factors. Arch Oral Biol. 2009;54(2):101-107. http://dx.doi.org/10.1016/j.archoralbio.2008.09.006 [ Links ]
34. Veloso-Durán A, Vazquez-Salceda MC, López-Jiménez J, Veloso-Durán M, Puigdollers A. A correlation between permanent tooth eruption pattern and the predominance of the motor function laterality. Med Oral Patol Oral Cir Bucal. 2014;19(5):473-477. http://dx.doi.org/10.4317/medoral.19567 [ Links ]
35. Heikkinen T, Alvesalo L, Osborne RH, Tienari J. Tooth eruption symmetry in functional lateralities. Arch Oral Biol. 2001;46(7):609-617. http://dx.doi.org/10.1016/S0003-9969(01)00019-X [ Links ]
36. White TD, Johanson DC. Pliocene hominid mandibles from the Hadar formation, Ethiopia: 1974-1977 collections. Am J Phys Anthropol. 1982;57:501-544. http://dx.doi.org/10.1002/ajpa.1330570405 [ Links ]
37. Johanson DC, Taieb M. Plio-Pleistocene hominid discoveries in Hadar, Ethiopia. Nature. 1976;260:293-297. http://dx.doi.org/10.1038/260293a0 [ Links ]
38. Kimbel WH, Johanson, DC, Coppens Y. Pliocene hominid cranial remains from the Hadar formation, Ethiopia. Am J Phys Anthropol. 1982;57:453-499. http://dx.doi.org/10.1002/ajpa.1330570404 [ Links ]
39. Leakey MD, Hay R, Curtis GH, Drake RE, Jackes MK, White TD. Fossil hominids from the Laetoli beds. Nature. 1976;262:460-466. http://dx.doi.org/10.1038/262460a0 [ Links ]
40. White TD. New fossil hominids from Laetolil, Tanzania. Am J Phys Anthropol. 1977;46(2):197-229. http://dx.doi.org/10.1002/ajpa.1330460203 [ Links ]
41. Dart RA. The Makapansgat proto-human Australopithecus prometheus. Am J Phys Anthropol. 1948;6(3):259-284. http://dx.doi.org/10.1002/ajpa.1330060304 [ Links ]
42. Clarke RJ. Latest information on Sterkfontein's Australopithecus skeleton and a new look at Australopithecus. S Afr J Sci. 2008;104:443-449. [ Links ]
43. Broom R, Robinson JT, Schepers GWH. Sterkfontein ape-man Plesianthropus. Transvaal Mus Mem. 1950;4:502-505. [ Links ]
44. Dart RA. Australopithecus africanus; The man-ape from South Africa. Nature. 1925;115:195-199. http://dx.doi.org/10.1038/115195a0 [ Links ]
45. Rightmire GP Middle Pleistocene hominids from Olduvai Gorge, northern Tanzania. Am J Phys Anthropol. 1980;53(2):225-241. http://dx.doi.org/10.1002/ajpa.1330530207 [ Links ]
46. Leakey REF. Further evidence of Lower Pleistocene hominids from East Rudolf, North Kenya, 1971. Nature. 1972;237:264-269. http://dx.doi.org/10.1038/237264a0 [ Links ]
47. Leakey REF, Wood BA. New evidence of the genus Homo from East Rudolf, Kenya II. Am J Phys Anthropol. 1973;39(3):355-368. http://dx.doi.org/10.1002/ajpa.1330390304 [ Links ]
48. Leakey LSB. Recent discoveries at Olduvai Gorge. Nature. 1960;188:1050-1052. http://dx.doi.org/10.1038/1881050a0 [ Links ]
49. Leakey LSB. The juvenile mandible from Olduvai. Nature. 1961;191:417-418. http://dx.doi.org/10.1038/191417a0 [ Links ]
50. Leakey LS, Tobias PV Napier JR. A new species of genus Homo from Olduvai Gorge. Nature. 1964;202(4):424-427. http://dx.doi.org/10.1038/202007a0 [ Links ]
51. Day MH, Leakey REF, Walker AC, Wood BA. New hominids from East Turkana, Kenya. Am J Phys Anthropol. 1976;45:369-435. http://dx.doi.org/10.1002/ajpa.1330450304 [ Links ]
52. Leakey REF, Walker AC. New Australopithecus boisei specimens from East and West Lake Turkana, Kenya. Am J Phys Anthropol. 1988;76(1):1-24. http://dx.doi.org/10.1002/ajpa.1330760102 [ Links ]
53. Tobias PV. The early Australopithecus and Homo from Tanzania. Anthropologie Paris. 1965;3:43-48. [ Links ]
54. Broom R, Robinson JT. Swartkrans ape man: Paranthropus crassidens. Transvaal Mus Mem. 1952;6:1-123. [ Links ]
55. Robinson JT. The dentition of the Australopithecinae. Transvaal Mus Mem. 1956;9:i-i79. [ Links ]
56. Grine FE, Daegling DJ. New mandible of Paranthropus robustus from Member 1, Swartkrans Formation, South Africa. J Hum Evol. 1993;24:319-333. http://dx.doi.org/10.1006/jhev.1993.1024 [ Links ]
57. Broom R. The Pleistocene anthropoid apes of South Africa. Nature. 1938;142:377-379. http://dx.doi.org/10.1038/142377a0 [ Links ]
58. Grine FE, Ungar PS, Teaford MF, El-Zaatari S. Molar microwear in Praeanthropus afarensis: Evidence for dietary stasis through time and under diverse paleoecological conditions. J Hum Evol. 2006;51(3):297-319. http://dx.doi.org/10.1016/j.jhevol.2006.04.004 [ Links ]
59. Wood B, editor. Wiley-Blackwell encyclopedia of human evolution 2. New York: John Wiley & Sons; 2011. [ Links ]
60. Pickering R, Kramers JD. Re-appraisal of the stratigraphy and determination of new U-Pb dates for the Sterkfontein hominin site, South Africa. J Hum Evol. 2010;59(1):70-86. http://dx.doi.org/10.1016/j.jhevol.2010.03.014 [ Links ]
61. Groves CP, Mazak V. An approach to the taxonomy of the hominidae: Gracile Villafranchian hominidae of Africa. Casopis pro Mineralogia Geologii. 1975;20:225-247. [ Links ]
62. Goose DH. Dental measurement: An assessment of its value in anthropological studies. In: Brothwell DR, editor. Dental anthropology. New York: Pergamom Press; 1963. http://dx.doi.org/10.1016/B978-0-08-009823-4.50012-4 [ Links ]
63. Dryden IL, Mardia KV. Statistical shape analysis. Michigan: John Wiley & Sons; 1998. [ Links ]
64. Dykes SJ, Dykes R. 'Professor regressor': A computer programme for rapid processing of large sets of pairwise regression analyses in palaeolontological contexts. Palaeontol Afr. 2015;49:53-59. [ Links ]
65. Thackeray JF, Dykes SJ. Morphometric analyses of hominoid crania, probabilities of conspecificity and an approximation of a biological species constant. HOMO - J Comp Hum Biol. 2016;67(1):1-10. http://dx.doi.org/10.1016/j.jchb.2015.09.003 [ Links ]
66. Mitteroecker P Gunz P Windhager S, Schaefer K. A brief review of shape, form and allometry in geometric morphometrics, with applications to human facial morphology. Hystrix: Ital J Mammal. 2013;24(1):59-66. [ Links ]
67. Mitteroecker P Gunz P Bernhard M, Schaefer K, Bookstein FL. Comparison of cranial ontogenetic trajectories among great apes and humans. J Hum Evol. 2004;46:679-698. http://dx.doi.org/10.1016/j.jhevol.2004.03.006 [ Links ]
68. Thackeray JF, Bellamy CL, Bellars D, Bronner G, Bronner L, Chimimba C, et al. Probabilities of conspecificity: Application of a morphometric technique to modern taxa and fossil specimens attributed to Australopithecus and Homo. S Afr J Sci. 1997;93(4):195-196. [ Links ]
69. Thackeray JF. Approximation of a biological species constant? S Afr J Sci. 2007;103:489. [ Links ]
70. Thackeray JF. Probabilities of conspecificity: An application of a morphometric approach to extant and extinct hominoids. In: Strkalj G, Pather N, Kramer B, editors. Voyages in science essays by South African anatomists in honour of Phillip V Tobias' 80th birthday. Pretoria: Content Solutions; 2005. [ Links ]
71. Hillson S. Dental anthropology. Cambridge: Cambridge University Press; 1996. http://dx.doi.org/10.1017/CBO9781139170697 [ Links ]
72. Aiello L, Dean C. An introduction to human evolutionary anatomy. London: Academic Press; 2002. http://dx.doi.org/10.1016/B978-0-08-057100-3.50017-1 [ Links ]
73. Braga J, Thackeray JF. Early Homo at Kromdraai B: Probabilistic and morphological analysis of the lower dentition. Comptes Rendus Palevol. 2003;2:269-279. http://dx.doi.org/10.1016/S1631-0683(03)00044-7 [ Links ]
74. Kimbel WH, White TD. Variation, sexual dimorphism and the taxonomy of Australopithecus. In: Grine FE, editor. Evolutionary history of the 'robust' australopithecines. New York: Aldine de Gruyter; 1988. p. 259-268. [ Links ]
75. Fornai C, Bookstein FL, Weber GH. Second maxillary molars confirm a dimorphism of Australopithecus at Sterkfontein Member 4. Paper presented at: European Society for the Study of Human Evolution Third Annual Meeting; 2013 September 19-21; Vienna, Austria. [ Links ]
76. Tobias PV. South African australopithecines in time and hominid phylogeny, with special 21reference to dating and affinities of the Taung skull. In: Jolly C, editor. Early hominids of Africa. London: Duckworth; 1978. p. 45-84. [ Links ]
77. Johanson DC, Edey MA. Lucy - the beginnings of mankind. London: Penguin Books; 1990. [ Links ]
78. Leonard WR, Hegmon M. Evolution of P3 morphology in Australopithecus afarensis. Am J Phys Anthropol. 1987;73(1):41-63. http://dx.doi.org/10.1002/ajpa.1330730105 [ Links ]
79. Schmid P editor How different is Lucy? In: Hominidae: Proceedings of the 2nd International Congress of Human Paleontology; 1987 September 28-October 03; Turin, Italy. Milan: Jaca Book; 1989. [ Links ]
 Correspondence:
Susan Dykes
Susan.Dykes@students.wits.ac.za
Received: 09 May 2016
Revised: 19 Aug. 2016
Accepted: 06 Sep. 2016
FUNDING: DST-NRF Centre of Excellence in Palaeosciences; National Research Foundation (South Africa); Palaeontological Scientific Trust (PAST)

