


Services on Demand
Article
 English (pdf)
 Article in xml format
 Article references
Indicators

Related links
-
 Cited by Google
 -
 Similars in Google
Share

 Permalink
South African Journal of Science
On-line version ISSN 1996-7489
Print version ISSN 0038-2353
S. Afr. j. sci. vol.112 n.11-12 Pretoria Nov./Dec. 2016
http://dx.doi.org/10.17159/sajs.2016/20160065
RESEARCH ARTICLES
Deriving cues from human cognition for the modelling of shack boundaries in aerial imagery
Moreblessings Shoko; Julian L. Smit
Department of Geomatics, University of Cape Town, Cape Town, South Africa
ABSTRACT
Organic studies inspire cues for modelling logic in image processing and become a basis for the development of novel remote-sensing algorithms. Examples of applications of such paradigms include the growing application of techniques such as object-oriented analysis and neural networks in image analysis for which the logic was drawn from studying various components of organic systems in the human body. Here we document a key investigation based on a set of cognitive tests conducted using aerial imagery captured over Cape Town (South Africa). These tests were conducted to later draw parallels with a feature extraction algorithm for shack settlements. We found that the visual variables of 'pattern' and 'shape' display the most significant cognitive guide for shack boundary extraction. Although the focus here was on digital imagery, learning points can be selected for application in other scientific fields as well.
SIGNIFICANCE:
• Provides an interest point for several image-processing and computer vision sciences.
• Contributes to geospatial studies and helps improve mapping and imaging initiatives.
• Directed towards solving the challenges that urban governors face in slum management.
Keywords: geospatial; organic models; remote sensing; urban governance
Introduction
Organic or biological systems offer great models for imitating and learning from in the development of important technologies.1 A classic example of this concept is flying - inspired by birds - on which aerial photogrammetry is based. Another example is graphic cable connectors whose titles 'male' or 'female' are inspired by human anatomy.2 Similarly, in the earth observation based science of remote sensing, a range of ideas has been developed based on the behaviour of organic systems. Recently there has been a growing interest in relating the human ability to view and comprehend phenomena at different scales to feature extraction approaches on image-processing platforms.3 Inspiration from the human visual system is significant in imaging efforts simply because the end user of most imagery is the human eye itself, therefore mimicking its optical capability creates an opportunity for optimised artificial intelligence.
In this paper, we focus on the spatial cognition of imagery with the aid of the human visual system. We do not deal in depth with the psychology of cognition but simply observe and summarise the image interpretation trends from three sets of tests conducted on focus groups. This observation is done in order to derive inspiration for use later in formulating logical processing steps, particularly for the extraction of informal settlements units from 2005 imagery flown in an aerial photogrammetry project over Cape Town, South Africa. The main objective of the study was therefore to develop a cognitive test kit that can be used to assess human visual interpretation of urban aerial imagery in order to derive cues for use in algorithm development. The algorithms to be developed are for a later study based on feature extraction. These algorithms will be used to extract and delineate detail such as the boundaries of informal settlements units and the living area extents from imagery using learning points from the cognitive tests discussed here. A particular focus is placed on extraction of informal settlements in urban imagery within the Cape Town data.
Informal settlements are of interest as they are a growing urban challenge. Many governors who seek to manage the proliferation of this urban typology require up-to-date information on their seeding and growth. This information can be spatial or attribute in nature. Spatial information comes in the form of map products that can be generated from image data as well as other in-situ data collection techniques. Imaging data such as aerial images provide significant product advantages over in-situ data collection techniques which are costly and time consuming. One of the main advantages of image data is applicability to image-processing functions that allow map generation to occur faster should optimum feature extraction algorithms be available. In this study, the target environments for end feature extraction were informal areas within 250-mm resolution urban imagery.
Informal settlements present a complex imaging scene with multiple land uses mixed closely in a small area of coverage. This scenario is a challenge to geo-information scientists who often are faced with the need to constantly update their feature extraction algorithms to match changing user requirements. In order to overcome these challenges, we propose a perspective that derives inspiration from the human visual system and its interpretation of urban aerial imagery. The learning points from the human interpretation of aerial imagery yield cues that are later imitated in an informal settlements land-cover classification algorithm. This end product classification algorithm is later implemented towards the creation of informal settlements maps or atlases that provide useful spatial information for stakeholders in the urban management matrix. The current study achieves its primary objective through documenting a detailed procedure of the development of a cognitive test kit in the form of a simple set of experimental exercises. These cognitive exercises draw inference from the human interpretation of 250-mm resolution optical imagery that contains scenes extracted from both formal and informal areas of the city by studying interpretation trends in the focus groups. Results from such studies can find much relevance in improving mapping and cartographic applications. There is also much application of this work in cue generation for robotics and artificial intelligence. Vehicle or human navigation and way finding would also benefit greatly from the outcomes of this study. It is envisioned that the results derived through this research will be highly applicable to a broad spectrum of computer vision based applications.
Spatial cognition and the human visual system
Several researchers have documented the use of cognition in trying to decipher key image interpretation concepts using different testing approaches.4-7 The limitation of these earlier studies is that most focused on the interpretation of general urban image scenes with very little attention paid to scenes containing the informal settlements component of urban fibre. Moreover, the target applications for these earlier studies have often been cartographic in nature with limited use of cognitive studies in linking to developing an organically inspired feature extraction algorithm. Here we specifically use observations from cognitive tests to inspire a novel algorithm for informal settlements extraction using aerial imagery from the City of Cape Town.
Informal settlements are an unstructured component of urban fibre. They are characterised by a somewhat random and irregular settlement environment that grows rapidly to dense nucleation. The human visual system on the other hand is much like other organic systems in biology. It is made up of millions of cells that are born, reproduce and grow. In addition to having metabolic characteristics, such organic systems are an intriguing combination of a scale-space environment in which there can be infinite levels of detail of sets of system components. By this description, an organic system of cells that grow close together to maturity is metaphorically similar to informal settlements. Informal settlements can be described as organic settlements as their nature mimics organic growth. In the same way in which organic tissue operates, these settlements are born (inception); require nutrition (mending of structures); move (unpredictable shift of shack locations); excrete (inhabitants require sanitation services); grow (rapidly change over time); reproduce (multiply to consolidation); sense their environment (this points to the fact that they represent an informal land rights or cadastral system with rules to avoid conflict) and die (some parts or entire informal settlements disappear with time). Several organic systems behave in the manner described here, and hence show morphological similarities with informal settlements. The human visual system was selected out of these numerous organic systems to draw inspirational parallels with the informal settlements environments because of its direct link to image interpretation. It is the human eye that consumes the imagery on which these unstructured settlements are often captured; therefore the human visual system is an ideal choice for inspiration and cue derivation.
The human visual system works in relation with the human cognitive system which coordinates the mental processes that take place as the mind digests visual detail captured by the eye. However, the scope of this study is not to study cognition in depth, but to capitalise on the growing trends that appreciate the strength of cognitive abilities as a foundation for robust image interpretation. Although cognitive research itself is not significantly documented in remote sensing and imaging sciences, it is well appreciated as being important in improving the understanding of the image interpretation process in remote sensing.4-7 Cognitive abilities have also been used extensively in the related disciplines of cartography and environmental perception.8 It is important to note that geospatial images and maps are among the most efficient media for communicating spatial knowledge, especially in unfamiliar environments.9 They come with a diverse array of image parameters - such as dimensionality, resolution, orientation, accuracy, colour and theme - that become unique inputs in the human cognition computation when they are used to optimise feature identification. The image vantage point or perspective and visual realism are also key parameters worth mentioning that impact on knowledge extraction and cognition when using geospatial images. While vantage point focuses on the angle at which the navigator views the image, visual realism measures how closely an image itself represents the real world. Images themselves can be available in different formats - such as vertical, panoramic and oblique (low and high) - or ground-based representations often in two or three dimensions that also impact on the realism parameter. All these image parameters mentioned above, together with other factors, collectively influence how information is extracted and cognitively relayed by the user in both analogue and digital environments. Research has shown that even additional parameters such as viewer or navigator sex or age can also impact on image interpretation for spatial cognition. Male subjects for example typically outperform female subjects on tasks dealing with mental rotation and spatial navigation, whereas female subjects tend to perform better on tasks dealing with object location, relational object location memory and spatial working memory.10
Various other studies have also documented how cognitive theories and paradigms give substance to the psycho-spatial process of how humans visualise or navigate through urban spatial environments in both two and three dimensions. To begin with, cognitive models for imaging applications are often formulated based on comparative experiments and exercises that test human visual and cognitive abilities on different types and forms of images or models. For example, Walther et al.11 gave an interesting illustration of the growing capabilities of computer vision choices by simulating human vision concepts. The authors proposed that on entering a crowded classroom in order to localise and recognise someone, humans look around and scan everyone's faces without paying much attention to the interior design and room's furniture. However, when entering the same classroom with the intention of finding an available desk, humans look at the same scene, and yet their perception is skewed toward the arrangement of the furniture, and they mostly ignore the people present. This illustration shows that developing object-specific models of image interpretation can allow for adjustments by shifting the requirement parameters towards first extracting features of different interest. This shows the diversity and capabilities of human cognition for image interpretation and mapping.
The entire concept of human cognitive mapping is broad and cannot be fully captured in this study alone. Particularly, it refers to a series of psychological transformations by which an individual acquires, stores, recalls and decodes information about the relative locations and attributes of phenomena in their spatial environment.12 Cognitive theories on facets such as way-finding and location identification using images or maps of the built environment summarise a repeated process that humans undertake daily within and between structures using both simple and complex mental encoding and decoding. When the image or map surrounding is familiar to the viewer, an internal cognitive map is recalled to facilitate what may ordinarily appear as a low-level task of interpretation. This internal map is simple in nature - it is not perfect; it is sketchy and somewhat distorted as it is derived from experiences and not precise measurements of the earth. This internal map is said to be characterised by four domains - recognition, prediction, evaluation and action - that assert its basic processing in the human mind.13 However, when the viewer is in unfamiliar surrounds, a significant portion of the human cerebral system is employed into a more complex cognitive mental process. This shows a relationship between what the human visual system consumes and what the cognitive system then formulates. Making simple observations of how users behave as they relate the two systems can create interesting cues for algorithm development.
In contrast, there are also instances in which spatial cognitive abilities fail or are impaired, as medical experts have documented.14 Such discussions show the importance of images of varying dimensionality as important tools in aiding spatial cognition in unfamiliar and familiar environments. The specifications of the images themselves contribute greatly to improved cognitive abilities. The mental process of how the human brain encodes and decodes data required to interpret location for the image test kits developed and tested in the study is described in the method below.
Materials and methods
Cities and built environments create interesting image outputs that capture some of the most complex relations between human constructed objects. As summarised in the introduction above, we sought to address the following three research questions:
1. To what extent can the human cognition inspired algorithms assist in differentiating between regular and irregular urban image elements as viewed from a scene extracted from a 250-mm resolution image?
2. Can there be a general flow or order in how humans use cognitive abilities to identify and visualise shack settlements?
3. Does the user accuracy and cognitive sequence vary with image-based skill and experience?
The first step of the study after identifying the research questions and scope was to develop the cognitive test kit and identify the focus group participants (using both systematic and random sampling techniques). We identified scenes of interest from a collection of vertical aerial imagery from 2005 captured in Cape Town, from which participants would categorise the targets of interest during the test based on the visible roof structures. Twenty sets of each image scene were printed on gloss print and typed descriptions to guide the interpreter on the interpretation task were attached per image set. In designing the test, participants would also be required to indicate a personal confidence rating for their categorisation of the structure marked in each image rated on a five-point Likert scale ranging from 1 ('not confident') to 5 ('completely confident'). Because similar studies have shown that response time is directly proportional to the difficulty of the task, a response time per question was recorded individually. This response time was judged by noting the time lapse between the initial viewing of the image and the participant's recording of a response. Prior to undertaking the task, some personal details of the participants were recorded: education level, age range, image interpretation experience and any practical contact with any geomatics work, air photo interpretation and remote-sensing exposure. Thereafter, participants were educated on the task objectives and they were also provided with a set of typed instructions explaining the task. A short training session was given to practise categorising other aspects of imagery such as vegetation and water bodies using visual interpretation.
Following the training, participants were informed of the importance of working quickly and accurately. Each participant was presented with the set of five unique image scene prints, handed out one at a time, and the participant was asked to assess the features highlighted using bright red marker in each image. A selection of four possible multiple-choice answers per question was provided for images B to E. All the participants received the same set of images although for each participant there was effort to randomise the image order. The following is a detailing of the focus groups of the participants for the task:
1. Expert Group X comprised 13 men and 7 women randomly selected from third-year students who had taken a course in image processing.
2. Trained Group Y comprised 14 men and 6 women from the public who randomly volunteered. These individuals responded to a call for volunteers at a working table set up in an open shopping area and we had no a-priori knowledge of their image-processing skills.
3. Children's Group Z comprised 20 male and female teenage children between the ages of 16 and 18 selected by a patron from a group of children at a community youth centre.
The study was approved by the Midlands State University Research and Ethics body (clearance number SGEO 2016/02).
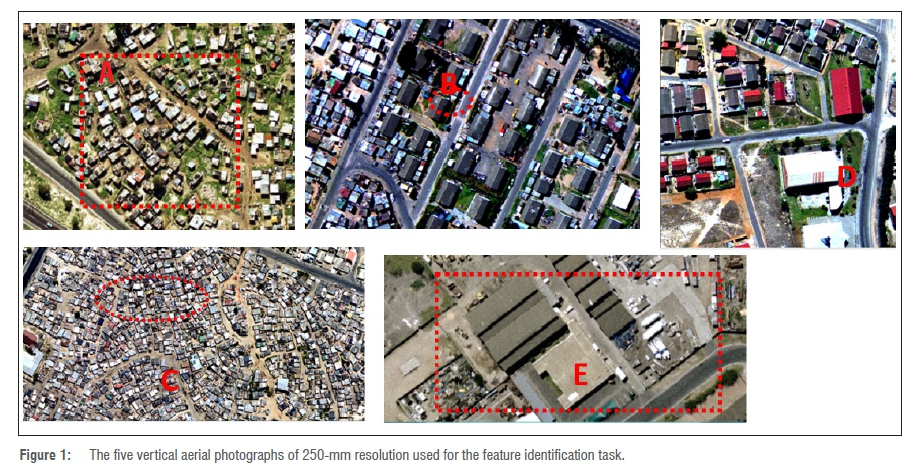
The three focus groups underwent the cognitive test using the five image sets as mentioned. Figure 1 illustrates the selected image scenes with bold red markings highlighting focus areas. Provided with Figure 1 Groups X and Y were asked the following questions (with multiple-choice responses included where applicable):
1. Using a maximum of two words per point, summarise in five points, what you see in the highlighted area in A.
2. How many units / structures are in the circled area of B?
A. 0-5 B. 5-10 C. 10-15 D. 15-20 E. 20 or above
3. Identify the urban activity present in C.
A. Residential area B. Informal area C. Business area D. Educational area E. Industrial area
4. What type of activity is likely to take place in D?
A. Residential area B. Informal area C. Business area D. Educational area E. Industrial area
5. What is the first object you saw when you looked at image D?
6. What type of activity is likely to take place in E?
A. Residential area B. Informal area C. Business area D. Educational area E. Industrial area
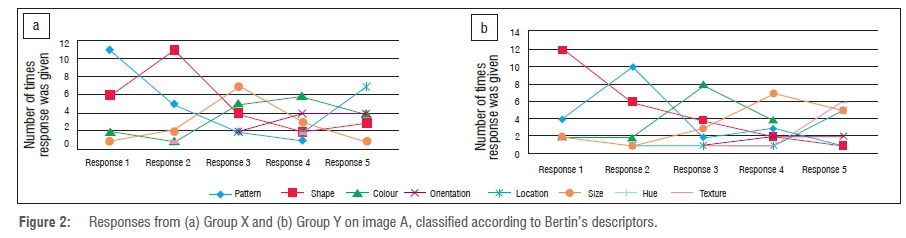
Questions 2 to 6 were similar for Group Z but the language was simplified so that they could understand the questions more easily. Question 1 for Group Z was 'What do you see?', and did not include a request for a list. All answers were compiled, collated and assessed in the focus groups to make inferences on the image interpretation process. Participants were not from the area where the imagery had been captured. Responses to Question 1 in reference to image A were classified into Bertin's cartographic visual variables15 to generalise how the responses simulate a mental cognitive process of an informal settlement. Responses were classified according to eight variables: size, shape, colour, orientation, pattern, texture, hue and location. For example, a response of 'Several squares' was taken as a shape descriptor.
Results
Groups X and Y can be seen to be representative of a neural network and supervised classifier, respectively, because Group X is an expert group which is the nature of neural network classifying systems which classify data through expertly learned steps, whereas Group Y is more like a supervised classifier as the participants were trained to classify other feature types prior to the task. Group Z is an experimental group included out of interest to assess the development of their cognitive skills in interpreting images of unfamiliar surroundings.
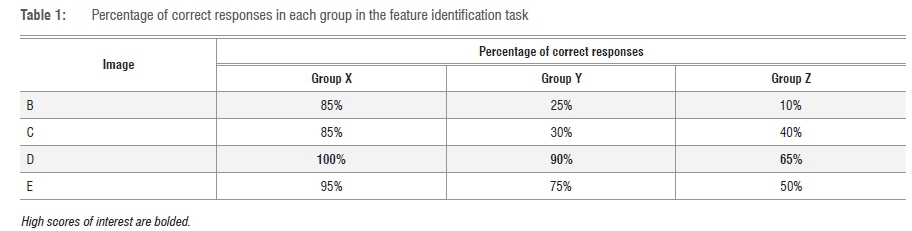
For the study, a response was rated as a correct response (CR) if the respondent correctly selected an accurate response for a multiple-choice question and as an incorrect response (IR) if the response was incorrect. Equations 1 and 2 were used to calculate the percentage of correct and incorrect answers, respectively:
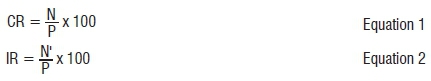
where N is the number of correct responses and P is the total group per focus population. Table 1 shows the confusion matrix of the classifications of images B, C, D and E. Figure 2 shows a grouped representation of the order of visual variables used to describe image A.
The children's group was simply an experiment to gauge the level of development of their cognitive skills in interpreting images. Their responses to Question 1 were collected and classified to Bertin's visual variables as best as possible, e.g. a response such as 'I see a jigsaw puzzle' was taken to refer to a fractal pattern and hence classified as 'Pattern'. Figure 3 represents the distribution of responses from the children with regard to the informal settlements environment in image A. Where a response contained more than one variable, e.g. 'Small squares', the first variable was taken as the response - so in this case, it would be assigned to size and not shape.

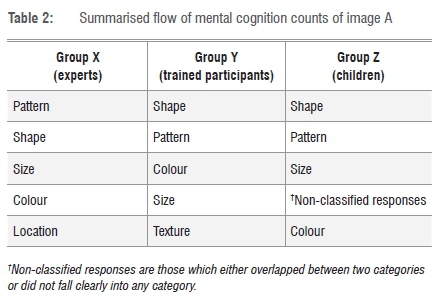
Based on the responses of Groups X and Y, and to some extent Group Z, two general cognitive variables for image interpretation were prominent: pattern and shape. Table 2 is a summary of the general flow of mental thoughts associated with viewing the images of an informal settlement. Pattern, shape and size are common to all three groups with shape scoring highest in Groups Y and Z. Location and colour appear to be of secondary significance to the urban image interpretation process. The unclassified responses - specific to the children's group - represent vague responses that either overlap with two variables or may not fall clearly into any variable category.
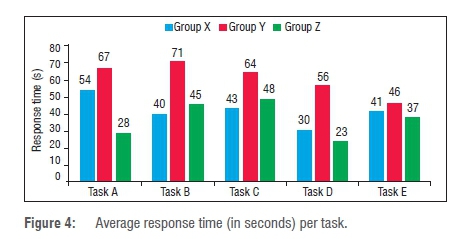
Response times, as previously mentioned, can be a good indicator of task difficulty. The average response times per group per task are plotted in Figure 4. Group X, the experts, always took less time to respond than the trained group, Group Y, suggesting that they found the tasks less difficult than the latter group. It is notable that in most instances the children's response times closely matched the experts' response times. This could perhaps be because the children often did not give too much thought to the answer; hence their cognition of the interpretation was shorter but not necessarily accurate.
Discussion
In cartography and map making it is important to continuously update visualisation products so that they can match evolving consumer requirements. In this human interpretation of urban imagery, we studied the use of cartographic visual interpretation elements in cognitive interpretation of aerial data. Our findings show that pattern and shape are the strongest visual variables in cognition of an informal settlement within the built environment (Table 2). Pattern refers to the spatial arrangements of objects in a Euclidean space and it is a variable that the human eye captures easily, as shown by the results. Shape is the geometric characteristic of an object. This result is important in that it suggests that in the algorithm building phase, the use of methods that extract pattern- or shape-based information can be a significant first step towards informal unit extraction. These two variables can also be linked to texture and morphological operations as well as the application of object-based image segmentation which thrives on extracting objects in their complete geometry rather than as single pixels. In this study, the percentage of female participants in the expert, trained and children's groups was 40%, 50% and 60%, respectively. As there was no comparative testing of navigation skills, one cannot draw parallels with Levine et al.'s study10 in which conclusions were made on the role of sex in cognitive tasks.
It is interesting to note the outcomes from the children's group. Children are exposed to elements of map reading in primary and early secondary education. Apart from formal education, technology and children's games are imparting spatial cognitive and map interpretation skills earlier in modern generations than in earlier generations. This has impacted much on the responses observed in the cognitive tests. The children gave encouraging interpretations showing their improved 'digital DNA' as compared to 'analogue times'.
Responses to Question 5 were not discussed much in the results section as they are likely to vary greatly based on user backgrounds, but it was noted that responses ranged from 'vegetation', 'white roof' and 'road' to 'order'. These responses suggest an element of unique personal individuality in cognition by which persons perceive an image differently. This finding creates the perception of a background subtraction model in the interpretation task by different individuals. A background subtraction model separates foreground - or what is attractive to an observer - from the background, which is the complement of the former. We conclude that texture and morphological operations could be a strong feature extraction approach to test in informal settlement unit extraction. Object-oriented analysis may also provide useful cues as it combines texture and morphologically based operations. In addition, the inclusion of background subtraction models in line with the outcomes of Question 5 could be a wise input into the informal settlement extraction problem.
The results can be improved by expanding the sample size and extending the study to a variety of locations that include different cultures and languages for comparison and to test the validity of perspectives such as the cultural and linguistic paradigm. It would also be interesting to make comparisons in cognitive abilities according to sex, age and profession. Further research could yield trends in the personalised aspects of spatial cognition by studying the backgrounds of the interpreters to draw inferences.
Acknowledgements
We acknowledge the City of Cape Town for providing the image data sets in support of ongoing research within the Department of Geomatics at the University of Cape Town. The data sets formed a solid basis for building the cognitive test kits used in this study. This research is part of an ongoing PhD study on three-dimensional reconstruction of informal settlements using Lidar and aerial image data. The study pursues an organic perspective in which human cognition and interpretation provide helpful strategy-building cues.
Authors' contributions
M.S. and J.L.S. conceptualised the study and designed the methodology; M.S. collected and analysed the data and wrote the first draft of the manuscript; and J.L.S. supervised the study, provided leadership and revised the manuscript.
References
1. Zheng Y. Bio-inspired color image enhancement model. Proc SPIE. 2009;7341, Art. #73410D. http://dx.doi.org/10.1117/12.819519 [ Links ]
2. Meylan L, Susstrunk S. Electronic imaging. Bellingham, WA: International Society for Optics and Photonics; 2004. p. 46-56. [ Links ]
3. Bianchetti RA, MacEachren AM. Cognitive themes emerging from air photo interpretation texts published to 1960. ISPRS Int J Geo-Inf. 2015;4(2):551-571. http://dx.doi.org/10.3390/ijgi4020551 [ Links ]
4. Estes J, Hajik E, Tinney L. Manual and digital analysis in the visible and infrared regions. In: Manual of remote sensing. 2nd ed. Falls Church, Virginia: American Society for Photogrammetry and Remote Sensing; 1983. p. 258-277. [ Links ]
5. Hoffman RR, Conway J. Psychological factors in remote sensing: A review of some recent research. Geocarto Int. 1989;4:3-21. http://dx.doi.org/10.1080/10106048909354230 [ Links ]
6. Hodgson ME. What size window for image classification? A cognitive perspective. Photogramm Eng Rem S. 1998; 64:797-807. [ Links ]
7. Lloyd R, Hodgson ME. Visual search for land use objects in aerial photographs. Cartogr Geogr Inf Sci. 2002;29(1):3-15. http://dx.doi.org/10.1559/152304002782064592 [ Links ]
8. Handy SL, Boarnet MG, Ewing R, Killingsworth RE. How the built environment affects physical activity: Views from urban planning. Am J Prev Med. 2002;23(2):64-73. http://dx.doi.org/10.1016/S0749-3797(02)00475-0 [ Links ]
9. Kettunen P, Sarjakoski lT. A context-sensitive way finding ontology for hiking based on an empirical study. Poster presented at: Conference on Spatial Information Theory (COSIT11); 2011 September 12; Belfast, ME, USA. [ Links ]
10. Levine M, Marchon I, Hanley GL. The placement and misplacement of you-are-here maps. Environ Behav. 1984; 16:139-157. http://dx.doi.org/10.1177/0013916584162001 [ Links ]
11. Walther DB, Cardigan E, Fei Fei L, Diane MB. Natural science categories revealed in distribution pattern of activity in human brain. J Neurosci. 2009;29(34):10573-10581. http://dx.doi.org/10.1523/JNEUROSCI.0559-09.2009 [ Links ]
12. Downs RM, Stea D. Cognitive maps and spatial behaviour: Process and products. Chicago, IL: Aldine; 1973. [ Links ]
13. Kaplan MF, Miller CE. Judgments and group discussion: Effect of presentation and memory factors on polarization. Sociometry. 1977;40(4):337-343. http://dx.doi.org/10.2307/3033482 [ Links ]
14. Edgin JO, Pennington BF. Spatial cognition in autism spectrum disorders: Superior, impaired, or just intact? J Autism Dev Disord. 2005;35(6):729-745. http://dx.doi.org/10.1007/s10803-005-0020-y [ Links ]
15. Koch WG. Jacques Bertin's theory of graphics and its development and influence on multimedia cartography. Inf Design J. 2001;10(1):37-43. https://doi.org/10.1075/idj.10.1.07koc [ Links ]
 Correspondence:
Moreblessings Shoko
moblesss@yahoo.com
Received: 01 Mar. 2016
Revised: 22 June 2016
Accepted: 13 Aug. 2016
FUNDING: None

