


Services on Demand
Article
 English (pdf)
 Article in xml format
 Article references
Indicators

Related links
-
 Cited by Google
 -
 Similars in Google
Share

 Permalink
South African Journal of Science
On-line version ISSN 1996-7489
Print version ISSN 0038-2353
S. Afr. j. sci. vol.112 n.11-12 Pretoria Nov./Dec. 2016
http://dx.doi.org/10.17159/sajs.2016/20160051
RESEARCH ARTICLES
Palaeomagnetic results and new dates of sedimentary deposits from Klasies River Cave 1, South Africa
Hugo G. NamiI, II; Paloma de la PefiaIII, IV; Carlos A. VásquezI, V; James FeathersVI; Sarah WurzIII, IV
ICONICET-IGEBA, 'Daniel A. Valencio' Palaeomagnetism Laboratory, Department of Geological Sciences, University of Buenos Aires, Buenos Aires, Argentina
IIDepartment of Anthropology, National Museum of Natural History, Smithsonian Institution, Washington DC, Washington, USA
IIIEvolutionary Studies Institute, School of Geosciences, University of the Witwatersrand, Johannesburg, South Africa
IVSchool of Geography, Archaeology and Environmental Sciences, University of the Witwatersrand, Johannesburg, South Africa
VCiclo Básico Común, University of Buenos Aires, Buenos Aires, Argentina
VILuminescence Laboratory, University of Washington, Seattle, Washington, USA
ABSTRACT
Palaeomagnetic data from Klasies River main site Cave 1 (Eastern Cape Province, South Africa) are reported. Natural remanent magnetisation directions obtained from 77 oriented samples were determined by progressive alternating field demagnetisation methodology. Three palaeomagnetic samplings from the Witness Baulk from the Middle Stone Age (MSA) Late Pleistocene White Sand member and the Holocene Later Stone Age (LSA) middens in Cave 1 were dated and analysed to obtain the palaeomagnetic directions recorded in the sediments. Here we provide new optically stimulated luminescence (OSL) dates for the White Sand Member, and new accelerator mass spectrometry (AMS) radiocarbon dates for the LSA midden of areas not previously dated. The palaeomagnetic analysis took into account rock magnetism and directional analysis. The former reveals that the main magnetic carrier was magnetite; the latter shows that characteristic remanent magnetisation of normal and anomalous directions were observed in the lower portion of the White Sand Member and LSA midden. Normal directions correspond to the palaeosecular variation record for South Africa during the Late Pleistocene. On the other hand, the anomalous directions recorded in the LSA midden might represent the likely Sterno-Etrussia geomagnetic field excursion which occurred during the Late Holocene and is observed in other places on the planet. Finally, the directional data obtained are a potential tool for discussing the age of deposits corresponding to those periods.
SIGNIFICANCE:
• New dates confirm and extend previous age determinations for the LSA and White Sand Member from Klasies River
Keywords: Klasies River main site; palaeomagnetism; palaeosecular variation; Late Pleistocene; Holocene
Introduction
In earth's history, the Late Pleistocene and Holocene cover the last ca 126 000 years. This period has seen major cultural developments as recorded in the Middle Stone Age (MSA) and Later Stone Age (LSA). A number of techno-complexes are used to describe such changes on a broad level; for example, Still Bay and Howiesons Poort in marine isotope stage (MIS) 4 (75 000-58 000 years ago)1-3 of the MSA and Wilton and post-classic Wilton of the LSA that occur within marine isotope stage 14. Refining chronologies are vital to understand cultural change. For example, while the technological characteristics of the MSA Still Bay and Howiesons Poort are comparatively well described, its chronostratigraphic boundaries are debated as different dating methods indicate longer or shorter chronologies.5-7 For the LSA, discussions revolve around nomenclature more than temporal boundaries,4 but here too there could be a closer understanding of cultural change through time. There is thus an opportunity to expand the methodological range to obtain more perspectives on chronological resolution in the South African MSA and LSA. Here we focus on the use of palaeomagnetic features as distinguishing and chronological markers at Klasies River main site for a Late Pleistocene MSA and a post-classic Wilton occurrence.
During the rock and sedimentary sequences formation process, certain minerals lock in a record of the direction and intensity of the geomagnetic field (GMF). Diverse kinds of palaeomagnetic investigations are carried out on sedimentary deposits, because at the moment of its formation, magnetic minerals were magnetised parallel to the GMF. In this way, the sediments provide data on different GMF features, such as palaeosecular variations, excursions and reversals occurring through the history of the earth.8 Actually, the GMF has alternated between periods of normal polarity, in which its direction was the same as it is at present, and reverse polarity, in which the field was the opposite. These periods are called chrons, and their durations vary from thousands to millions of years. If compared with high magnitude modifications such as reversals, secular variations are the small changes occurring slowly and progressively in all parts of the GMF with time scales in the order of decades to millennia. The strength and direction of the total field vary as a result of changes in strength and direction of the dipole and non-dipole components. Hence, there is a global signature to the secular variation but also significant differences.9 Disturbances spanning a short time period that do not result in reversal are called geomagnetic excursions. Detailed knowledge of these excursions has important geomagnetic and stratigraphic implications, becoming useful as a magnetostratigraphic geochronological tool.10-15
Spanning the last 780 000 years, during the Brunhes Chron, the GMF polarity has been 'normal' as it is now. However, there has been a number of occasions when the GMF either briefly reversed or behaved anomalously. This fact indicates that this normal polarity has been interrupted by significant departures from the dipole field configuration.10,16-18 These departures are considerably larger than those seen in secular variations observed during historical times, and sometimes even attain opposite polarity, originating in GMF excursions. By definition, the excursions are short intervals of anomalous field directions that occur within a broader period of 'stable' normal or reversed magnetic polarity.18-22 However, while certain excursions are known to be global, others may have been on a continental scale only. During the Brunhes Chron, several anomalous records were observed in different materials, times and places.16,17,19,23
In South Africa, palaeomagnetic research related to palaeoanthropological and archaeological investigations was employed to date sites and localities that yielded evidence of the oldest hominin remains going back to the terminal Miocene and Pliocene.24-26 However, its use in sequences spanning the Pleistocene and Holocene is scarce. As part of a research programme aimed to deepen the knowledge of the GMF behaviour during these geological epochs in different places of the world,27-32 a number of archaeological and geological sedimentary sections in South Africa were sampled. As a result of this investigation, here we report the preliminary results of the detailed research performed at the Klasies River (KR) main site on the southern coast of South Africa.
Site description and sampling
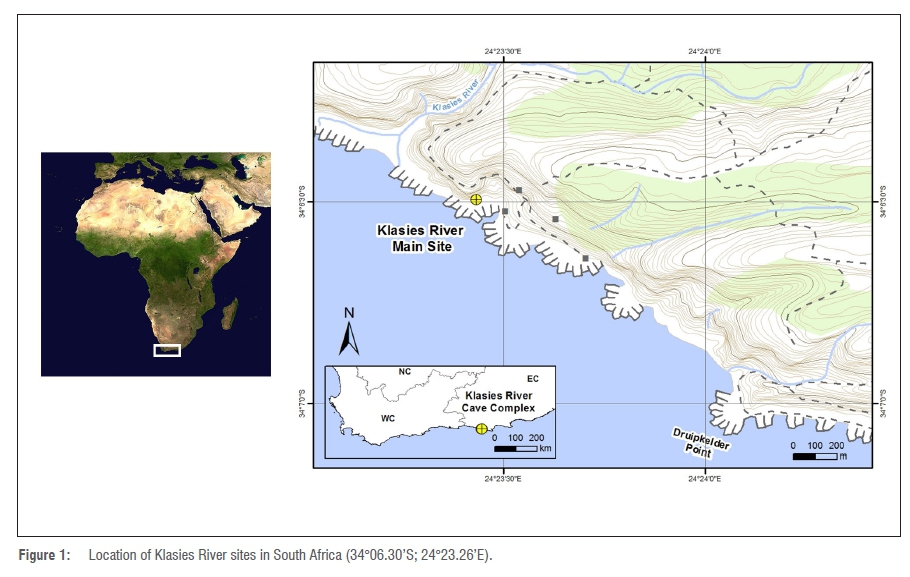
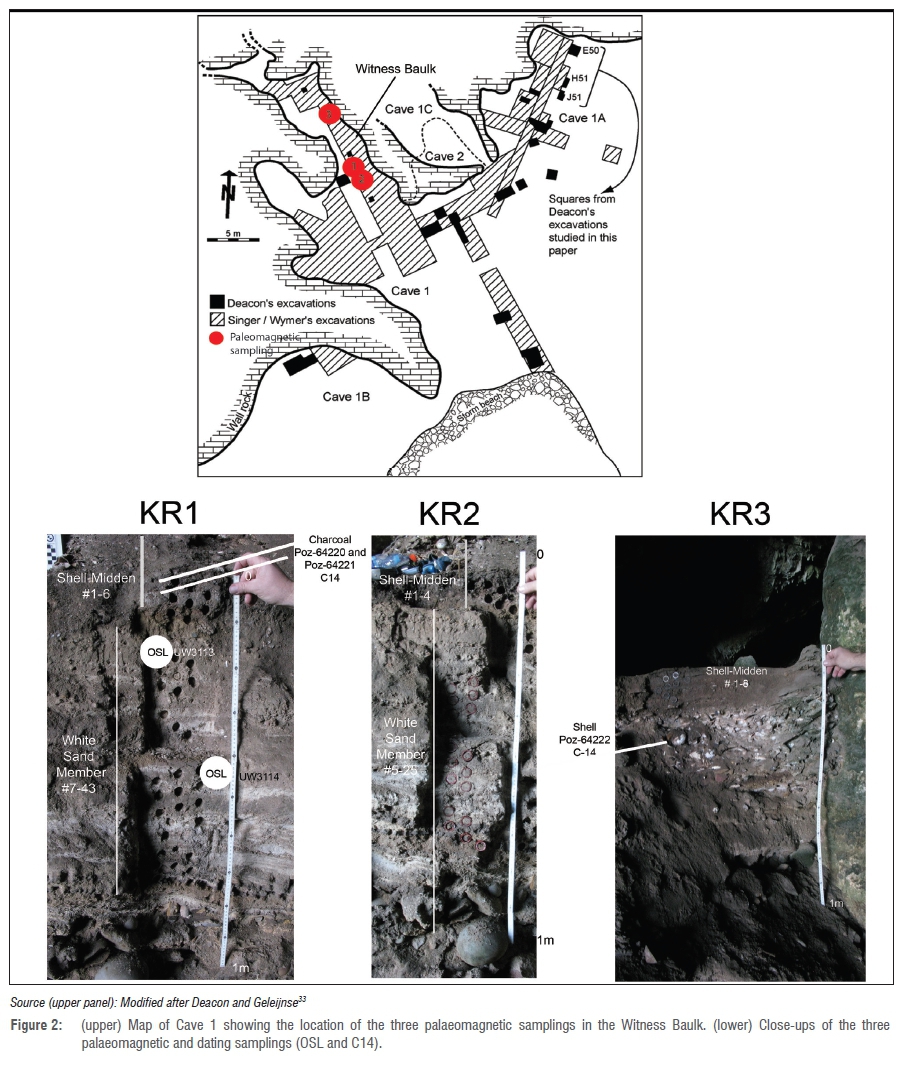
KR is situated on the Tsitsikamma coast between the mouth of the Klasies River and Druipkelder Point in the Eastern Cape Province (Figure 1). Main site (34°06.30'S; 24°23.26'E) comprises two caves - Caves 1 and 2 - and two overhangs (termed Caves 1A and 1B) - features within and against a Table Mountain sandstone cliff that faces the Indian Ocean. At KR main site the MSA consists of a well-stratified 20-m sequence33 whereas the LSA was deposited only in Cave 1 between ~4800 BP and 2500 BP34. Main site (Figure 2) was excavated by Wymer in the 1960s34, by Deacon between 1984 and 20 1 033,35,36, and, since 2013, by Wurz. Deacon divided the stratigraphy into a series of members formed by sediments of similar lithology, including the Light Brown Sand (LBS), Shell and Sand (SAS), Rockfall (RF), and Upper and White Sand (WS) members. Above the WS member in Cave 1 a LSA midden occurs that has been excavated and numbered from Layers 12 to 1 by Singer and Wymer34. An area of the LSA midden was excavated by Binneman37. The samples analysed for this paper are from the Witness Baulk in Cave 1 (Figure 2), in particular the WS member, termed Layer 13 by Singer and Wymer34, and the LSA deposits that overlie this member (Supplementary figure 1).
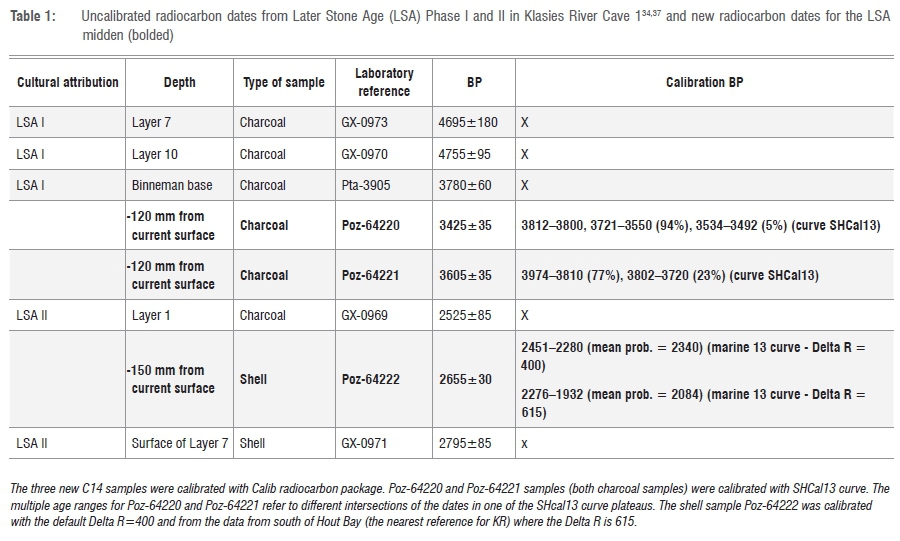
The Witness Baulk is located along the central part of the cave in a north-south direction (Figure 2 and Supplementary figure 1) and contains the LBS, SAS, WS members and two LSA middens. The LBS and lower part of the SAS member consists of in-situ deposits, but the upper part (SASW sub-member) was formed by talus material from Cave 1A deposits. These talus deposits blocked the entrance of Cave 1, and during much of MIS 5, 4 and 3, the cave was not open for habitation. During a phase when the cave was open, the WS member was formed on top of the SAS member by clean, light-coloured aeolian sands with silt lenses.34(p.27) The sand is typical of a regressional fine-grained aeolianite, that may indicate a retreating sea level which was initially near the cave but eventually quite distant.38(p.147) Calcareous suspended material that formed in pools of standing water near the rear of the cave associated with this member is also present. The WS member (Layer 13) was presumably deposited after a period of major erosion of the mSa III deposits in Cave 1A. The main reason for this inference is that there is no trace of similar sands in the stratigraphy beneath Cave 1A.34(p.114) Before excavation, the WS member had a maximum thickness of close to 1 m in the western part of the cave34(p.9) and it thinned out towards the east section. The WS member contains what is known as the MSA IV industry with predominantly quartzite artefacts in the size range of those of Howiesons Poort. The MSA IV has proportionally fewer blades than points, with the latter described as 'unusually small'34(p.114). There are no archaeological features such as hearths supporting a geological origin for the bulk of this member, and archaeological material occurs mostly near the base.38 Bada and Deems39 provided an aspartic acid racemisation date of 65 ka for a sample taken 1.5 m below the surface of the Witness Baulk in the WS member. An optically stimulated luminescence (OSL) date of 70.7±7.4 ka was obtained by Feathers40 (Supplementary table 1). Here we report on new single-grain OSL dating and the palaeomagnetic orientation of samples from this member. New radiocarbon dating of the LSA and WS member in the areas sampled for palaeomagnetic investigation was undertaken to ensure the accurate contextualisation of the palaeomagnetic data. The dates obtained by Singer and Wymer34 and Binneman37 as presented in Table 1 originate from other areas of these deposits. A hiatus, associated with grey flowstones and stalagmitic structures, occurred after the deposition of the WS member, implying that the cave must have been essentially closed off at this time.38 Wave erosion associated with the rise of the sea level in the mid-Holocene removed blocking aeolianite or shell midden deposits and re-opened the cave.
The LSA shell midden debris formed in two major episodes, documented in Layers 1 to 12.34 Singer and Wymer34 excavated a significant portion of the LSA middens, and subsequently Binneman37 undertook a square-metre excavation of the middens in the eastern profile of the Witness Baulk, approximately at Square B of Singer and Wymer's Main Cutting34(Figure32) (Supplementary figure 1). The lower midden, LSA I (Layers 7-12), consists of abundant marine shell with thin ash layers34,38 (also see Supplementary figure 1). The lower midden is more compact than the upper midden. The top of Layer 7 contains crushed shell and lime cementation that had occurred on the surface, indicating a break in deposition. Carbon-14 (C14) dating undertaken by Singer and Wymer34 for Layers 7 and 10, and a further date by Binneman37 for the base of the midden, indicate occupation at between 4800 BP and 3700 BP (Table 1).
The upper LSA midden - LSA II (Layers 1-6) - originally had a depth of about 1.5 m, but a part of this deposit has been eroded away from the Witness Baulk (Supplementary figure 1). A temporary high sea level (+4 m) that occurred not too long after 2450 BP between Layers 4 and 3 destroyed much of the MSA and LSA deposits as a result of storm-wave erosion.38(p.146) The top midden dates to between 2500 BP and 2800 BP (see below Table 1). As explained above, new accelerator mass spectrometry (AMS) dates for charcoal and shell samples associated with the palaeomagnetic studies have been obtained for the LSA middens, and are reported on below.
The LSA middens are associated with typical 'informal' southern Cape coastal stone tool assemblages characterised by low levels of curation and 'unstandardised' artefacts and described as the 'Kabeljous' industry. This industry sometimes occurs contemporaneously with the Wilton industry on the coast.37(p.151) In the Kabeljous industry, formally retouched tools are few, but the thick-backed scraper-knives, sometimes termed giant crescents34(p.127), are quite distinctive.37 In addition to stone artefacts, Singer and Wymer34 recorded and described querns, pounders, a bored stone, a grooved stone, a slate palette, ostrich egg shell beads, a perforated cowry and sinkers. Bone tools occur in significant proportions in both the upper and lower middens.
Dating
The palaeomagnetic research performed in KR Cave 1 provided an opportunity to obtain additional AMS and single-grain OSL dates for the LSA middens and the upper part of the WS member of the Witness Baulk relating to the sampling. However, the main purpose of the new dating samples was to accurately contextualise all the palaeomagnetic results that will be discussed below.
Both LSA middens and the WS member have been dated previously. The previous and new C14 and OSL dating results are synthesised in Tables 1 and 2 and Supplementary table 1. For the new AMS dates -Poz-64220 and Poz-64221 - a similar age should be expected, as the charcoal samples taken were from a similar height (Figure 2). Indeed, this is the case; in Table 1 it is shown that both samples date to ~3500 BP The date for Square D Poz-64222 is more recent |~2600 BP). The LSA midden thinned out towards the back of the cave (Supplementary figure 1). What is preserved at present is an uneven eroded surface of the deposit that Singer and Wymer excavated (Supplementary figure 1). Poz-64222 therefore represents a more recent layer of the lSa midden, even if it is slightly lower than those of the other two layers.
The new C14 and OSL dates largely confirm previous chronological assessments. Our C14 dates for phase I are somewhat younger than those obtained by Singer and Wymer34, but similar to that of Binneman37. Poz-64220 and Poz-64221 date to ~3500 BP the Binneman37 date is 3780±60 BP whereas the Singer and Wymer date is about 4800 BP It must be taken into account that the dates by Singer and Wymer and Binneman result from conventional C14 dating whereas the new dates were obtained with the AMS technique. For LSA II, our date for Poz-64222 is 2655±30 BP - also slightly younger than that obtained by Singer and Wymer |2795±85 BP) for the surface of Layer 7. These dates may indicate that the LSA I at Klasies River occurred until 3500 BP and that LSA II lasted until closer to 2000 BP than previously estimated.
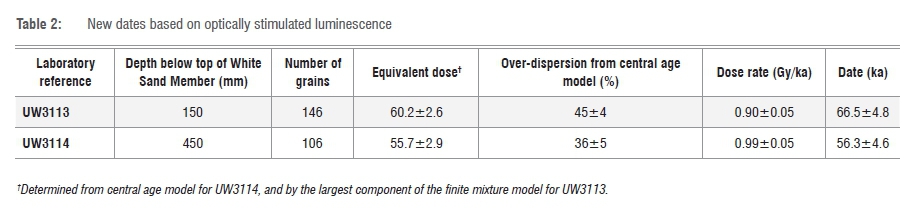
For the Witness Baulk, two samples for OSL dating were taken at different depths adjacent to palaeomagnetic sampling KR1 and KR2 (Table 2, Supplementary tables 2-7 and Supplementary figure 2). The two OSL dates, UW3113 and UW3114, were derived from 180-212-μm single-grain quartz. The equivalent dose was determined on more than 100 grains for each sample. Using an over-dispersion of 30% (from dose recovery) as typical for a single-aged sample, a finite mixture model showed that all grains for UW3114, and 94% of grains for UW3113, were consistent with a single component (Supplementary figure 2). This argues for well-bleached, unmixed samples. Using a weighted average (central age model) for the equivalent dose and dividing through by the bulk dose rate provides the ages given in Table 2. While nearly within 1σ error terms, the two dates are inverted stratigraphically. Both, however, are within 1σ of the date reported by Feathers40. This inversion might be partially caused by the dose rate. The dose rate of the sample was assumed to be characteristic of the samples' entire radioactive environment, which may not be fully true, especially for UW3113 which is close to the shell midden. Details of the dating method are given in the supplementary material.
Palaeomagnetic study
Sampling procedures
The palaeomagnetic samples were taken from the fine sediments of the eastern profile exposed by Singer and Wymer's main cutting (see their Figure 2.134; see also Figure 2 and Supplementary figure 1). Most of the deposit is formed by fine-grained sand with lenses of silt and clay, which are interbedded by thin lenses of fine gravel. The sampling was performed in the upper layers of the WS member and the back slope area of the overlying LSA midden relating to Singer and Wymer's Squares C and D.
Three palaeomagnetic samplings named KR1 (n=43), KR2 (n=28) and KR3 (n=8) were taken (Figure 2). KR1 and KR2 were collected in Singer and Wymer's Square C, and KR3 in a well-defined, and apparently undisturbed, stratum from Square D close to the stalagmite (Figures 2 and 3). The LSA midden was sampled in KR1 (#1-9), KR2 (#1-4) and KR3 (#1-8). The WS member was sampled in the same areas in KR1 (#10-13) and KR2 (#5-28) below the LSA. In the WS member, the interbedded levels of gravels were not sampled, and cores (KR1 #25-27, #37-42 and KR2 #26-30) were taken from the silt and clay levels. The cores were taken vertically using 25-mm long and 20-mm diameter cylindrical PVC plastic containers. In KR1 and KR3, the cylinders were carefully pushed into the sediments, overlapping each other by about 50%. In KR2, each core was sampled continuously without overlapping. The sample's orientation was measured using a Brunton compass. Samples were consolidated with sodium silicate once removed and they were numbered from the top to the bottom. The depth of each sample is depicted in Figure 2. One sampling - named RM - was taken nearby to KR1 for rock magnetic analysis. The samples (n=12) were taken with an interval of ~50 mm.
Rock magnetic study
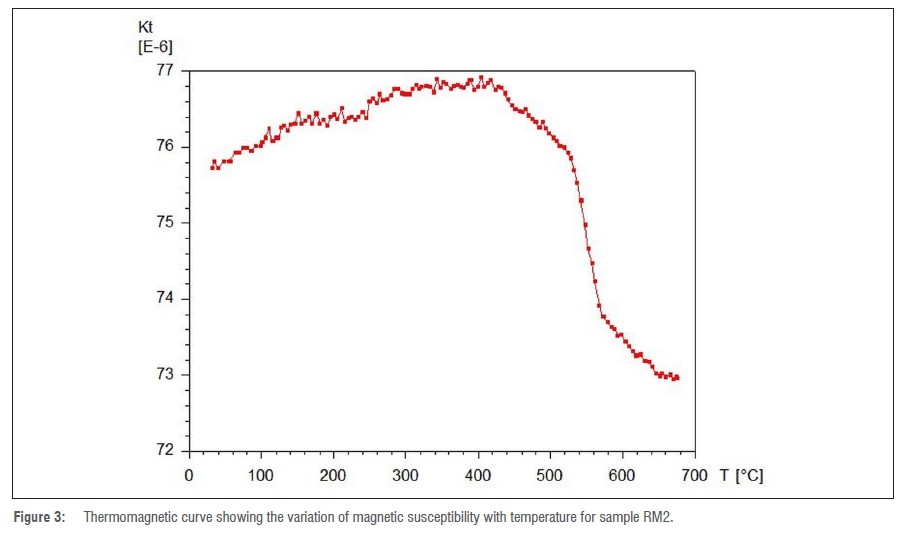
This analysis was performed using the variation of magnetic susceptibility with frequency, which is a tool to identify small magnetic particles in the superparamagnetic state (SP). Because the grain size distribution follows a lognormal distribution, the presence of these SP particles is indicative of bigger particles whose grain size is in the stable single domain state (SSD),41,42 and which are very good magnetic carriers of remanence.
Samples were measured in the susceptibilimeter AGICO model MK1-FA. Several amplitude fields ranging from 5 A/m to 700 A/m in f1 (=1000 Hz), 5 A/m to 350 A/M in f2 (=4000 Hz) to 200 A/m in f3 (=16 000 Hz) were used. The parameter xfd% (percentage difference of susceptibility with frequency) is calculated according to:
Xfd%= 100 x [χlf- Xhf ) / χlf],
where xlfis the magnetic susceptibility in low frequency and xhfis the susceptibility in high frequency. The resulting measurements are shown in Supplementary table 8.
For magnetite, the parameter xfd% was correlated with grain size in the limit SP/SSD when the frequencies ranged between 1000 Hz and 16 000 Hz at ambient temperatures. Figure 3 shows the variation of susceptibility with temperature for the RM2 sample; the drop near 580 °C is an indicator of magnetite as the main magnetic carrier. When SSD concentration is high, a peak near 580 °C is apparent - this is named Hopkinson peak. The fact that the Hopkinson peak is suppressed can be related to SP grains, because this sample has the higher xfd%. Most of the samples show values higher than 10% in f1f3 frequencies and values higher than 6% in f1f3 frequencies; only two samples - RM10 and RM12 - exhibited lower values for xfd% in both differences in frequency. In these samples it can be argued that the concentration of SP fraction is lower; therefore the concentration of viscous grains is also lower.
Remanence directions analysis
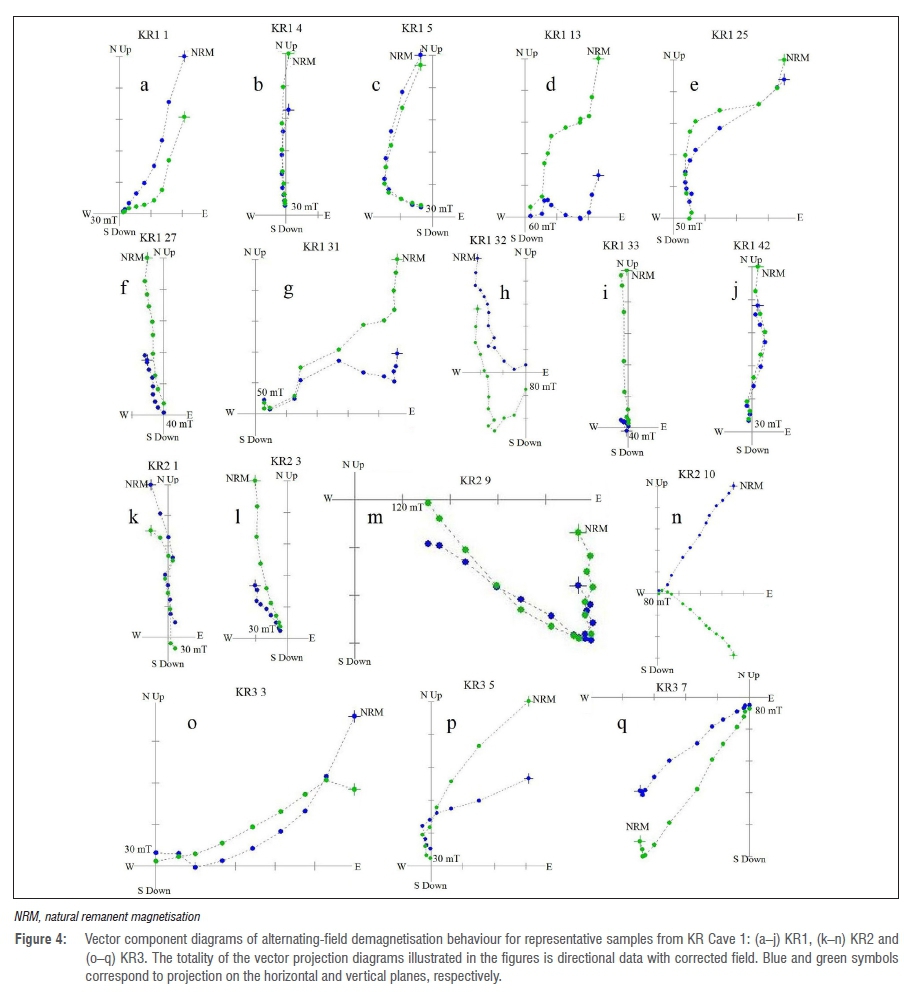
All samples were subjected to detailed stepwise alternating field (AF) demagnetisation in progressive steps of 3, 6, 9, 12, 15, 20, 25, 30, 40 and 60 mT with a three-axis static degausser attached to a 2G cryogenic magnetometer (755 R). Additional steps of 80 mT 100 mT and 120 mT were used for some specimens. The KR samples showed a common pattern with similar reliable magnetic behaviour. Most samples from the LSA midden had a gradual decrease of magnetisation with almost all remanence erased at 30 mT (KR1 1; KR2 1; KR3 3, 5; Figure 4a,k,o-p); from the WS member, a few samples at 30-10 mT (KR1 27, 31, 33, 42; Figure 4f-g,i-j), and most samples between 50 mT and 60 mT (KR1 13, 25; Figure 4d-e), while a few indicate a drop at 80-120 mT (KR1 32; KR2 9, 10; KR3 7; Figure 4h,m,n,q).
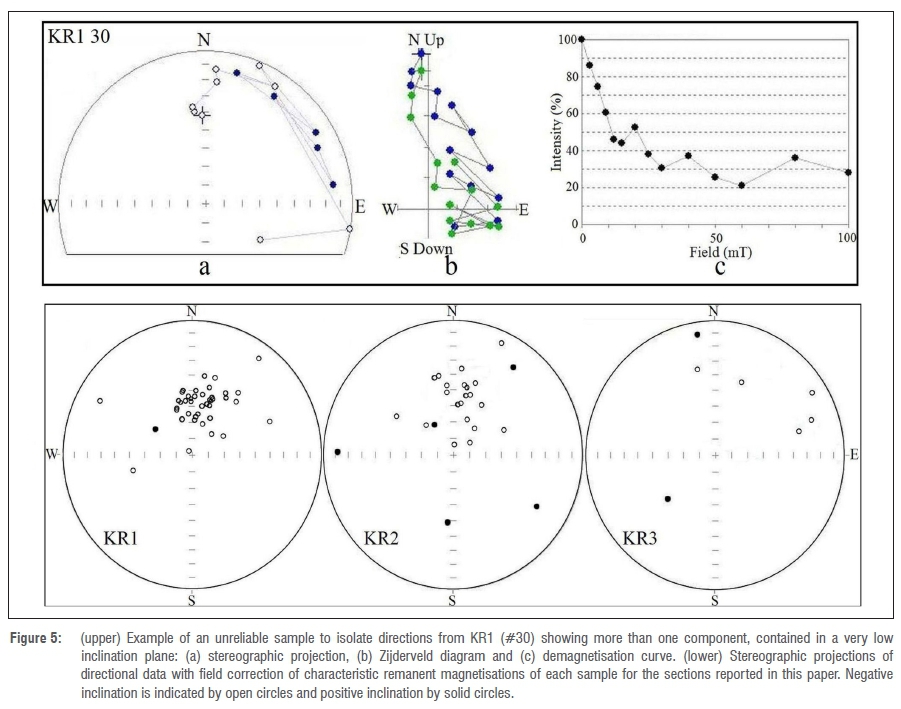
Palaeomagnetic directions were determined by the 'Remasoft 3.0 palaeo-magnetic data browser and analyzer' computer program.43 Some specimens were not processed because their orientation marks were lost (KR2 1 and 2), or because they were too unstable to isolate directions (KR1 30; KR3 4; Figure 5). The characteristic remanent magnetisation (ChRM) directions were calculated using principal components analysis.44 In most cases, a ChRM could be defined trending in the Zijderweld diagrams towards the coordinate's origin (e.g. KR1 1, 5, 13; KR2 10; KR3 5, 7; Figure 4a-c,n,p-q). The samples shown in Figure 4 were highly reliable, displaying similar patterns of univectorial behaviour in the vector diagrams projection (KR1 4, 27, 33; KR2 10; Figure 4b,f,i,n). Others had two magnetic components with one decaying to the origin in the vector diagrams projection (KR1 1, 5, 32; KR3 5; Figure 4a,c,h,p). Four samples (namely KR1 5, 32; KR3 5; Figure 4c,p) displayed two magnetisation components with different directions. As described in Supplementary table 9, the secondary ('soft') component in three samples recorded a normal GMF position while the 'hard' magnetisation is interpreted as an early remanence acquired during formation of the sedimentary deposit. A viscous secondary component easily removed in a few samples (KR1 1; KR2 1; KR3 7; Figure 4a,k,q) between 3 mT and 12 mT was not considered further. There was one sample with three magnetic components; one of which (KR1 13; Figure 4d) appears to decay to the origin. Finally, a few specimens exhibited residual directions not erased at demagnetisation fields of 40-50 mT, causing some deviation away from the origin. Nevertheless, they do not affect the isolated ChRM (e.g. KR1 25, 31; Figure 4e,g). Despite the rejection, it is important to point out that the KR1 30 stereoplot illustrated in the upper panel of Figure 5 shows more than one component contained in a very low inclination plane. In this regard, the two magnetisations observed in this rejected sample are in agreement with the two components recorded in a nearby specimen (i.e. KR1 32; Figure 4h) and the anomalous directions observed until KR1 33. Many samples showed either a high (e.g. KR2 10; Figure 4n) or a low negative (e.g. KR1 1, 27, 33; Figure 4a,f,i), and positive inclinations (e.g. KR1 32; KR3 7; Figure 4h,q). Most samples yielded a normal direction (KR1 1, 4, 13, 27; KR2 1, 3; Figure 4a-b,d,f,k-l), a few samples showed northwesterly (KR1 5; Figure 4c), northeasterly or easterly directions (KR1 1, 31; KR2 10; Figure 4a,g,n), several of which had steep inclinations (KR1 1, 27, 33; KR2 1; Figure 4a,f,i,k). Oblique reverse and reversed or 'anomalous' southward directions were found in various cores from KR3 (7; Figure 4q) and the upper portions of KR2. The maximum angular deviations were generally within low values, ranging from 0° to 5° (KR1=71.4%, KR2=64.3% and KR3=57.1%) and from 5.1° to 10° (KR1=28.6%, KR2=39.7% and KR3=43.9%).
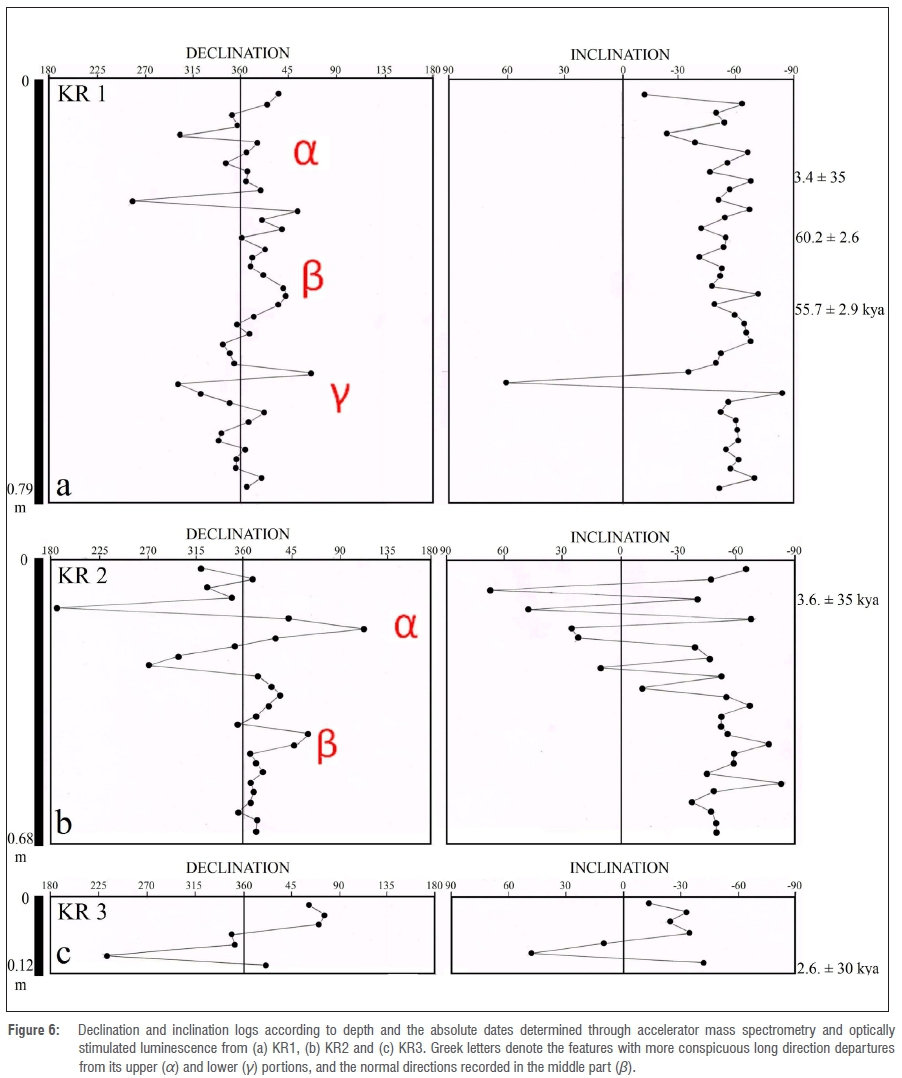
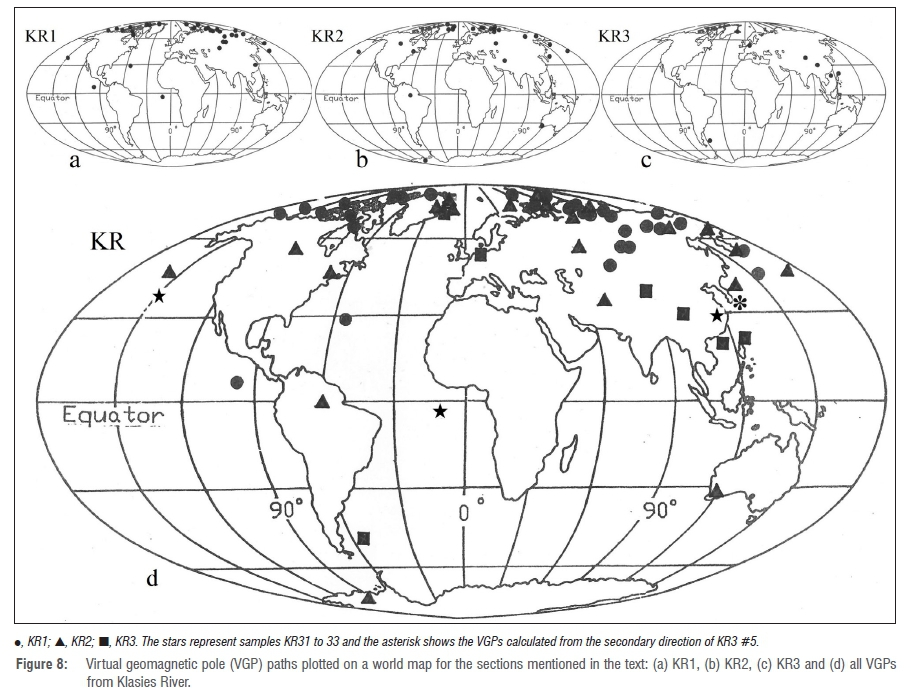
The number and intervals of demagnetisation steps used to isolate the ChRM of each sampling are given in Supplementary table 10. This analysis shows that the KR samples display normal, intermediate and reverse magnetic remanence of low negative and positive inclination values, mostly in KR2. Figure 5 (lower panel) illustrates the stereographic projection of ChRM for the three KR samplings. They show a cluster of normal directions and intermediate and reversed directions in KR1 to KR3. Magnetograms of the declination and inclination profiles from each sampled section are exhibited in Figure 6. KR3 and the upper part of the KR1 and KR2 sites yielded records with anomalous directions. Between samples 3 to 15, the upper portion of KR2 varies widely with transitional positions between samples 9 to 13 gradually changing to normal positions; KRM3 mostly shows anomalous directions far from the present GMF; KR1 and KR2 exhibit wide amplitude pulses both in declination and inclination. Remarkably consistent is the declination agreement on specific specimens such as KR2 7 and KR3 7. From KR1 13 and KR2 16, a significant but gentle eastward shift in the declination over 60° is observed. Most of the specimens of the WS member display normal GMF positions; however, there are also anomalous directions far from the present GMF. Normal directions in the central part of KR1 (#6-31) and KR2 (#14-29) show the record of the palaeosecular variation of the normal GMF. In the lowermost part of KR1, a wide pulse with transitional positions both in declination and inclination between normal samples KR1 29 and 35 is observed. Differences in KR1 and KR2 logs might be for several reasons. On the one hand, samples KR2 1 and 2 were not processed. On the other hand, the sampling interval in KR2 is different from that in KR1; these facts might explain in part the differences between the upper and lower portions. The record of inclination in the WS member presents a certain similar behaviour ranging between ~-40° and 70°. The two anomalous and the normal features observed in the logs are shown respectively by the Greek letters α, β and γ in Figure 6. After checking that the directional data from KR was useful to assess a Fisherian distribution, the site mean directions of KR1 and KR2 were computed using Fisher's45 statistic. Additionally, a mean direction was calculated using the normal directions from both samplings. From this study, it is observed that KR mean directions show a consistent agreement; they are also located close to the International Geomagnetic Reference Field (IGRF) direction (D=332.86°, I=-64.55°) for 2014 - the year in which the sampling was performed (Supplementary table 10; Figure 7). Supplementary tables 8 and 9 depict the virtual geomagnetic pole positions (VGP) calculated from the directions of the sites reported here. When plotted on a present world map, VGPs show intermediate and reverse positions from the rotation axis of the earth (Figure 8).
The virtual poles in the northern hemisphere are located in northern North America, Greenland, and north, east and southeastern Asia. VGPs in the southern hemisphere are situated in South America, west of central Africa, Australia and Antarctica. As seen in Figure 8d, VGPs from KR show a consistency between the apparent systematic in VGP location observed in other places during the Pleistocene-Holocene transition and Holocene.46(Figure 12b) Interestingly, in earth's history, longitudinal bands across Australasia and the Americas have been observed in transitional records since the early Jurassic.47
Discussion and conclusion
Palaeomagnetic data obtained in the fine-grained sediments have shown anomalous and normal directions. Normal directions were mostly recorded in the WS member, and anomalous directions in the lowermost portion of KR1. The intermediate, oblique reverse and reverse polarity far from the present GMF were recorded in the upper part of KR1 and KR2, representing LSA I, and the totality of KR3, relating to LSA II.
Anomalous palaeomagnetic records may occur for a number of reasons. Actually, various causes can give rise to the measurement of anomalous directions of remanent magnetism which does not reflect the true GMF behaviour, such as diverse deposition processes, chemical alterations as well as sedimentary physical disturbances.22,48 Also, the anomalous directions may reflect true GMF excursions, which are defined when VGPs differ by more than 45° from the geographic pole during normal or reverse polarity, signifying that they may be considered a major deviation in GMF behaviour.14,18,22 Hence, if the anomalous directional data observed at KR are not a result of a sedimentary artefact and/or perturbations, they correspond to the Late Holocene GMF record at southern Africa during the ~<3.5 ka to 2.5 ka interval; on the other hand, the normal directions occurring at the middle portion of KR1 and most of KR2 of the WS member logs represent the Late Pleistocene palaeosecular variation record during ~60-65 ka. Regardless of the relative scarcity of samples with anomalous directions in the lower portion of KR1, these samples might presumably represent an anomalous Late Pleistocene GMF record with a similar age.
The directions recorded in the LSA middens may suggest that the likely GMF excursion observed in other parts of the earth during the Holocene31,49 might also be present in southern Africa. Particularly at ~2.5-3.0 ka, a number of localities in the world yielded records of the excursion named Etrussia or Sterno-Etrussia.50-53 Additionally, sea cores from Tahiti provided data on this recent event.54 In the southern hemisphere, Late Holocene deposits also produced records with reverse positions.49,55,56 However, the above-mentioned dates obtained at KR Cave 1 allow inquiry into the possibility that the likely Late Holocene GMF excursion in South Africa might have started earlier, at ~<3.5 ka. At a similar latitude to KR, but in the western hemisphere, a Holocene declination and inclination log with wide swings similar to KR are present in the Misiones Province, northeastern Argentina.31 Even though this event is not dated, it may be significant. Therefore, the polarities recorded in the LSA midden sections of KR1 and KR2 as well KR3 might be a manifestation of the above-mentioned geomagnetic anomaly occurring during the Late Holocene. In the lower portion of KR1, marked with the letter γ in Figure 6, there are some samples that may also be a manifestation of possibly anomalous GMF behaviour observed in other places of the world during the Late Pleistocene. At that time, a well-known excursion is the Laschamp geomagnetic event, dated at ~40 ka.18,57,58 However, considering the new OSL dates obtained in the WS member, the aforementioned anomalous record may correspond to an older GMF event. Actually, Nowaczyk and colleagues25(Table 5) informed a number of records with dates ranging from 65 ka to 86 ka corresponding to the Norwegian-Greenland Sea event. Interestingly, Lund and colleagues16(Table 1) estimated an age of 61±2 ka for this excursion. Also, resulting from Ocean Drilling Program Leg 172, Lund and associates16(FigureF1) reported 14 plausible excursions within the Brunhes Chron recorded at sites 1060 to 1063, separated by more than 1200 km. During the Late Pleistocene, they yielded evidence of an undated excursion labelled as 5a, which is placed between two anomalies dated at ~40 kya (3b) and ~125 kya (5b). The anomalous directions observed in the lower portion of KR1 may likely correspond to the above-mentioned Late Pleistocene events.
Because anomalous directions may be a result of sedimentological or rock magnetic effects, and because of the scarcity of similar records around the world, most scholars do not accept as real GMF behaviour the anomalies reported for the last -11 ka BP However, there is growing evidence suggesting the hypothesis of the global excursional state of the GMF with no contemporaneous intermediate or reverse directions during this time span31,32, and the possible occurrences of other excursions during the Pleistocene16,17,54. Hence, if the KR records represent true GMF behaviour, they have provided valuable insights.
Palaeomagnetic directions recorded in sedimentary deposits may be used as chronostratigraphic tools11,13,14, which might be helpful for archaeological relative and absolute dating10,11,59,60. In the case of the record of the LSA midden overlying the WS member, it may be useful to correlate LSA deposits from South Africa. The anomalous directions of the lower portion of KR1, in the WS member, may be instrumental to relate MSA deposits. The palaeosecular variation observed in the middle part of KR1 and KR2 magnetograms, relating to the MSA, may also be used with a similar aim.10,61,62 Hence, the observed likely palaeomagnetic features have much potential to be useful as a marker for deposits containing LSA and MSA remains, respectively, in the region.
Acknowledgements
The project 'Geomagnetic field excursions for Late Pleistocene-Holocene deposits in South Africa and Lesotho: Geoarchaeological and chronological implications for the Later and Middle Stone Age' was co-funded by the DST/NRF Centre of Excellence (CoE) in Palaeosciences and the Palaeontological Scientific Trust (PAST) with two research grants to Pd.l.P The support of the CoE in Palaeosciences towards this research is hereby acknowledged. Opinions expressed and conclusions arrived at, are those of the authors and are not necessarily to be attributed to the CoE in Palaeosciences. The University of the Witwatersrand and Universidad de Buenos Aires provided logistical and technical support. S.W.'s work is based on research supported by the National Research Foundation (NRF) of South Africa. Any opinion, finding, conclusion or recommendation expressed herein is that of the author(s) and the NRF does not accept any liability in this regard. A. Rapalini, H. Vizán, T. Luppo, W. Banks, S.E. Bentsen and Steven Walker kindly assisted in different aspects relating to this article. The anonymous reviewers provided useful observations, help and cooperation during the review of this paper.
Authors' contributions
H.G.N. and P.d.l.P. conceptualised the project; H.G.N. performed the palaeomagnetic analyses; J.F. performed the OSL analysis; C.A.V. performed the rock magnetism analysis; H.G.N., S.W. and P.d.l.P. performed the field work; and H.G.N., C.A.V., P.d.l.P., S.W. and J.F. wrote the manuscript.
References
1. Wurz S. Technological trends in the Middle Stone Age of South Africa between MIS 7 and MIS 3. Curr Anthropol. 2013;54(S8):305-319. http://dx.doi.org/10.1086/673283 [ Links ]
2. Mackay A, Stewart BA, Chase BM. Coalescence and fragmentation in the late Pleistocene archaeology of southernmost Africa. J Hum Evol. 2014;72:26-51. http://dx.doi.org/10.1016/j.jhevol.2014.03.003 [ Links ]
3. Wadley L. Those marvellous millennia: the Middle Stone Age of Southern Africa. Azania. 2015;50(2):155-226. http://dx.doi.org/10.1080/0067270X.2015.1039236 [ Links ]
4. Lombard M, Wadley L, Deacon J, Wurz S, Parsons I, Mohapi M, et al. South African and Lesotho Stone Age sequence updated (I). S Afr Archaeol Bull. 2012;67(195):120-144. [ Links ]
5. Jacobs Z, Roberts RG, Galbraith RF, Deacon HJ, Gran R, Mackay A, et al. Ages for the Middle Stone Age of southern Africa: Implications for human behavior and dispersal. Science. 2008;322(5902):733-735. http://dx.doi.org/10.1126/science.1162219 [ Links ]
6. Jacobs Z, Roberts RG. An improved single grain OSL chronology for the sedimentary deposits from Diepkloof Rockshelter, Western Cape, South Africa. J Archaeol Sci. 2015;63:165-192. http://dx.doi.org/10.1016/j.jas.2015.01.023 [ Links ]
7. Tribolo C, Mercier N, Douville E, Joron JL, Reyss JL, Rufer D, et al. OSL and TL dating of the Middle Stone Age sequence at Diepkloof Rock Shelter (South Africa): A clarification. J Archaeol Sci. 2013;40(9):3401-3411. http://dx.doi.org/10.1016/j.jas.2012.12.001 [ Links ]
8. Kodama KP Palaeomagnetism of sedimentary rocks: Process and interpretation. Chichester: Wiley-Blackwell; 2012. http://dx.doi.org/10.1002/9781118384138 [ Links ]
9. Stenberg RS The geophysical basis of archaeomagnetic dating. In: Eighmy JL, Sternberg RS, editors. Archaeomagnetic dating. Tucson, AZ: University of Arizona Press; 1990. p. 5-28. [ Links ]
10. Tarling DH. Palaeomagnetism: Principles and applications in geology, geophysics, and archaeology. New York: Chapman and Hall; 1983. http://dx.doi.org/10.1007/978-94-009-5955-2 [ Links ]
11. Barendrest RW. Using palaeomagnetic remanence and magnetic susceptibility data for the differentation, relative correlation and absolute dating of quaternary sediments. In: Mahaney WC, editor. Quaternary dating methods. Amsterdam: Elsevier; 1984. p. 101-140. http://dx.doi.org/10.1016/S0920-5446(08)70067-0 [ Links ]
12. Parkes PA. Current scientific techniques in archaeology. New York: St. Martin's Press; 1986. [ Links ]
13. Herz N, Garrison EG. Geological methods for archaeology. New York: Oxford University Press; 1998. [ Links ]
14. Merrill RT, McFadden PL. The use of magnetic field excursions in stratigraphy. Quaternary Res. 2005;63:232-237. http://dx.doi.org/10.1016/j.yqres.2005.02.007 [ Links ]
15. Westaway R. The effect of changes in the earth's moment of inertia during glaciation on geomagnetic polarity excursions and reversals: Implications for Quaternary chronology. Curr Sci. 2003;84:1105-1115. [ Links ]
16. Lund SP Williams T, Acton G, Clement B, Okada M. Brunhes epoch magnetic field excursions recorded in ODP Leg 172 sediments. In: Keigwin V, Rio D, Acton G, editors. Proceedings of the Ocean Drilling Project, Scientific Results. 2001;172, Art. #10, 18 pages. http://dx.doi.org/10.2973/odp.proc.sr.172.216.2001 [ Links ]
17. Lund SP Stoner JS, Channell JET, Acton G. A summary of Brunhes paleomagnetic field variability recorded in Ocean Drilling Program cores. Phys Earth Planet In. 2006;156:194-204. http://dx.doi.org/10.1016/j.pepi.2005.10.009 [ Links ]
18. Laj C, Channel JET. Geomagnetic excursions. In: Kono M, editor. Treatise on geophysics. Amsterdam: Elsevier; 2007. p. 373-416. http://dx.doi.org/10.1016/b978-044452748-6/00095-x [ Links ]
19. Singer B. A Quaternary geomagnetic instability time scale. Quat Geochronol. 2014:29-52. http://dx.doi.org/10.1016/j.quageo.2013.10.003 [ Links ]
20. Watkins N. Polarity group sets up guidelines. Geotimes. 1976;21:18-20. [ Links ]
21. Thouveny N, Creer KM. Geomagnetic excursions in the past 60 ka: Ephemeral secular variation features. Geology. 1992;20:399-402. http://dx.doi.org/10.1130/0091-7613(1992)020<0399:GEITPK>2.3.CO;2 [ Links ]
22. Verosub K, Banerjee SK. Geomagnetic excursions and their paleomagnetic record. Rev Geophys. 1977;15:145-155. http://dx.doi.org/10.1029/RG015i002p00145 [ Links ]
23. Gubbins D. The distinction between geomagnetic excursions and reversals. Geophys J Int. 1999;137:F1-F4. http://dx.doi.org/10.1046/j.1365-246x.1999.00810.x [ Links ]
24. Jacobs JA. Geomagnetic excursion. In: Gubbins D, Herrero-Bervera E, editors. Encyclopedia of geomagnetism and paleomagnetism. Dordrecht: Springer; 2007. p. 311-313. http://dx.doi.org/10.1007/978-1-4020-4423-6_115 [ Links ]
25. Nowaczyk NR, Frederichs TW, Eisenhauer A, Gard G. Magnetostratigraphic data from late Quaternary sediments from the Yermak Plateau, Arctic Ocean: Evidence for four geomagnetic polarity events in the last 170 ka of the Brunhes Chron. Geophys J Int. 1994;117:453-471. http://dx.doi.org/10.1111/j.1365-246X.1994.tb03944.x [ Links ]
26. Thackeray JF, Kirschvink JL, Raub TD. Palaeomagnetic analyses of calcified deposits from the Plio-Pleistocene hominid site of Kromdraai, South Africa. S Afr J Sci. 2002;98:537-540. [ Links ]
27. Herries AIR, Adams JW, Kuykendall KL, Shaw J. Speleology and magnetobiostratigraphic chronology of the GD 2 locality of the Gondolin hominin-bearing paleocave deposits, North West Province, South Africa. J Hum Evol. 2006;51:617-631. http://dx.doi.org/10.1016/j.jhevol.2006.07.007 [ Links ]
28. Herries AIR, Shaw J. Palaeomagnetic analysis of the Sterkfontein palaeocave deposits: Implications for the age of the hominin fossils and stone tool industries. J Hum Evol. 2011;60:523-539. http://dx.doi.org/10.1016/j.jhevol.2010.09.001 [ Links ]
29. Nami HG. Possible Holocene excursion of the earth's magnetic field in southern South America: New records from archaeological sites in Argentina. Earth Planet Space. 1999;51:175-191. http://dx.doi.org/10.1186/BF03352222 [ Links ]
30. Nami HG. Probable Middle Holocene geomagnetic excursion at the Red Rock Archaeological Site, California. Geofís Int. 1999;18:239-250. [ Links ]
31. Nami HG. New detailed Holocene paleomagnetic records with anomalous geomagnetic field behavior in Argentina. Geoacta. 2012;37(2):83-116. [ Links ]
32. Nami HG. New paleomagnetic results and evidence for a geomagnetic field excursion during the Pleistocene-Holocene transition at Pichincha Province, Ecuador. Geofís Int. 2015;52:127-148. http://dx.doi.org/10.1016/j.gi.2015.04.009 [ Links ]
33. Deacon HJ, Geleijnse VB. The stratigraphy and sedimentology of the main site sequence, Klasies River, South Africa. S Afr Archaeol Bull. 1988;43:5-14. http://dx.doi.org/10.2307/3887608 [ Links ]
34. Singer R, Wymer J. The Middle Stone Age at Klasies River Mouth in South Africa. Chicago, IL: University of Chicago Press; 1982. [ Links ]
35. Deacon HJ. Two Late Pleistocene-Holocene archaeological depositories from the southern Cape, South Africa. S Afr Archaeol Bull. 1995;50:121-131. http://dx.doi.org/10.2307/3889061 [ Links ]
36. Deacon HJ, Wurz S. Middle Pleistocene populations and the emergence of modern behaviour. In: Barham L, Robson Brown K, editors. Human roots: Africa and Asia in the Middle Pleistocene. Bristol: Western Academic Press; 2001. p. 55-63. [ Links ]
37. Binneman JNF. Symbolic construction of communities during the Holocene Later Stone Age in the southeastern Cape [Phd thesis]. Johannesburg: University of the Witwatersrand; 1995. [ Links ]
38. Butzer KW. Sediment stratigraphy of the Middle Stone Age sequence at Klasies River Mouth, Tsitsikama Coast, South Africa. S Afr Archaeol Bull. 1978;33(128):141. http://dx.doi.org/10.2307/3888151 [ Links ]
39. Bada JL, Deems L. Accuracy of dates beyond 14C dating limit using the aspartic acid racemisation reaction. Nature. 1975;255:218-219. http://dx.doi.org/10.1038/255218a0 [ Links ]
40. Feathers JK. Luminescence dating in less than ideal conditions: Case studies from Klasies River main site and Duinefontein, South Africa. J Archaeol Sci. 2002;29:177-194 http://dx.doi.org/10.1006/jasc.2001.0685 [ Links ]
41. Hrouda F. Models of frequency-dependent susceptibility of rocks and soils revisited and broadened. Geophys J Int. 2011;187:1259-1269. http://dx.doi.org/10.1111/j.1365-246X_2011.05227.x [ Links ]
42. Shcherbakov VP, Fabian K. On the determination of magnetic grain-size distributions of superparamagnetic particle ensembles using the frequency dependence of susceptibility at different temperatures. Geophys J Int. 2005;162:736-746. http://dx.doi.org/10.1111/j.1365-246X_2005.02603.x [ Links ]
43. Chadima M, Hrouda F. Ramasoft 3.0. Paleomagnetic data browser and analyzer. Brno: Agico Inc.; 2007. [ Links ]
44. Kirschvink JL. The least-squares line and plane and the analysis of palaeomagnetic data. Geophys J R Astr Soc. 1980;62:699-718. http://dx.doi.org/10.1111/j.1365-246X.1980.tb02601.x [ Links ]
45. Fisher RA. Dispersion on a sphere. Proc R Soc Ser A. 1953;217:295-305. http://dx.doi.org/10.1098/rspa.1953.0064 [ Links ]
46. Nami HG. New detailed paleosecular variation record at Santa Lucía archaeological site (Corrientes Province, northeastern Argentina). Geofís Int. 2011;50(2):163-175. [ Links ]
47. Vizán H, Van Zele MA. Jurassic-Early Cretaceous intermediate virtual geomagnetic poles and Pangaean subduction zones. Earth Planet Sci Lett. 2008;266(1-2):1-13. http://dx.doi.org/10.1016/j.epsl.2007.09.044 [ Links ]
48. Langereis CG, Van Hoof AAM, Rochette P. Longitudinal confinement of geomagnetic reversal paths as a possible sedimentary artifact. Nature. 1992;358:228-230. http://dx.doi.org/10.1038/358226a0 [ Links ]
49. Nami HG. Paleomagnetic results from Argentinean Patagonia: New evidence for the Holocene geomagnetic excursion in southern South America. In: Fernandez LD, editor. The Quaternary period. In press 2015. [ Links ]
50. Petrova GN, Pospelova GA. Excursions of the magnetic field during the Brunhes Chron. Phys Earth Planet In. 1990;63:135-143. http://dx.doi.org/10.1016/0031-9201(90)90067-8 [ Links ]
51. Wiegank F, Petrova GN, Pospelova GA. Magneto-chronostratigraphic scale model, Brunhes Chron. Geomag Field Quat. 1990;62:169-177. [ Links ]
52. Dergachev VA, Raspopov OM, Van Geel B, Zaitseva GI. The 'Sterno-Etrussia' geomagnetic excursion around 2700 BP and changes of solar activity, cosmic ray intensity, and climate. Radiocarbon. 2004;46:661-681. [ Links ]
53. Guskova EG, Raspopov OM, Piskarev AL, Dergachev VA. Magnetism and paleomagnetism of the Russian Arctic marine sediments. In: Proceedings of the 7th International Conference 'Problems of Geocosmos'; 2008 May 2630; St. Petersburg, Russia. St. Petersburg: St. Petersburg State University; 2008. p. 380-385. [ Links ]
54. Lund SP, Platzman E, Thouveny N, Camoin G. Evidence for two new paleomagnetic field excursions ~2,500 and ~12,500 years ago from the South Pacific Ocean Region (Tahiti). American Geophysical Union Fall Meeting; 2007 December 10-14; San Francisco, CA, USA. Washington DC: American Geophysical Union; 2007. Abstract #GP42A-05. Available from: http://adsabs.harvard.edu/abs/2007AGUFMGP42A..05L [ Links ]
55. Nami HG, Sinito AM. Evidence of a possible excursion of the geomagnetic field registered during the Late Holocene in the Province of Chubut, Argentina. Geoacta. 1993;20:19-26. [ Links ]
56. Sinito AM, Nami HG, Gogorza C. Analysis of palaeomagnetic results from Holocene sediments sampled at archaeological excavations in South America. Quaternary S Am Antarc Peninsula. 1997;10:31-44. [ Links ]
57. Guillou H, Singer BS, Laj C, Kissel C, Scaillet S, Jicha BR. On the age of the Laschamp geomagnetic excursion. Earth Planet Sci Lett. 2004;227:331-343. http://dx.doi.org/10.1016/j.epsl.2004.09.018 [ Links ]
58. Nowaczyk NR, Arz HW, Frank U, Kind J, Plessen B. Dynamics of the Laschamp geomagnetic excursion from Black Sea sediments. Earth Planet Sci Lett. 2012;351-352:54-69. http://dx.doi.org/10.1016/j.epsl.2012.06.050 [ Links ]
59. Thompson R. Paleomagnetic dating. In: Smart PL, Frances PD, editors. Quaternary dating methods - A user's guide. Technical guide 4. Cambridge: Quaternary Research Association; 1983. p. 177-197. [ Links ]
60. Wolfman D. Geomagnetic dating methods in archaeology. Adv Arch Method Theory. 1984;7:363-458. http://dx.doi.org/10.1016/B978-0-12-003107-8.50011-6 [ Links ]
61. Opdyke ND, Channell JET. Magnetic stratigraphy. San Diego, CA: Academic Press; 1996. http://dx.doi.org/10.1016/S0074-6142(06)80010-0 [ Links ]
62. Stoner JS, St-Onge G. Magnetic stratigraphy in paleoceanography: Reversals, excursions, paleointensity, and secular variation. Developments Mar Geol. 2007;1:99-138. http://dx.doi.org/10.1016/S1572-5480(07)01008-1 [ Links ]
 Correspondence:
Paloma de la Peña
paloma.delapenya@gmail.com
Received: 17 Feb. 2016
Revised: 13 June 2016
Accepted: 17 June 2016
FUNDING: DST/NRF Centre of Excellence in Palaeosciences; Palaeontological Scientific Trust; National Research Foundation (South Africa)

