


Servicios Personalizados
Articulo
 Inglés (pdf)
 Articulo en XML
 Referencias del artículo
Indicadores

Links relacionados
-
 Citado por Google
 -
 Similares en Google
Compartir

 Permalink
South African Journal of Science
versión On-line ISSN 1996-7489
versión impresa ISSN 0038-2353
S. Afr. j. sci. vol.112 no.11-12 Pretoria nov./dic. 2016
http://dx.doi.org/10.17159/sajs.2016/a0184
COMMENTARIES
A note on aspects of risk and return for South African bond investors
Eben Maré
Department of Mathematics and Applied Mathematics, University of Pretoria, Pretoria, South Africa
Gentlemen prefer bonds - Andrew Mellon (1855-1937)
South African bond returns typically increase with duration. On a risk-adjusted basis, I demonstrate that bond returns appear most attractive in the short to medium maturity-term area.
Bond risk and returns
Bonds represent debt instruments that allow issuers to finance capital needs. The bond represents an obligation of the issuer to pay the holder principal as well as regular interest amounts. Typical bond issuers are sovereign governments. According to a National Treasury report1, the size of the South African debt capital markets measured in excess of ZAR2 trillion as at the end of March 2015.
Using returns from the 2016 version of the Credit Suisse Global Investment Sourcebook2, I observe that over the period 1900 to 2015, the annualised real return for South African bonds was 1.8% compared with 1.0% for shorter-term bills. Inflation measured 4.9% per year over this period (i.e. the nominal yield on bonds was 6.7% compared with 5.9% for bills). In comparison, US annual real returns were 2.0% for bonds and 0.8% for bills and inflation was 2.9% over the same period.
Bond returns have varied considerably. Over the period 2000 to 2015, for example, South African annual real bond returns amounted to 4.9% compared to real returns of 2.2% on shorter bills.2 (In comparison the US return for the same period was 5.4% for bonds and -0.4% for bills.)
Bonds are inherently more risky than bills. Bonds mostly represent longer-term financial commitments than bills. It would therefore seem 'intuitively obvious' that bonds should yield higher returns (on average) than bills.3-6
I am specifically interested in the question of whether the excess return of bonds over bills represents an adequate investment case in the South African market, measured in terms of risk versus return. In essence I am trying to answer the question: Which bonds would I invest in to achieve the best risk/reward? Traditionally bond risk is measured in terms of so-called duration7 and volatility of returns. I shall, however, use VaR and CVaR as defined below8 to measure risk.
The All Bond Index (ALBI)9 is a composite index of the top 20 bonds in South Africa, dually ranked on the basis of market capitalisation as well as liquidity (bonds with a maturity of less than 1 year are excluded). The ALBI01, for example, represents a sub-index of the ALBI which includes only bonds with a maturity of 1-3 years.
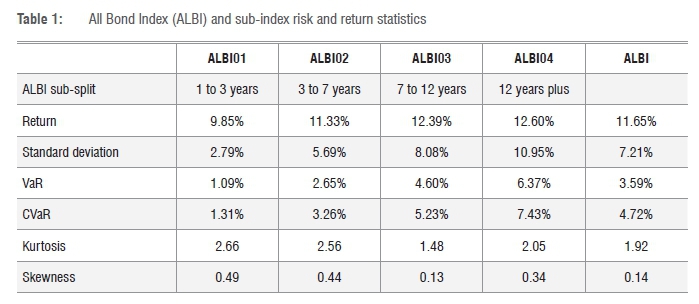
For the purposes of this study, I collected monthly total return data over the period 31 December 1999 to 31 December 2015, considering the ALBI and its sub-indices. Annualised, average monthly return and risk statistics are shown in Table 1. VaR denotes the so-called value-at-risk at 98% confidence, i.e. a loss level one would anticipate experiencing with a 2% frequency. The conditional VaR (CVaR) is the loss-expectation of realisations below the 98%-VaR level (see Alexander8).
The reader will notice the increase in returns between the ALBI01 to ALBI04 buckets, which is accompanied by a rise in the risk levels as measured by the standard deviation of returns, VaR and CVaR measures.
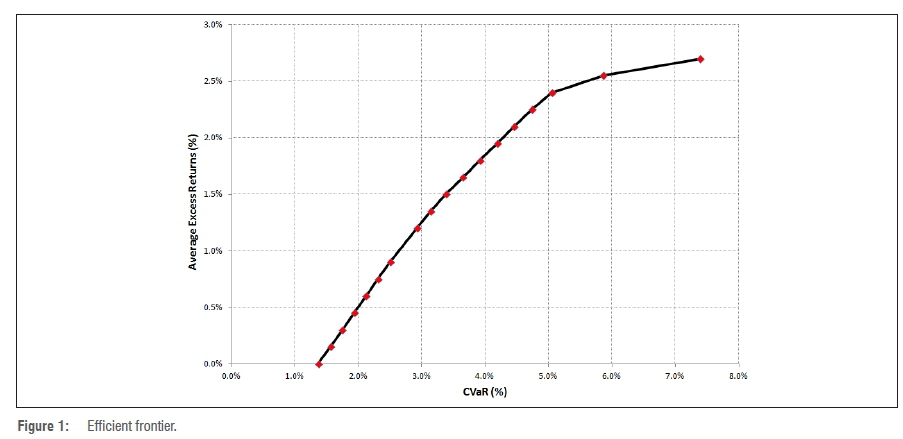
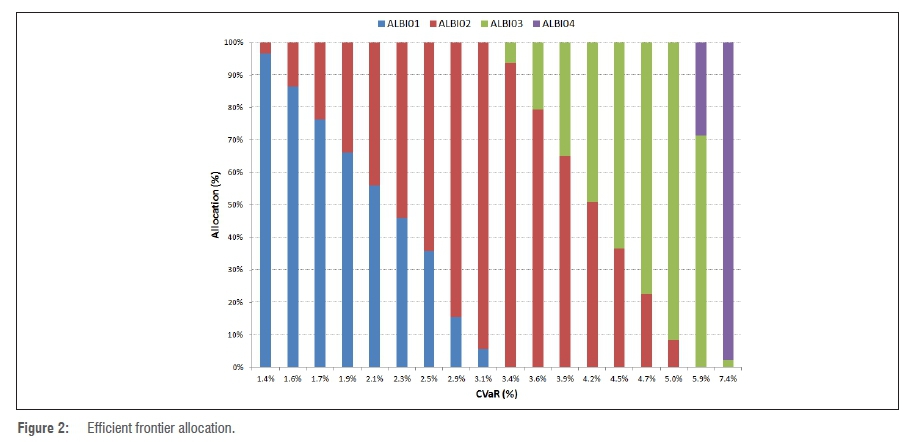
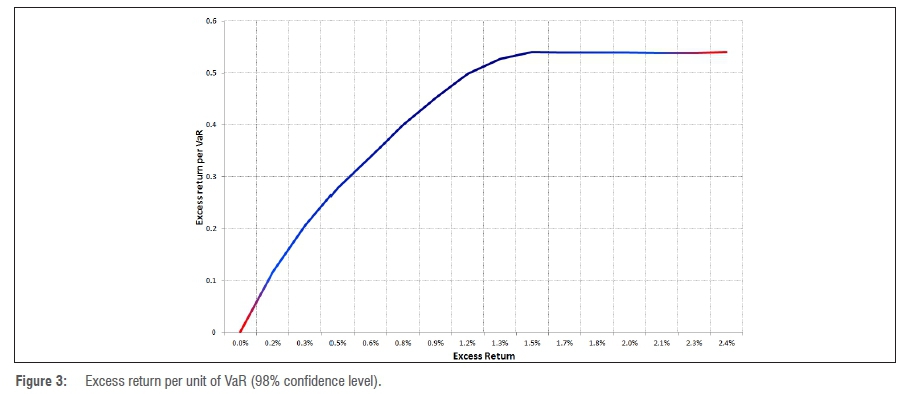
I treat the ALBI sub-indices as investable portfolios. I solve for various portfolios (combinations of ALBI01 to ALBI04) using the monthly returns data, which yield specific excess return levels at the lowest risk measured in terms of CVaR. Figure 1 denotes the efficient frontier so obtained. Figure 2 shows the allocation of assets across ALBI01 to ALBI04 (higher excess returns require more allocation to higher yielding assets and corresponding levels of risk) based on the efficient frontier. In Figure 3, I calculate the ratio of the VaR corresponding to a certain excess return portfolio - this figure shows that investors are (on average) not compensated for bearing extra risk in terms of longer duration. Allocation to longer duration portfolios should therefore be based on a tactical view pertaining to the business cycle (see Ilmanen10).
Conclusion
On the basis of average monthly returns of investable bond indices, I observe that excess bond returns tend to increase as the corresponding duration increases. On a risk-adjusted basis, however, it would appear that South African bond investors achieve optimal results using short-duration portfolios. Short-duration bond portfolios also outperform bills. Long-duration extension could enhance returns based on tactical views such as the business cycle and inflationary expectations.
References
1. South African National Treasury. Debt management report 2014/2015. Pretoria: National Treasury; 2015. Available from: http://www.treasury.gov.za/publications/other/Debt%20Management%20Report%202014-15.pdf [ Links ]
2. Dimson E, Marsh P Staunton M. Credit Suisse Global Investment Returns Sourcebook 2016. Zurich: Credit Suisse; 2016. [ Links ]
3. Ilmanen A. Does duration extensions enhance long-term expected returns? J Fixed Income. 1996;6(2):23-36. http://dx.doi.org/10.3905/jfi.1996.408172 [ Links ]
4. Fama EF. Term premiums in bond returns. J Financ Econ. 1984;13(4):529-546. http://dx.doi.org/10.1016/0304-405X(84)90014-X [ Links ]
5. Durham JB. Another view on US Treasury term premiums. FRB of New York Staff Report 658. 2013 December 01. http://dx.doi.org/10.2139/ssrn.2377405 [ Links ]
6. Grieves R, Mann SV Marcus AJ, Ramanlal P. Riding the bill curve. J Portfolio Manage. 1999;25(3):74-82. http://dx.doi.org/10.3905/jpm.1999.319717 [ Links ]
7. Ilmanen A. How well does duration measure interest rate risk? J Fixed Income. 1992;1(4):43-51. http://dx.doi.org/10.3905/jfi.1992.408032 [ Links ]
8. Alexander C. Market risk analysis. Volume IV: Value at risk models. Chichester: John Wiley & Sons; 2009. [ Links ]
9. Johannesburg Stock Exchange. All Bond Indices [homepage on the Internet]. No date [cited 2016 Oct 24]. Available from: https://www.jse.co.za/services/market-data/indices/fixed-income-index-series/all-bond-indices [ Links ]
10. Ilmanen A. Forecasting US bond returns. J Fixed Income. 1997;7(1):22-37. http://dx.doi.org/10.3905/jfi.1997.408197 [ Links ]
 Correspondence:
Eben Maré
Eben.mare@up.ac.za

