


Servicios Personalizados
Articulo
 Inglés (pdf)
 Articulo en XML
 Referencias del artículo
Indicadores

Links relacionados
-
 Citado por Google
 -
 Similares en Google
Compartir

 Permalink
South African Journal of Science
versión On-line ISSN 1996-7489
versión impresa ISSN 0038-2353
S. Afr. j. sci. vol.112 no.9-10 Pretoria sep./oct. 2016
http://dx.doi.org/10.17159/sajs.2016/20150427
RESEARCH ARTICLES
http://dx.doi.org/10.17159/sajs.2016/20150427
An extended farm site development method
Eugene Hanekom; Andre Liebenberg; Marné de Vries
Department of Industrial Engineering, University of Pretoria, Pretoria, South Africa
ABSTRACT
The inefficient and ineffective use of arable land in South Africa is one of the numerous challenges within its agricultural sector. Previous research has indicated that a method, the Farm Site Development Method (FSDM), could increase the effective and efficient use of arable land by providing a roadmap to the farm owner for incrementally transforming the current state facilities and resources of a farm towards a future saturation state. The FSDM was then demonstrated at a crop-producing farm and several opportunities existed to extend its utility. Here we suggest its extension for application to a livestock farm, and also include optimisation techniques, demand planning and financial planning.
SIGNIFICANCE:
• Extension of the Farm Site Development Method, and its demonstration at a livestock farm, for facilities and financial planning within the agricultural sector
Keywords: method engineering; farm facilities planning; financial planning; optimisation; strategic planning
Introduction and background
The primary agricultural sector in South Africa is growing.1 Yet there has been a drop in GDP contribution from 7.1% in 1970 to 2.6% in 2013.2 Numerous factors influence the slow growth of this sector, such as climate change3, the land reform projects of which at least 50% failed4, and inefficient use of arable land5. Previous work has already identified an opportunity to improve the efficient and effective use of arable land by introducing long-term planning techniques to the agricultural sector. A new artefact was developed, called the Farm Site Development Method (FSDM), as a roadmap for incrementally transforming the current state facilities and resources of an existing farm towards a future saturation state that is financially feasible. The FSDM was evaluated with a demonstration at a crop-producing farm.6
Although the FSDM was useful to a crop-growing farm, several deficiencies were identified during the demonstration of the method: (1) optimisation techniques were not used to optimise product mix, (2) demand planning was not incorporated to forecast production requirements, and (3) financial planning did not consider cash flow.6 In addition, drawing knowledge from the field of method engineering, we postulated that the utility of the FSDM could be further improved. The existing FSDM could also be further extended for use on other types of farms, such as livestock farms.
Background literature
Previous research combined existing techniques, i.e. facilities planning and incremental design, to the agricultural sector. Because current facilities or resources may be depleted when the farming enterprise grows, active planning is required for their replacement or extension. The FSDM was developed to evolve the farm facilities in a phased approach towards its future or saturation state.6
The FSDM
The FSDM comprises eight sequential steps6:
1. Analyse the current-state facility layout.
2. Calculate the saturation state for the farm (compile a saturation-state facility layout).
3. Determine the production requirements and the saturation date.
4. Identify critical resources, utilities, services and/or structures (RUSS) and the design criteria.
5. Identify and evaluate alternatives for RUSS replacement or extension.
6. Compile a series of phase plans, called the farm site development plan (FDP).
7. Represent phase plans graphically in support of the FDP
8. Validate the FDP
Each step is elaborated in more detail in Van der Merwe et al.6 As the FSDM could be classified as a method artefact, the field of method engineering applies and will be discussed next.
Method engineering, situational method engineering and utility criteria
Method engineering has developed within the information systems discipline as a field concerned with the construction of new methods from existing methods.7 One of the areas in method engineering - situational method engineering - has the objective of constructing methods which are tuned to specific situations and project types.8,9 Whereas a new method is constructed according to requirements, situational method engineering requires adaptation of a generic method according to project-specific needs.10 Because this article focuses on the extension of an existing method (the FSDM), guidelines from situational method engineering were applicable in adapting the generic FSDM for different situations, i.e. a crop-producing farm versus a livestock farm.
Based on the structure specified by Gregor and Jones11 for design theory, Offerman et al.10 consider utility as the primary evaluation criterion for evaluating a design theory. They define four criteria in terms of utility: (1) validity/credibility as the ability of a method to yield the claimed utility within the intended scope, (2) objectivity/confirmability as the degree to which others are able to confirm the utility statement, (3) generalisability as the assumption that the utility statement holds true for all possible instances within the scope, and (4) transferability as the postulation that the utility statement would also be partially true for out-of-scope situations. From the four criteria, Offerman et al.10 developed guiding questions for the components of a method theory, which we have applied below to identify utility deficiencies within the existing FSDM. We also evaluate the enhanced FSDM in terms of the four utility criteria of Offerman et al.10
First we introduce techniques that could be applied to extend the existing FSDM: linear programming, demand planning and financial planning.
Techniques to enhance the FSDM
Linear programming is a deterministic, optimising model that maximises or minimises a quantifiable objective. The objective could be expressed as a linear function of identified decision variables. The purpose is to optimise the objective by calculating values for the decision variables, given certain constraints. The constraints are also expressed as linear equations or linear inequalities.12
Demand planning deals with uncertainties within the business environment when predicting future demand of products. Time series analysis is useful if a relationship exists between the historical demand and future demand of the product, i.e. that past history of demand levels will influence the future behaviour of this demand over time.12 Historical demand data could be used to identify the average demand for a period, a trend, seasonal elements, cyclical elements, random variation and autocorrelation. Based on the analysis, different time series forecasting techniques may be useful.13
Financial planning concerns the optimal use of financial resources and should be performed on two levels - a strategic level and a tactical level. Strategic planning is concerned with long-term goals in the enterprise, such as product mix and new production facilities, whereas tactical planning ensures that existing resources are exploited. The end result of financial planning is to maximise the ratio of profits to the equity capital (i.e. capital used to acquire assets) employed.12 The financial planner needs to estimate income and costs, differentiating between variable and fixed costs. Seal et al.14 define variable costs as a cost type that varies in direct production to the level of activity (e.g. fertiliser for crop production), whereas fixed costs remain constant regardless of the level of activity (e.g. property tax).
Research design
The research design used to extend the FSDM - design research - values the creation of novel artefacts and provides a body of knowledge to guide the researcher during different stages of a design cycle.15 Previous research applied design research to develop a new method artefact, the FSDM. During the first iteration of the design cycle, the validity/credibility of the FSDM was evaluated by applying the FSDM to a crop-producing farm named Waterfall Farm. Several recommendations were made for enhancing the FSDM.6 Here we apply a second design cycle, using the five-step design cycle of Vaishnavi and Kuechler16 (see Figure 1, Process Steps), to develop an extended FSDM, called FSDMe.
Referring to Figure 1, 'Awareness of a problem' entailed identification of FSDM deficiencies and utility problems, which led to several 'Suggestions' that were incorporated during a creative 'Development' process for developing the FSDMe. The FSDMe underwent 'Evaluation' by demonstrating its application to a crop-growing farm, as well as a livestock farm. As previous work already demonstrated the FSDM on a crop-growing farm,6 here we present the demonstration of the FSDMe only on a livestock farm. Although we present the FSDMe as a theoretical contribution in this article, we have also developed a software application, using MS Excel, which presents a user-friendly interface to the user (e.g. practitioner or farm owner) of the FSDMe. The software application is available on request.
The extended Farm Site Development Method: FSDMe
The FSDMe is a method that is used to evolve farm facilities in a phased approach towards its future or saturation state. The FSDMe comprises nine steps and the structure (as depicted in Figure 2) is as follows:
• The purpose (utility-statement), scope, prerequisites, roles and input requirements/data of the FSDMe.
• The method steps and extension points to accommodate different contexts.
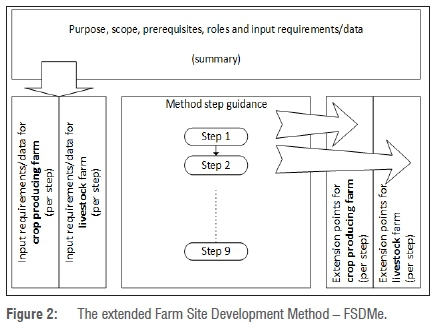
Purpose, scope, prerequisites, roles and input requirements/data
Purpose: The FSDMe is a strategic planning tool that facilitates production growth on an existing farm of fixed size and the incremental extension of its facilities towards the saturation state. The main output of this method is a FDP, which accommodates financial and other criteria.
Scope: The FSDMe has been demonstrated on a crop-producing farm as well as a livestock farm. For the crop-producing farm, the FSDMe requires choice of crop products as input, but does not aim to optimise the production mix proportions. For a livestock farm, the FSDMe similarly requires a choice of animal type as input, but also optimises the proportion of animal types. Furthermore, it is assumed that the livestock farm produces crops for the sole purpose of feeding livestock. For a livestock farm we also assume that calves and lambs are only feeding from their mother and do not need to graze. If additional feeding is required, calves and lambs receive creep feed (a blend of maize, molasses, proteins and micro- and macro-minerals). We also assume that calves are sold once they are weaned.
Prerequisites: Decisions about crop varieties and crop production mix should have been made (based on market analyses and soil analyses) prior to using the FSDMe.
Roles: The farm owner or the practitioner will be applying the FSDMe to generate the FDP The farm owner or practitioner should have practical knowledge of the farming industry and the farm produce. As an example, the owner or practitioner of a livestock farm needs to have skills pertaining to breeding techniques, feeding of livestock, knowledge about natural grazing and livestock diseases.
Input requirements: See Table 1.
Method steps with extension points
Step 1: Analyse the current-state facility layout Input: Existing farm layout plans
Method step guidance: Conduct a site visit to confirm and supplement existing layout plans, photos, GPS coordinates and land surveys. If available, existing plans should be used to draw the current-state facility plan using an appropriate drawing program, such as AutoCAD. If no existing layout plans are available, use GPS coordinates to map the current-state facility layout, indicating all buildings and site features to scale.
Step 2: Calculate the arable land Input: Total area of the farm (ha)
Method step guidance: Calculate the arable land (a) of the farm (in hectares) as total area less all existing facilities, production areas and road areas.
Step 3: Calculate the yield potential to generate a facility layout at saturation state
Input: Arable land (a) from previous step Inputs - crop-producing farm:
• Varieties produced and percentage production for each variety
• Crop growth times for reaching maturity (weeks)
• Planting density (units per ha), u
• Waste or cut rate (in percentage), d Inputs - livestock farm:
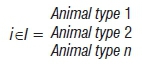
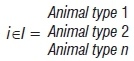
• Choice of animal type (note: production mix proportions are not required), i
• Choice of feed crops per farm section
• Equivalent livestock units (in LU) for each animal type
• Selected breeding technique (insemination or synchronisation or natural breeding) and number of females f associated with one male during breeding for animal type i
• Production potential (in offspring/year) of each female animal type i......(o1, o2, ...,oi)
• Section sizes (ha) .....(a1, a2, ..., ak)
• Section yield (LU/ha/year) ......(u1, u2, ..., uk)
• Variable costs (animal feed, veterinary, etc.) and associated inflation rates
• Auction price of animal type i (when selling) and associated inflation rate
• Auction price of animal type i (when buying) and associated inflation rate
Method step guidance: The objective is to estimate the yield potential (y) of the farm at saturation state. Based on the yield potential, use a drawing tool to represent the facility layout at the saturation state.
Extension - crop-producing farm:
Yield potential on a crop-producing farm is calculated by:

where ycis the crop yield potential (units), a is the arable land size (ha) and u is the maximum surface utilisation, i.e. maximum number of crop units that could be grown per hectare.
The yield potential at saturation state could also be converted to potential production rate (pu) in units per week and potential production rate (ps) in standardised units per week.

where x is the average growth timeframe of all crop varieties to reach maturity (in weeks), also incorporating seasonality and growth times for different crop varieties, d is the average loss of production units (in units) before distribution and y is the yield potential (units), calculated in Equation 1.

where puis the potential production rate in units per week, calculated in Equation 2, and s is the number of production units per standardised unit, where the standardised unit is a packaging unit for transporting the units (produce).
Extension - livestock farm:
Yield potential on a livestock farm is calculated by:

where y is the yield potential (LU per year), a is the section size (ha)...... (a1, a2,...ak) and u is the section yield (LU/ha/year)......(u1, u2,...uk).
The yield potential could also be expressed as the number of animals of a particular type (Li) A linear programming model is used to calculate the values for Li to maximise profits (Z). Because not all animals are delivering offspring, a correction factor (fi/(fi+1)) reduces the income to account for the male individuals within the mix.
Therefore: 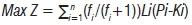
The constants are:
• yl= yield potential (LU per year), calculated in Equation 4
•χi = ratio animals of type i equivalent to 1 LU, where 1 cow = 1 LU, and iєI
• fi= number of females associated with 1 male according to the breeding technique for animal type
•ρi = the income generated from female animal type iєI in one year i.e. (selling price for animal type i)*(offspring/year oi for animal type i)
• Ki= the cost to keep animal type isI on the farm for one year The variables are:
• Li = The number of animals of type i to keep on the farm annually, where iєI
Subject to:
•
(saturation state LU may not exceed the LU capacity of the farm)
•
(relationship of different animal types on the farm remains constant)
As Lispecifies the total number of animals of type i, the breeding technique ratio should be used to calculate Lif (female animals of type i) and Li,m (male animals of type i):


Step 4: Determine the production requirements and the saturation date based on constraints
Inputs:
• If market demand is a constraint, historical production data are required
• Farmer-prioritised investment decisions (e.g. the decision to buy hail shields)
• Cash used for expansion (in percentage of total profits) Inputs - crop-producing farm:
• Variable costs (e.g. seeds, fertiliser, planting, harvesting, electricity) and associated inflation rates
• Fixed costs (e.g. asset depreciation, taxes) and associated inflation rates
• Product selling price and associated inflation rates
Inputs - livestock farm:
• Variable costs (feeding crops etc.) and associated inflation rates
• Fixed costs (e.g. asset depreciation, taxes, etc.) and associated inflation rates
• Auction price of animal type i (when selling) and associated inflation rate
• Auction price of animal type i (when buying) and associated inflation rate
• Percentage of old animals that are sold for animal type i
Method step guidance: Because the historical resource-acquisition decisions, existing cost structure and other investment decisions limit the cash available for production growth, this method acknowledges the need for incorporating cash flow calculations. The method is simplified by assuming that a fixed percentage of profits is used to expand production on the farm. The farmer also needs to determine if there is a demand constraint for the products. If a demand constraint exists, historical production data should be analysed to project future demand, using time series analysis. The saturation date is calculated as the date on which the saturation state is achieved, which gives an indication of the planning horizon for extending production on the farm. The projected growth of production (per product type) up to the saturation date could be demonstrated graphically.
Step 5: Identify critical RUSS and design criteria
Method step guidance: The specific farming industry should be considered when determining the most important RUSS required for the FDP, as well as the appropriate design criteria (e.g. financial and technical criteria) for evaluating alternatives pertaining to the RUSS. Based on the needs of the farm owner, additional criteria may have to be incorporated from best practice frameworks such as the Global GAP (Good Agricultural Practices), Farming for the Future, the Food Technical Standard and Protocol of the British Retail Consortium (BRC), Bird Friendly standards and Fair Trade standards.
Step 6: Identify and evaluate alternatives for RUSS replacement or extension
Input: Design criteria and RUSS identified in the previous step. Inputs - crop-producing farm:
• Potential production rate (ps) in standardised units per week, calculated in Equation 3
Method step guidance: A number of calculations is required to identify alternative restoration initiatives and to evaluate the alternative initiatives against the design criteria identified in Step 5.
• Determine the initial RUSS sizes (see 'Extension for crop-producing farm' below).
• Determine the first capacity depletion date for each of the RUSS. Use the expected production requirements or demand (calculated in Step 3) to determine when the capacity of specific RUSS will be depleted for the first time.
• Use the first capacity depletion date to determine the incremental restoration initiatives for each of the RUSS. Incremental restoration initiatives specify the size and quantity of the additional RUSS, based on the standard sizes available in industry and the increase in demand. Because the restored capacity of a resource or structure may be depleted several times within the planning horizon of the FDP, several incremental restoration initiatives will be required for each of the RUSS.
• Determine the restoration dates for the incremental restoration initiatives. Consider the design criteria (e.g. financial and technical) lead times for constructing and/or acquiring RUSS to complete restoration before capacity depletion occurs.
Extension for crop-producing farm:
Determine the initial RUSS sizes expressed in standardised units. Calculate the RUSS capacity that is currently used, given the existing production rate.
The existing production rate, expressed in standardised units is:
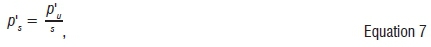
where p'uis the current production rate in units per week and s is the number of production units per standardised unit, where the standardised unit is a packaging unit for transporting the units (produce).
Step 7: Compile a series of phase plans: The FDP
Method step guidance: Considering the practicality of restoration activities, the practitioner needs to group the restoration dates in a series of phases (from one month to a year) for the entire planning horizon of the FDP. Phase identification enables budgeting and planning for each phase ahead of time.
Step 8: Represent phase plans graphically in support of the FDP
Method step guidance: Draw each phase of the FDP sequentially, starting at the current-state facility layout and ending with a saturationstate facility layout. Although the saturation-state facility layout may resemble the initial facility layout compiled in Step 3, a revised layout may be required to reflect changes in strategy, target market, product or technology.
Step 9: Validate the FDP
Method step guidance: The purpose of this step is to evaluate the sensitivity of the FDP in terms of the quantitative assumptions that were made during the development of the restoration alternatives for the critical RUSS. During this step, the practitioner assesses the rigour of the FDP when different input parameters (e.g. cost of labour) are used or major disasters (e.g. field fires and droughts) are considered. Additional qualitative validation may also be required to ensure that the FDP is useful to management.
Evaluation results: A practical demonstration at Bloemhoek Farm
We present a demonstration of the FSDMe at a livestock farm, which has been documented comprehensively in Hanekom17.
Input requirements/data
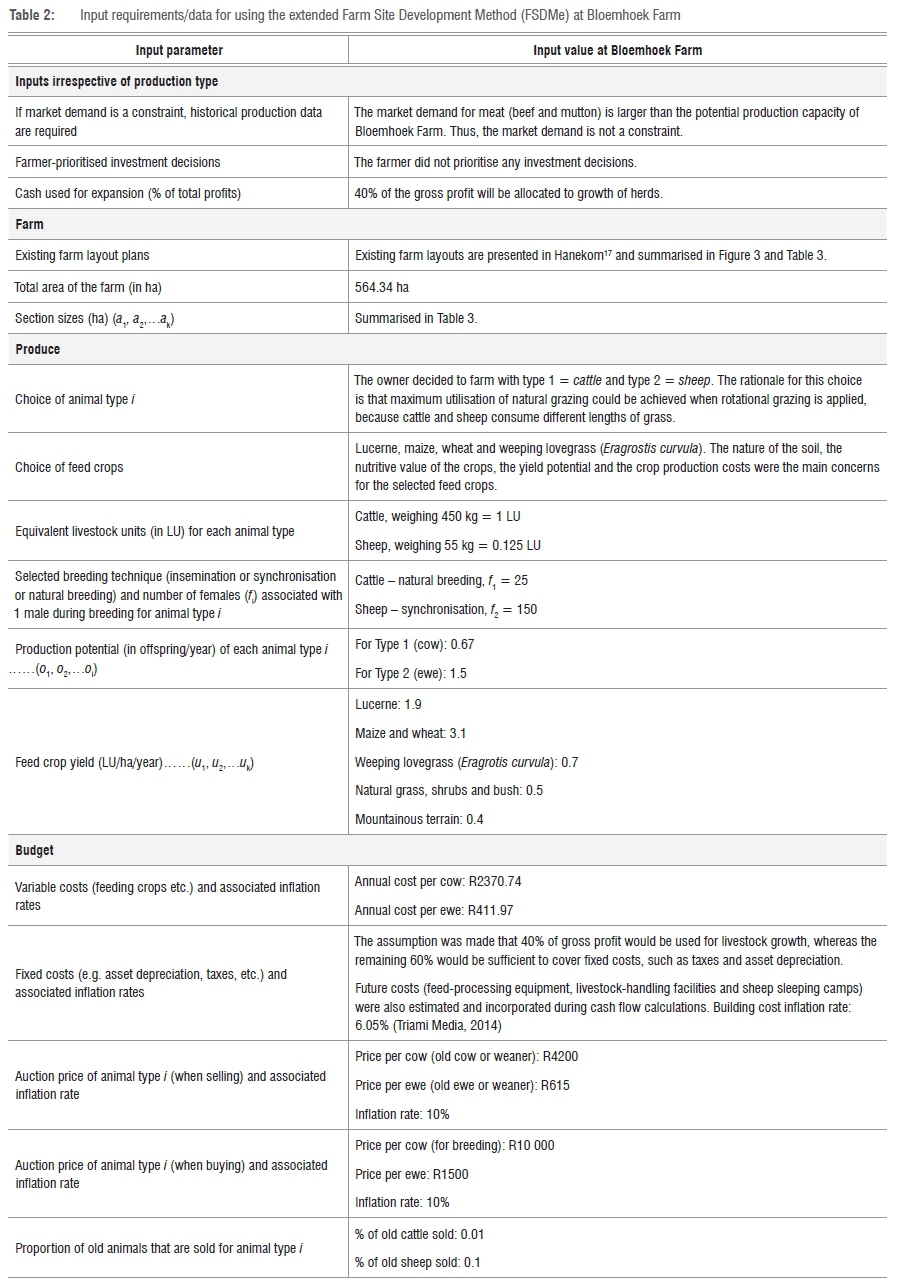
From Table 1 in the previous section, several inputs are required for applying the FSDMe steps. In this demonstration, we provide an interpretation of the inputs that were obtained for generating an FDP for Bloemhoek Farm in Table 2.
Applying the method steps
Applying the method step guidance given in the previous section, we demonstrate its application in this section.
Step 1: Analyse the current-state facility layout
According to Step 1, several inputs are required, which are declared in Table 2.
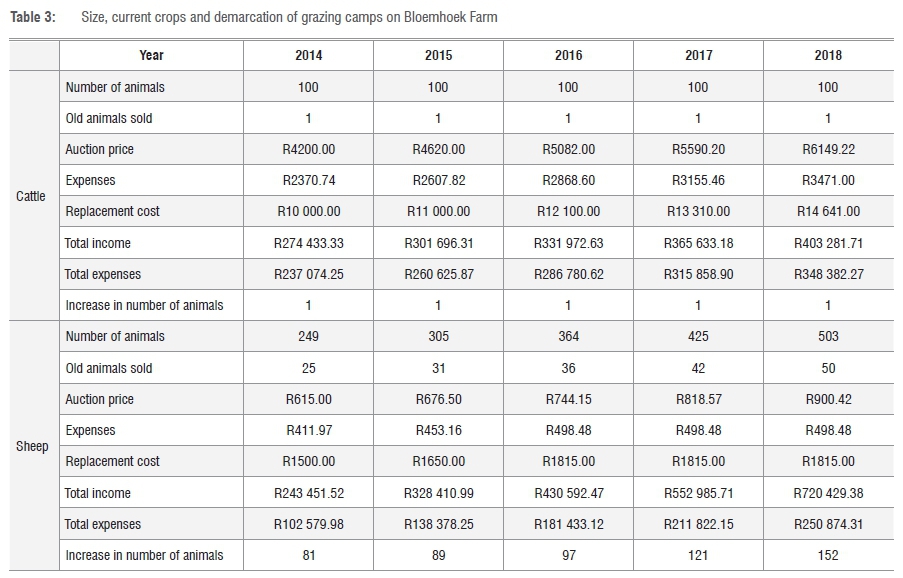
Method step application: The total area of the farm is divided into different feed yield sections (Figure 3). The yield capacity of each feed yield section is given in livestock unit per hectare (LU/ha) (Table 3), which is a standard unit used to measure the number of animals that would be able to graze in 1 ha annually. A fully grown cow of 450 kg is equivalent to one livestock unit. Table 3 also indicates the current crops planted in each section, as well as the demarcation of Sections 5, 6 and 7 into three grazing camps.
Step 2: Calculate the arable land
According to Step 2, several inputs are required, which are declared in Table 2.
Method step application: The arable land (a) = (total area (564.34) -existing facilities and road areas (39.05)) = 525.29 ha.
Step 3: Calculate the yield potential to generate a facility layout at saturation state
According to Step 3, several inputs are required, which are declared in Table 2.
Method step application: The yield sections are indicated in Figure 3.
Applying the extension for livestock farms: Yield potential on a livestock farm is calculated by:

where y is the yield potential (LU per year), a is the section size (ha) ...... (a1, a2, ..., ak) (see Table 3 for values) and u is the section yield (LU/ha/year) ......(u1, u2,..., uk) (see Table 3 for values).
Thus, using Equation 4, yield potential on Bloemhoek Farm, yI = 438.01 LU per year.
The yield potential could also be expressed as the number of animals of a particular type (L) A linear programming model is used to calculate the values for L. to maximise profits (Z). Therefore:

Constants:
• yI = yield potential (438.01 LU per year), calculated in Equation 4
•χi = ratio animals of type i equivalent to 1 LU, where 1 cow = 1 LU, and iєl
X1 = 1 (cattle)
X2 = 1/8 = 0.125 (sheep)
• fi= number of females associated with 1 male according to the breeding technique for animal type i
f1=25
f2= 150
• Pi = the income generated from female animal type iel in one year i.e. (selling price for animal type i)*(offspring/year oi for animal type i), in rands (ZAR)
P1 = (R4200)(0.67) = R2814
P2 = (R615)(1.5) = R922.5
• Ki= the cost to keep animal type iel on the farm for one year. The cost calculations are based on feed and veterinary costs associated with the specific farm.
K1= 2370.74
K2 = 411.97
Variables:
• Li = the number of animals of type i to keep on the farm annually, where i∈I
Subject to:
•
(saturation state LU may not exceed the LU capacity of the farm)
(substituting from Equation 4)
•
(relationship of different animal types on the farm remains constant)
Solving the linear programming model renders the following results:
L1= 126 (cattle) L2= 2496 (sheep)
Z = R215 143 (maximum profit at saturation state)
Because Li specifies the total number of animals of type i, the breeding technique ratio should be used to calculate Li,f (female animals of type i) and Li,m (male animals of type i):
• Li,f = (f /fi+1)Li ......from Equation 5
L1,f = (25/26)126 = 121 (cows)
L2,f = (150/151)2496 = 2479 (ewes)
• Li,m = L - Li,f ......from Equation 6
L1,m= 126 - 121 = 5 (bulls)
L2,m = 2496 - 2479 = 17 (rams)
Step 4: Determine the production requirements and the saturation date based on constraints
According to Step 4, several inputs are required, which are declared in Table 2.
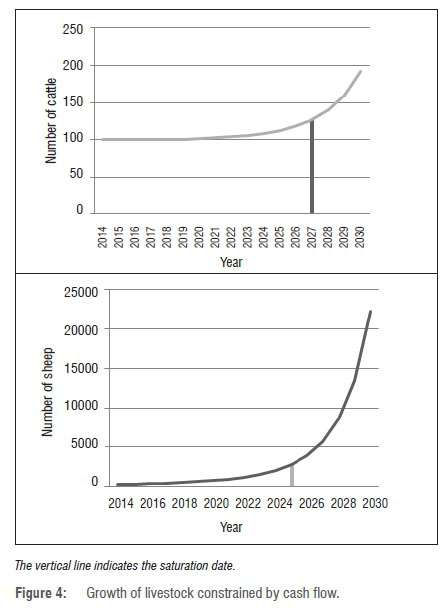
Method step application: There are two types of animals on the farm; both types will not necessarily reach their saturation dates at the same time. The growth of the number of animals on the farm will be constrained by the cash flow of the business and the percentage of profits that will be used to expand the farm. Furthermore, the annual increase in the number of cattle and sheep needs to be proportional to the shortfall when compared to the saturation-state numbers. The cattle and sheep need to reach their saturation date at the same time to optimise veld utilisation. Table 4 presents a partial cash flow budget, indicating the expenses, income, gross profit and annual increase of animal numbers when 40% of the gross profit is applied to growth of livestock numbers.
The saturation date is the date at which the saturation state is achieved, i.e. when 126 cattle and 2496 sheep are grazing at Bloemhoek Farm. As indicated in Figure 4, the saturation date is at the start of the year 2027. The saturation date is based on certain assumptions, such as normal growth and breeding. Under conditions which impede normal growth and breeding, such as drought, the saturation date will have to be re-calculated using different input values. Section 7 argues in favour of an iterative FSDMe to acknowledge dynamic changes within the enterprise context, such as climate conditions. For the purpose of this demonstration, we acknowledge different input parameters by including sensitivity analyses in Step 9. Because Bloemhoek Farm will be growing in livestock numbers, additional resources, utilities, services and structures will be required, and are calculated in the next step.
Step 5: Identify critical RUSS and design criteria
Additional capacity would be required for sheep sleeping camps, feed-processing equipment and livestock-handling facilities. The main concern or design criterion is the cost of expanding the facilities.
Hanekom17 indicated that existing sheep sleeping camps had a capacity of 3.2 ha. As calculated in Step 3, the flock of sheep will have increased to 2496 at saturation state. Because a sheep requires 0.004 ha sleeping space, the sheep sleeping camps need to increase to a total capacity of 9.98 ha (i.e. 2496*0.004).
At saturation state, the animals will rely less on natural grazing and more on additional feeding to provide adequate nutrition at different production stages. The different mixtures are also commonly referred to as 'lick', with the key ingredient being lucerne. Hanekom17 suggested mechanisation as a solution, with additional equipment to produce lucerne at Bloemhoek Farm.
Livestock-handling facilities are used for several activities, such as administering medicine, animal branding and selecting animals for auctions. Existing livestock-handling facilities accommodate 105 cattle and 640 sheep. The livestock-handling facilities require a stepwise increase in capacity.
Step 6: Identify and evaluate alternatives for RUSS replacement or extension
As indicated in the previous step, sheep sleeping camps, feed-processing equipment and livestock-handling facilities have to be extended.
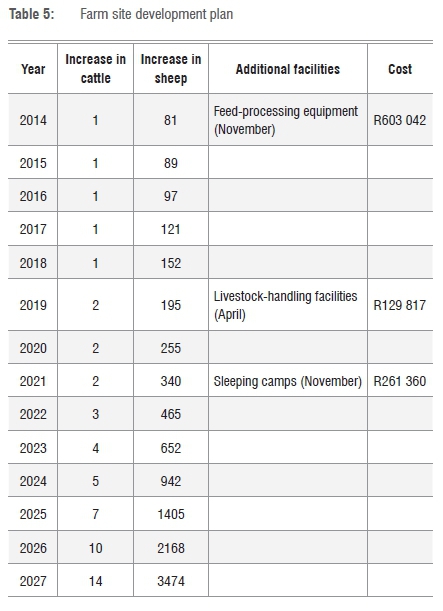
For sheep sleeping camps, the first saturation date will occur on November 2021, as the current sleeping camp has a capacity of 807 sheep (i.e. 3.23 ha/0.004 ha space required per sheep). As indicated in Step 5, a total capacity of 9.98 ha would be required at saturation state. We propose two alternatives: (1) constructing all of the camps before November 2021 and (2) constructing camps as sleeping capacity runs out. The economic analysis indicates preference for the first alternative, as the more economical option.
Regarding feed-processing equipment, Hanekom17 suggested that the high cost and 100% utilisation of current manual labour warrants partial mechanisation. The suggested lucerne production equipment, detailed in Hanekom17 (costing R603 042), should be purchased immediately.
As calculated in Step 5, the existing livestock-handling facilities accommodate 105 cattle and 640 sheep. Livestock-handling facilities will be depleted in July 2022 for cattle and April 2019 for sheep. Two alternatives are suggested: (1) constructing additional units before April 2019 and (2) constructing the facilities when capacity runs out. The economic analysis indicates preference for the first alternative, based on cost.
Step 7: Compile a series of phase plans: The FDP The suggested FDP is shown in Table 5.
Step 8: Represent phase plans graphically in support of the FDP
Hanekom17 provided a graphical saturation-state facility plan for the livestock-handling facilities, as well as the sheep sleeping camps.
Step 9: Validate the FDP
Hanekom17 automated the linear program and the resulting cash flow using MS Excel. We then used different input parameters to analyse the effect on the FDP Examples of different scenarios include a decline in the auction price of animals, above average increases in input cost (such as labour cost and feed cost), and a sudden decline in animal numbers as a result of a lethal disease. For demonstration purposes, we demonstrate two scenarios.
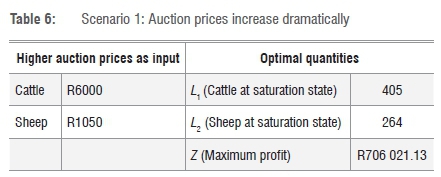
Scenario 1: The auction price dramatically increases as a result of El Ninõ, which causes a drought. Typical unit auction prices quoted in February 2016 for cattle were R6000 (instead of R4200) and for sheep R1050 (instead of R615). The result of this scenario is shown in Table 6. The optimal quantities for cattle (405) and sheep (264) at saturation state are very different to the optimal quantities calculated in Step 3. Thus the FSDMe should not be based on volatile prices, i.e. stable price trends should be used.
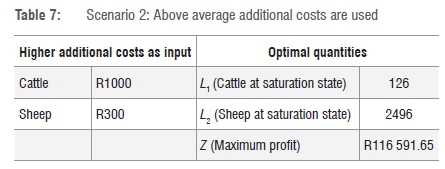
Scenario 2: Above average additional costs are used, e.g. additional costs for cattle are R1000 (instead of R515) and for sheep R300 (instead of R180). The result of this scenario is shown in Table 7. Higher additional costs do not have an impact on the optimal quantities for cattle (126) and sheep (2496), as the same optimal values were obtained in Step 3. Because of higher input costs, the maximum profits are lower than those obtained in Step 3, as expected. In addition, a qualitative validation was performed, using a questionnaire to validate the usefulness of the FSDMe to the farm owner.
Discussion
In this article, we have suggested the extension of an existing method -the FSDM - towards an FSDMe. We have presented the FSDMe, which was adapted and extended to address several utility deficiencies, which are now discussed. The validity/credibility was improved by extending the FSDMe for livestock farms and incorporating optimisation techniques, demand planning and financial planning. Even though we incorporated demand planning theoretically, our demonstration at Bloemhoek Farm assumed that demand exceeded supply. Additional demonstrations of the FSDMe, in which demand is constrained, would further increase the validity/credibility of the FSDMe. In addition, the purpose/utility statement and scope of the FSDM was clarified by defining the purpose, scope, prerequisites, input requirements and roles. The new FSDMe provides clarity on the structure of the method, separating the initial input variables from the method guidance. The generalisability of the method was improved through the distinction between the generic and extension components, as illustrated on crop and livestock farms. The objectivity/confirmability of the method was improved by involving two objective participants as practitioners, demonstrating the FSDMe for different types of farms.
The two demonstrations partially confirmed the utility of the FSDMe, as a component could not be demonstrated if its method condition did not occur. As an example, Step 4 requires a time series analysis to project future demand if market demand is a constraint; because market demand for produce was not a constraint for the two demonstration farms, the time series analysis component could not be validated.
The FSDMe demonstration on the livestock farm acknowledged the heterogeneous nature of the arable land, different feeding habits of animal types and grazing sequence to ensure optimal utilisation of plant material. The FSDMe demonstration on the crop-producing farm acknowledged intervention decisions of the farm owner (e.g. the decision to buy hail shields), which constrains the solution space for developing the FDP.
Conclusions
We have addressed several utility deficiencies of an existing method (the FSDM), extending its utility in terms of its validity, its purpose statement and scope, its generalisability and confirmability. In terms of its purpose, the extended FSDMe is a strategic planning tool that facilitates production growth on an existing farm of fixed size and incremental extension of its facilities towards the saturation state. The scope of the FSDMe includes crop-producing farms as well as livestock farms. For the crop-producing farm, the FSDMe requires choice of crop products as input, but does not aim to optimise the production mix proportions. For the livestock farm, the FSDMe similarly requires a choice of animal type as input, but also optimises the proportion of animal types. Furthermore, it is assumed that the livestock farm produces crops for the sole purpose of feeding livestock. As indicated by the FSDMe, the practitioner or farm owner needs to have some practical knowledge of the farming industry and the farm produce prior to using the FSDMe. Several input values regarding the particular farm, produce and budget are required prior to applying the FSDMe.
The two distinct demonstrations of the FSDMe for a crop-producing farm and a livestock farm validated the utility of the FSDMe. For demonstration purposes, only the livestock farm was included as an example. Feedback from the research participants indicated several extension opportunities for future work. Currently the FSDMe does not question decisions regarding farming produce (i.e. crop varieties, crop production mix and animal types). Because the initial business model may not be optimal, the FSDMe could be extended to re-visit and guide business model decisions regarding markets, produce, partners and resources. One of the assumptions of the FSDMe, when applied to a livestock farm, is that calves and lambs do not graze and are sold once they are weaned. Yet, if the price of crops (e.g. maize) is very low, some farmers rather use a percentage of their crops as rounding feed for calves and lambs. A possible extension of the FSDMe is to incorporate the rounding feed as an input, which will affect the saturation state. Other constraints that need to be considered include crop rotation, land rehabilitation practices and legislative constraints. The FSDMe could also be converted to an iterative method to acknowledge dynamic changes within the enterprise context, such as labour strikes and climate conditions, as well as disasters, such as veld fires and droughts.
Design science research acknowledges that additional research cycles will increase the rigour of the artefact, i.e. the FSDMe, as well as the utility of the accompanying software application that provides a user-friendly interface to the user of the FSDMe.
Acknowledgements
We are grateful that Bloemhoek Farm could be used to demonstrate the FSDMe, and we thank Franko Botes for his assistance.
Authors' contributions
E.H. was a co-designer of the FSDMe and applied the FSDMe to a livestock farm. A.L. was one of the initial designers of the FSDM, critically evaluated the extensions to the original method, and contributed towards the development of the FSDMe. M.d.V. coordinated the project and ensured that the participants adhered to Offerman et al.'s10 guidelines for good method design.
References
1. Bureau for Food and Agricultural Policy (BFAP). 10th BFAP baseline: Agricultural outlook 2013-2022 [document on the Internet]. c2013 [cited 2014 Apr 10]. Available from: http://www.bfap.co.za/documents/baselines/BFAP_Baseline_2013.pdf [ Links ]
2. Directorate: Statistics and Economic Analysis. Economic review of the South African Agriculture 2013. Pretoria: Department of Agriculture, Forestry and Fisheries; 2014. Available from: http://www.senwes.co.za/Files/main_productsservices/agriservices/2014/Economic_Review_2013.pdf [ Links ]
3. Van Rooyen L. Climate change putting farmers out of business. Farmer's Weekly. 2011 August 23. Available from: http://www.farmersweekly.co.za/article.aspx?id=10388&h=Climate-change-putting-farmers-out-of-business. [ Links ]
4. Seeds of change. The Economist. 2013 June 20. Available from: http://www.economist.com/blogs/baobab/2013/06/land-reform-south-africa [ Links ]
5. Du Plessis D. Reforming land reform. Farmer's Weekly. 2014 February 03. Available from: http://www.farmersweekly.co.za/article.aspx?id=53049&h=Reforming-land-reform. [ Links ]
6. Van der Merwe R, Liebenberg A, De Vries M. A farm site development method: Creating a roadmap towards site saturation. S Afr J of Ind Eng.2014;25(3):126-139. [ Links ]
7. Harmsen F, Saeki M. Comparison of four method engineering languages. In: Brinkkemper S, Lyytinen K, Welke RJ, editors. Proceedings of the IFIP TC8, WG8.1/8.2 Working Conference on Method Engineering: Principles of Method Construction and Tool Support. London: Chapman & Hall; 1996. p. 209-231. [ Links ]
8. Welke RJ, Kumar K. Method engineering: A proposal for situation-specific methodology construction. In: Cotterman S, editor. Systems analysis and design: A research agenda. Chichester: Wiley; 1992. p. 257-268. [ Links ]
9. Bucher T, Klesse M, Kurpjuweit S, Winter R. Situational method engineering. In: Ralyté J, Brinkkemper S, Henderson-Sellers B, editors. Situational method engineering: Fundamentals and experiences. Boston, MA: Springer; 2007. p. 33-48. http://dx.doi.org/10.1007/978-0-387-73947-2_5 [ Links ]
10. Offermann P, Blom S, Bub U. Proposal for components of method design theories: Increasing utility of method design artefacts. Bus Inf Syst Eng. 2010;2(5):295-304. http://dx.doi.org/10.1007/s12599-010-0120-x [ Links ]
11. Gregor S, Jones D. The anatomy of a design theory. J Assoc Inf Syst. 2007;8(5):312-335. [ Links ]
12. Hodson WK. Maynard's industrial engineering handbook. 4th ed. New York: McGraw-Hill; 1992. [ Links ]
13. Jacobs RF, Chase RB. Operations and supply chain management. 13th ed. New York: McGraw-Hill; 2011. [ Links ]
14. Seal W, Garrison RH, Noreen EW. Management accounting. 4th ed. London: McGraw-Hill; 2012. [ Links ]
15. Gregor S, Hevner A. Positioning and presenting design science research for maximum impact. MIS Quarterly. 2013;37(2):337-355. [ Links ]
16. Vaishnavi V Kuechler W. Design research in information systems [document on the Internet]. c2004 [cited 2009 Dec 11]. Available from: http://desrist.org/design-research-in-information-systems [ Links ]
17. Hanekom E. Farm site development method at a livestock farm [thesis]. Pretoria: University of Pretoria; 2014. [ Links ]
 Correspondence:
Marné de Vries
marne.devries@up.ac.za
Received: 12 Nov. 2015
Revised: 17 Apr. 2016
Accepted: 03 June 2016
FUNDING: University of Pretoria

