


Services on Demand
Article
 English (pdf)
 Article in xml format
 Article references
Indicators

Related links
-
 Cited by Google
 -
 Similars in Google
Share

 Permalink
South African Journal of Science
On-line version ISSN 1996-7489
Print version ISSN 0038-2353
S. Afr. j. sci. vol.112 n.9-10 Pretoria Sep./Oct. 2016
http://dx.doi.org/10.17159/sajs.2016/20150474
RESEARCH ARTICLES
http://dx.doi.org/10.17159/ sajs.2016/20150474
Do African microfinance institutions need efficiency for financial stability and social outreach?
Md A.K. AzadI; Susila MunisamyI; Abdul K.M. MasumII; Peter WankeIII
IDepartment of Applied Statistics, University of Malaya, Kuala Lumpur, Malaysia
IIDepartment of Administrative Studies and Politics, University of Malaya, Kuala Lumpur, Malaysia
IIICOPPEAD Graduate Business School, Federal University of Rio de Janeiro, Rua Paschoal Lemme, Rio de Janeiro, Brazil
ABSTRACT
Microfinance institutions (MFIs) have the dual objective of providing social welfare and financial stability. We evaluated the financial efficiency of MFIs in sub-Saharan African countries by comparing their regional performances during the period 2004-2013. We addressed prevailing MFI heterogeneity by using the concept of 'metafrontier'. The results showed that on an average, more than half the MFIs showed a drop in productivity. The measure of how much one country gets closer to or further away from world frontier technology is commonly known as the TGC score. In world frontier technology, East and South Asian countries have taken the lead (TGC score 1.0048) while sub-Saharan African countries lag behind (TGC score 1.0020). Most East and South Asian countries have a TGC score of 1, and most sub-Saharan African countries have a TGC score less than 1. This signifies that Asian countries lead world frontier technology and most African countries do not. The decomposition of efficiency scores showed that with regard to technical changes, African nations had progressed on average only 0.01%, and efficiency change scores had regressed by 0.59% annually.
Significance:
• First efficiency study on microfinance institutions and their heterogeneity in Africa.
• The results show robust discrimination among the efficiency scores.
Keywords: metafrontier; data envelopment analysis; productivity; world frontier technology
Introduction
Microfinance institutions (MFIs) are commonly known as 'banks for the poor'. Mainstream financial institutions, such as commercial banks, do not allow poor households access to their services because of those households' poor economic status or creditworthiness. Thus, MFIs are designed to serve these people with a range of banking services, typically borrowing and saving. Most MFIs are very small in terms of capital to offer collateral-free credits. To support such financially risky business operations, MFIs usually depend on funds from donor organisations or individuals.
The two contradictory characteristics1 of MFIs can be categorised as the 'institutional paradigm' (MFIs must meet their operational costs with financial sustainability) and the 'welfare paradigm' (social outreach).2-4 In recent decades, MFIs have proven to be a successful tool for poverty alleviation and social outreach.5,6 However, evidence of consistent poor loan quality among MFIs7-9 has highlighted the pressing need to examine the financial sustainability of MFIs.
A number of studies have examined MFIs and their social performance in African nations.10 To date, Van Rooyen and Stewart11 have presented the most rigorous and systematic review containing quality data to assess the evidence of effectiveness of MFIs in sub-Saharan Africa (SSA). Their study showed that MFIs have modest but not uniform positive effects on social welfare. Hulme and Mosley12 presented an extensive data comparison among the regions and showed that MFIs in Africa suffer from both micro and macro instability. Micro-level challenges include limited management ability and loan recovery rates, and macro-level challenges include inflation, interest rates and transparency. Hulme and Mosley12 therefore could not rate the performance of MFIs as satisfactory. A similar finding was presented by Buckley13, and contradictory findings were presented by Lafourcade and Isern14. All these studies attested to the performance of MFIs in poverty alleviation and social welfare. Our study examined MFI financial performance, especially in African countries, from 2004 to 2013.
In the literature, the topics of microfinance stability and institutional efficiency have come under the spotlight for two main reasons: (1) the conceptual difference between financial stability (i.e. end status) and efficiency (i.e. relative performance), and (2) increasing trends in operating expenses.8 A decision-making unit (DMU) is seen as being efficient if the output cannot be increased without intensifying the input. In MFI efficiency literature, both regional4,15,16 and country-wide17-19 efforts are common. However, to date, few studies have examined the efficiency of MFIs globally. Annim8 examined the efficiency of 164 MFIs worldwide. He employed parametric and non-parametric measures to evaluate MFI trade-offs between financial sustainability and social outreach. Hermes and Lensink1 studied 435 MFIs worldwide using a stochastic frontier approach to measure both financial and social efficiency. Among these studies, a major limitation is their methodology, in that they did not properly account for heterogeneity among MFIs20.
Worldwide, the heterogeneity of MFIs is evident for three reasons: geographical and socio-economic influence21, the regulatory framework, and the institutional framework. For example, Guntz21 reported that the average loan size of MFIs in East and South Asia (ESA) is USD149, whereas the average loan from MFIs in Eastern Europe and Central Asia is USD1579 - almost ten times as large. Based on legal and institutional frameworks, the sustainability scores of MFIs worldwide have been calculated by the Economist Intelligence Unit. Out of 55 selected countries, only 30 showed positive movement towards improvement in both regulatory and institutional frameworks for MFI operations. Nineteen countries were reported as having experienced negative change. Latin America and the Caribbean (LAC) had the highest overall regional score.
In a recent study, Louis et al.22 studied trade-offs of MFIs with special attention to MFI heterogeneity. The researchers used self-organising map methodology to study 650 MFIs, and the results showed a positive relationship between MFI heterogeneity and social efficiency. This suggests that studying the efficiency and heterogeneity of African MFIs would also be worthwhile.
The concept of 'metafrontier' originated with Hayami23 to deal with heterogeneity in efficiency calculations among DMUs. Hayami realised that studying efficiency on a comparative basis would be difficult because individual groups might not enjoy identical sets of production factors such as land, labour and capital. More information on meta-production functions is provided by Binswanger and Ruttan24. Their study showed that meta-production function enveloped all sub-functions, and was the most efficient function (assuming all groups had access to meta-production technology).25 By modifying a single data-generation process, Battese and Rao26 solved the drawback they had identified for using a stochastic frontier approach. In addition, the Malmquist Index (MI) was used to chart the yearly efficiency changes among selected MFIs.
Non-parametric data envelopment analysis (DEA) has been used as a tool to measure efficiency.4,15,27 The main benefit of using DEA rather than parametric tests (e.g. stochastic frontier approach) is that DEA does not require any assumptions about DMU business processes. Moreover, DEA can examine efficiency using multiple inputs and multiple outputs. To the best of our knowledge, our use of metafrontier Malmquist DEA analysis is a first in examining MFI efficiency worldwide.
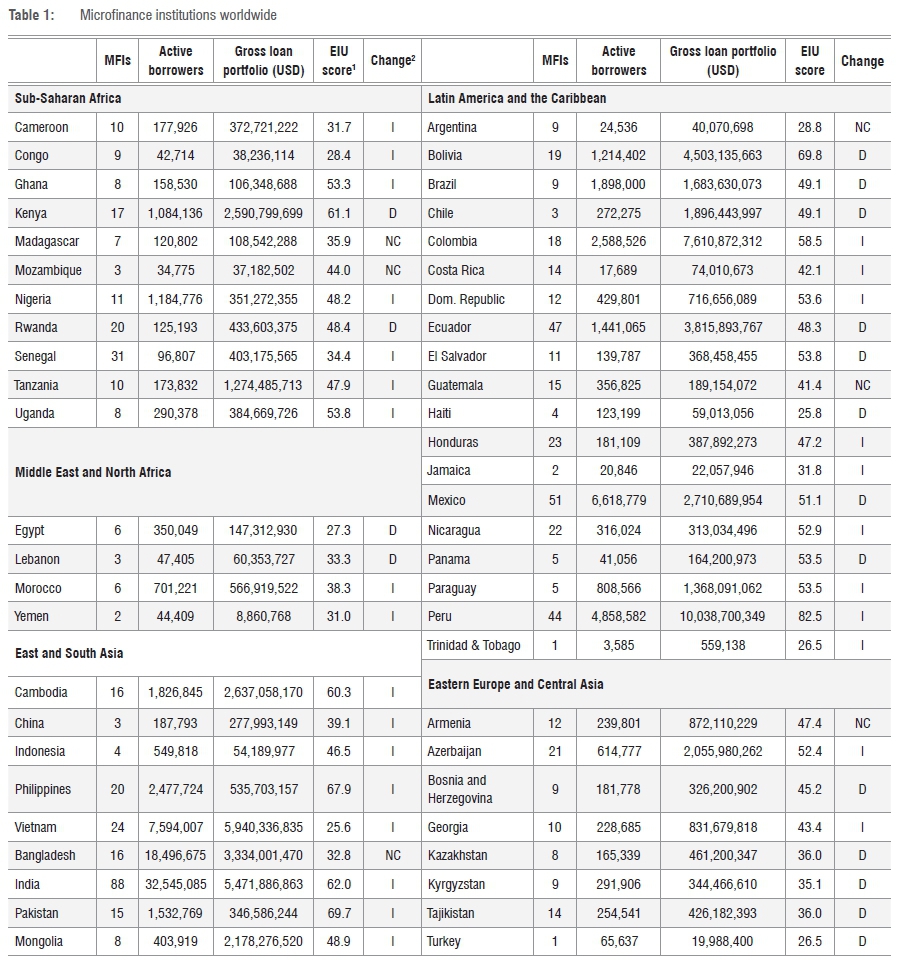
Our objective was to examine the efficiency of MFIs in Africa, with consideration given to heterogeneity in production technology. We classified all MFIs into five groups (Table 1) according to geographical and socioeconomic data, as proposed by earlier studies8,21. Metafrontier technology is used to handle such heterogeneity. We used the MI to capture efficiency changes over the study period. Then we decomposed MI values into three specific efficiency scores, namely technical efficiency, pure efficiency and scale efficiency, to examine the sources of efficiency results on the MI values. For the calculations, we used DEA considering the production approach of MFIs at variable returns to scale.
Microfinance worldwide
Poverty is a global issue. According to the World Bank28 around 2.2 billion people currently live on less than USD2 a day, compared with 2.59 billion people in 1981. The report showed that poverty has declined slightly over the years, but not evenly across all regions. With regard to reductions in extreme poverty from 1981 to 2011, East Asia performed best (dropping from 78% impoverishment to a mere 8%), followed by South Asia (61% to 25%). Sub-Saharan Africa showed a less dramatic improvement, dropping from 53% impoverishment to 47%. In 2011, the largest extremely poor population was located in SSA (415 million people), followed by South Asia (399 million), and then East Asia and the Pacific (161 million).
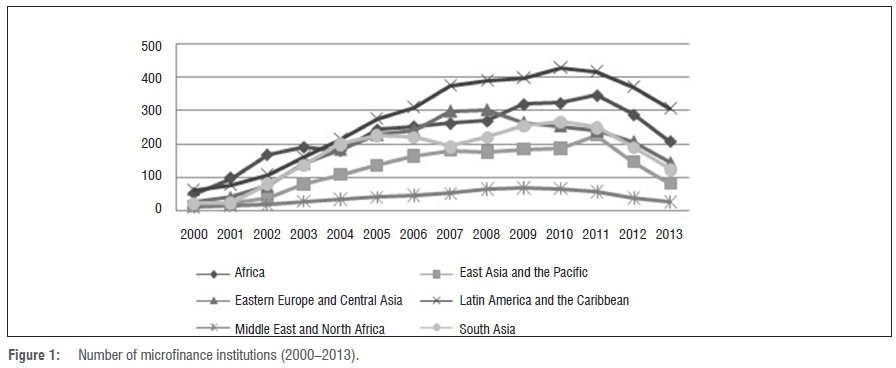
Detailed differences in MFI operations across the regions are shown in Figures 1 and 2. Figure 1 shows the change in total number of MFI operations across the five regions. After making steady progress between 2000 and 2010, all regions faced a significant drop in the number of MFIs between 2010 and 2013. The largest drop was recorded for LAC and the smallest drop for Middle East and North Africa (MENA). Interestingly, for MENA the number of MFIs did not grow significantly over the years.
Figure 2 presents a summary of financial stability among MFIs. The highest profit margin was recorded for Africa, whereas the lowest margin was in South Asia. After 2009, just after the global financial crisis, profit margin dropped in all regions but not substantially - except in Africa. Table 1 shows details about the heterogeneity among MFIs in five selected regions (country details, active borrowers, gross loan portfolio, Economist Intelligence Unit scores, and changes in scores from 2011 to 2013). From Table 1 it is evident that countries show unequal improvements in poverty alleviation. The greatest change was observed for LAC, and the smallest change was noted for ESA. Thus, MFI efficiency studies among these regions must consider their heterogeneity.
Previous studies on microfinance efficiency
Like other social organisations, MFIs operate under the 'double bottom line', that is, social outreach and financial stability.3,5,8 Over the past few decades, MFIs have proven their success in social outreach.1,6,28 However, until recently the financial sustainability of MFIs has not been thoroughly analysed.21,29 According to Yunus30, MFI financial sustainability can be seen as corresponding to social outreach, because establishing an institutional paradigm can ensure long-term operation and service to society. An efficient MFI can serve the welfare purpose better than a bankrupt MFI.
Among the recent studies, Im and Sun29 examined 1129 MFIs worldwide (in 98 countries) to test the institutional logic of MFIs. According to their study results, there is an inverted U-shaped relationship between financial stability and social outreach. Such a result signifies that MFIs must choose a point in profitability that maximises the MFI's potential for social outreach. After the threshold point, an increase in profitability will result in poor social welfare. Moreover, recent evidence of MFIs' declining financial performance9 highlights the need to examine the efficiency of MFIs.
Traditionally, MFI efficiency is calculated using various accounting ratios. For example, Farrington31 examined African MFI efficiency using cost-per-borrower and cost-per-sever ratios, and found that African MFIs are highly expensive. But these ratios explain only partial attributes of efficiency measurement, and as a result may misguide benchmarking and decision-making processes.32 Among frontier efficiency studies of MFIs, the two main measurement techniques are non-parametric tests and parametric tests.33,34 DEA is a non-parametric efficiency measurement technique developed by Charnes and Cooper35. DEA generalises the single input and single output measure of Farrell32 into multiple input-output measures, to measure relative efficiency among the DMUs.36 A DMU (in this context an MFI) is considered to be efficient if no DMU can produce equivalent outputs without needing increased inputs. One of the main benefits of using DEA rather than parametric efficiency techniques (the most popular one being stochastic frontier approach) is that DEA does not require detailed theoretical knowledge about processes.37 In addition, the metafrontier DEA allows separation of DMUs based on their specific characteristics and thus the heterogeneity issue of DEA is resolved.26
In MFI efficiency studies using DEA, country-specific research effort is common.17,38,39 Among many such studies, Tahir and Tahrim17 examined efficiency of Cambodian MFIs using DEA and Dynamic MI. Their study showed that Cambodian MFIs were 92% efficient. With the help of MI, the decomposition of this result showed that efficiency was not achieved because of pure efficiency but rather scale efficiency. Therefore, their study confirmed that Cambodian MFIs were efficient in scale of operation and relatively inefficient at managing assets and costs. In a study of 46 Vietnamese MFIs, Nghiem and Coelli39 deployed second-stage DEA to calculate technical efficiency and scale efficiency. Vietnamese MFIs were shown to be only 80% technically efficient. In the second stage of DEA, they used Tobit regression to examine sources of inefficiency. The findings showed that location of MFIs was the most significant variable in determining MFI efficiency. Wijesiri and Viganò40, in a similar study in Sri Lanka, showed that MFIs were not efficient in either financial or social aspects. Using second-stage DEA with double bootstrap regression, Wijesiri and Viganö40 showed that capital for assets, and age, were significant determinants of MFIs' financial efficiency.
To date, limited regional studies have also examined MFI efficiency. Bassem16 evaluated the efficiency of 33 MFIs in MENA countries using DEA and MI. His study showed that MFIs are less scale efficient and are instead high in pure efficiency in the MENA region. This finding signifies that MFIs in MENA seem to be expert in management practices rather than optimum scale. Similarly, Servin and Lensink41 examined 315 MFIs from 18 countries in LAC. Studies on cross-regional MFI efficiency are very few. For instance, Annim8 examined only 164 MFIs worldwide to evaluate trade-offs between MFIs' social and financial performance. The results showed that worldwide, on average, MFIs failed at outreach service in terms of financial stability. Studying the cost efficiency of 39 MFIs in Africa, Asia and Latin America, Haq and Skully4 showed that nongovernmental MFIs are cost-efficient compared with bank microfinance. These studies, however, did not recognise heterogeneity among MFIs worldwide; this detracts from the robustness of the results20. Therefore a study on MFI efficiency globally, with proper consideration being given to their heterogeneity, is a timely need.
Recent research findings have revealed a significant importance of social performance of MFIs, over and above their financial efficiency. However, for a number of reasons the financial performance of MFIs can lead them to bankruptcy. Sainz-Fernandez et al.7 examined crises among 832 MFIs in 74 countries from 2003 to 2011. The researchers analysed panel data and identified both internal and external reasons that were responsible for the MFI failures.
A proliferation of theories has created fuzziness in defining specifically what MFIs stand for.41 One study that examined major trends in theories about MFIs showed that sustainable development was the most important aspect.42 Another recent trend is 'green' MFIs. Allet43 examined 160 MFIs using qualitative semi-structured interviews with 23 top managers, to understand why MFIs are deciding to go green. The results showed that stakeholders are the key drivers for this trend among MFIs.
Metafrontier Malmquist Index with DEA
Oh and Lee44 introduced three technologies in metafrontier analysis: (1) contemporaneous distance function, (2) intertemporal distance function, and (3) global distance function. With the help of these benchmark technologies, we measured component distance function as required in metafrontier technology.
We assume that there are (J) different technologies within the selected DMUs. Contemporaneous benchmark technology produces a reference set (P) at an individual time period (t). For etach group of technology (Rj), the production set is designed as PR= (x,y) | xproduces y and λΡt= Pt , t=1,..., T, and λ >0.This technology is based on the valuable work by Pastor and Lovell45 and Tulkens and Vanden Eeckaut46.
Tulkens and Vanden Eeckaut46 also guided the second technology, namely intertemporal benchmarking. This is a simple combination of all PRjInterT = conv(PRj1 UPRj2U, ... , UPRj2) the proposed contemporaneous production sets and for all time periods for a defined technology group (Rj). So for all (J) different technologies within the selected DMUs, (J) different intertemporal benchmarks will be produced. Finally, global technology for all time periods is represented by PRjGlobal = conv(PR1InterT , ..., UPRJ InterneT).
Starting with the basic MI model of Caves and Christensen47, a contemporaneous MI index would be as follows:
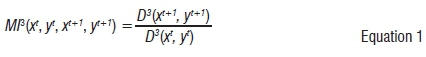
where the production set is  for Rj and the distance function is
  . Fare and Grosskopf48 proposed the MI index as the geometric mean of MI of two periods because MI(X, y, x+1, y+1) * MIt+1(xt, y, xt+1, /+1). With this connection, for an intertemporal benchmark technology the distance function is as follows:
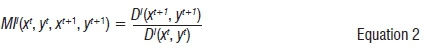
Here the production set is  for a group of
  and the distance function
  . Based on the valued work of Pastor and Lovell45, any intertemporal distance function can be decomposed as follows:
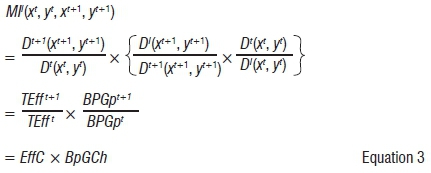
where TEffS and BPGps (s = t, t + 1) represent the technical efficiency level and gap in technology for best practice, respectively. The term EffC denotes measure in change of efficiency as proposed by Fare and Grosskopf48. The term BpGCh denotes the changes in best practice technology gap between the contemporaneous and intertemporal production possibility frontier. The term BpGCh>1 means that the contemporaneous frontier of t+1 period is closer than the intertemporal benchmark technology for the time t, and vice versa for BpGCh <1. Pastor and Lovell45 proposed this change in BpGCh is merely a change in the technology within the defined group. This is also the equivalent of technical progress or regress as presented by Caves and Christensen47.
The metafrontier approach used in our study is defined in the production set of PGlobalas follows:

Here the production set is PRjGlobal, I=t for all groups of  , and the distance function DGlobal(x,y) =
  is known as the global technology set. Using the same technology in Equation 1 for MI, the decomposition of a global set can be shown as follows:
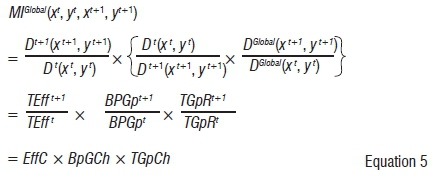
Here, TEffs, BPGps and TGpR (s = t, t + 1) represent the technical efficiency level, technology gap for best practice, and the level of technological gap ratio, respectively. The technological gap ratio was introduced and empirically used by Battese and Rao26. This ratio identifies the gap between different technology groups used in sampling with the global technology set.
The distance function for k'ЄRj for the period of s = t, t+1, is
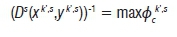
subject to:
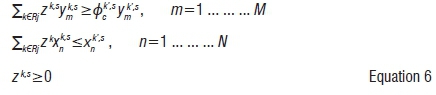
where zkis the intensity variable of a DMU (in our study, each bank is a unit). Using Equation 6, the intertemporal distance functions D/(xk',s,yk',s/Dk',s(xk',s,yk',s), s = t, t+1 are calculated using the following formula:
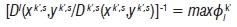
subject to:
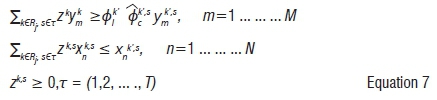
The above equation examines all units of all time periods for any specific group RjNow, the following objective function is responsible for calculating objective function for all units, all periods and all groups in any study. Denoting the solution of Equation 7, the global distance function DGlobal (xk',s, y k',s / Dk',s (x k',s,yk',s), s = t, t+1 can be calculated as follows:

Subject to:
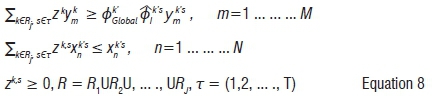
Using Equations 6, 7 and 8, the optimal solution for the Malmquist meta-frontier index can be calculated and decomposed.
Data and variables
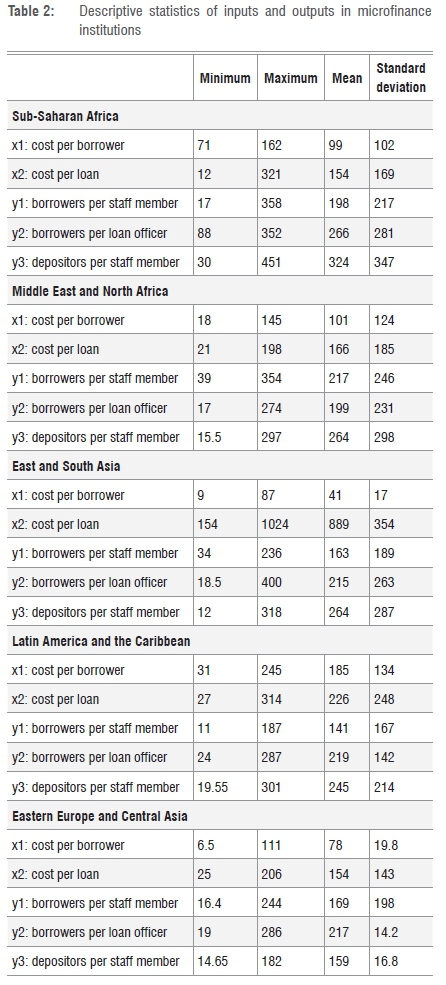
The input and output variables are listed in Table 2. Given the existing heterogeneity among MFIs, we considered the production approach (i.e. traditional factors of production, labour and capital) of MFIs rather than the intermediation approach (i.e. transformation of loans from savings) as proposed by Haq and Skully4 and Annim8. All values are expressed in USD in real rates. We use a balanced panel data of 473 MFIs from five regions over the period 2004-2013. Here, x1 refers to cost per borrower and x2 refers to cost per loan. On the output side, y1 refers to borrowers per staff members, y2 refers to borrowers per loan officer, and y3 refers to depositors per staff members used. Hence, all the input variables are connected to the production approach based on the earlier studies of MFI efficiency.
Empirical results and discussion
Before examining efficiency of MFIs in a metafrontier production function using the proposed model by Oh and Lee44, it is essential to determine the number of technological groups (here, five selected regions). This will define which MFI belongs to which group. Because the criteria for selecting an MFI for a group was based on our proposed merits (geographical closeness and socio-economic conditions for poverty alleviation) as discussed earlier, an alternative decision and selection choice could lead to different results. Our main objective was to find a group as a leader among the frontiers, that is, technical leadership across the groups.
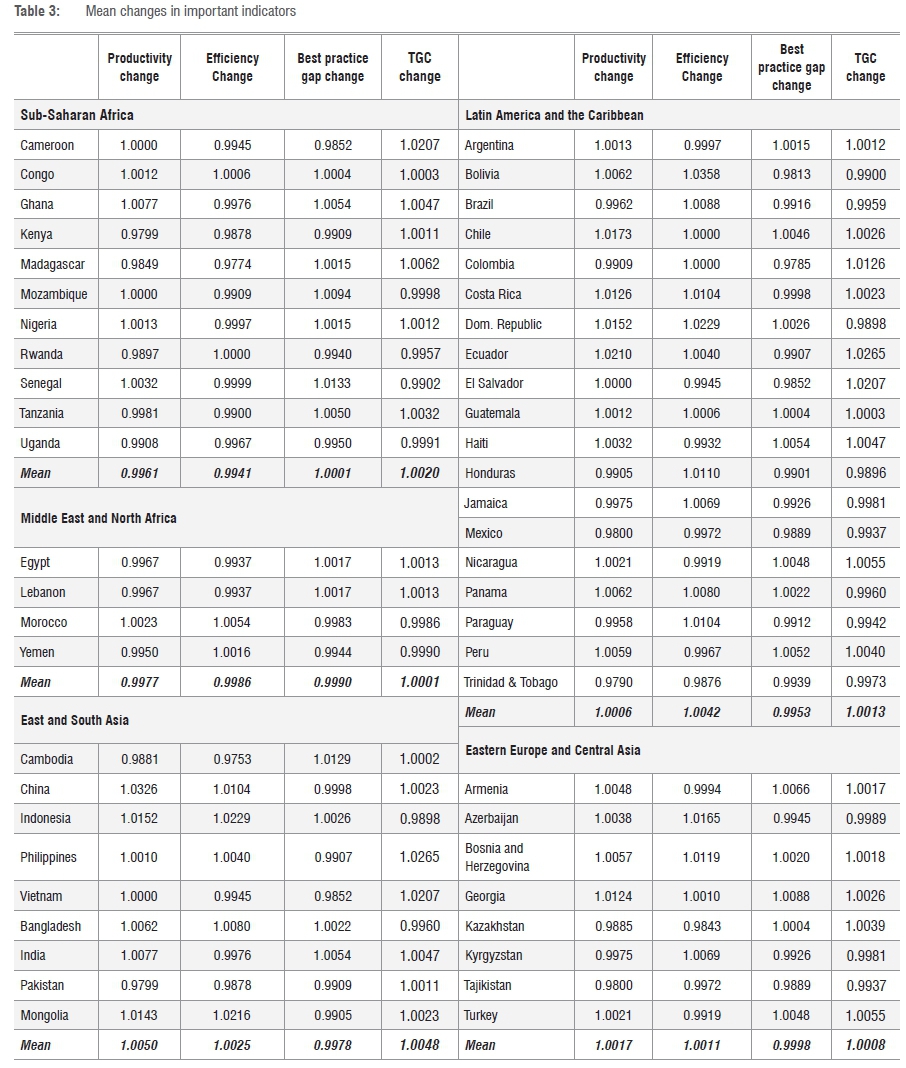
Table 3 presents productivity changes and their decompositions obtained from Equations 6, 7 and 8. From the results of MI, it is seen that the productivity change among the SSA and MENA countries, on average, declined slightly (less than 1%) over the study period. For the remaining regions, the productivity change scored positive over the study period. The highest productivity progress was observed for ESA, followed by Eastern Europe and Central Asia and then LAC. Among ESA countries, only Pakistan and Cambodia showed mildly negative progress. For Pakistan, our result was in line with the findings of Rauf and Mahmood49, who showed that cost-per-borrower had increased unreasonably and caused a decrease in efficiency. However, our result for Cambodia contradicted the earlier result of Tahir and Tahrim17.
According to their findings, Cambodian MFI productivity was increasing because of consistent success of scale efficiency, which implies that MFIs were operating at maximum scales. The highest productivity change in the ESA region was noted for China (3.2% annually). This finding confirms earlier studies.50 According to those earlier studies, strong macroeconomic support helped China to achieve good progress in productivity changes over the years.
In terms of efficiency changes, again SSA and MENA countries were on average shown to have dropped by less than 1% over the years. The greatest progress among these countries was observed for Morocco. Efficiency change reportedly progressed annually for the remaining three regions, with the greatest progress being observed for LAC. The latter finding again contradicted the results of an earlier study by Servin and Lensink41, who reported that in general MFIs in LAC showed a drop in efficiency scores. Among all the countries, the highest annual efficiency decrease was no more than 1.5%. This signifies that MFIs, worldwide, have been operating at almost close to unit efficiency on average. This particular result highlights that most MFIs across these countries are not lagging far behind the group frontier.
The measure of technical change or business process change indicates whether countries have technically progressed or not. It is evident from Table 3 that on average, all regions except SSA showed a drop in efficiency in technical change. This means that African countries, on average, are technically progressing over time although the progress is relatively very small. This result is in line with an earlier study by Lafourcade and Isern14. A further interesting finding with regard to business process change is that the remaining four regions are lagging behind in unit efficiency by less than 1%. Thus, technical efficiencies among the selected countries do not deviate significantly from each other.
The measure of how much a country gets closer to or further away from world frontier technology is known as the TGC score. The average TGC score is increasing yearly at 0.48% for ESA countries, which shows that they are approaching the frontier. An interesting result is that every ESA country has TGC score of 1 and most SSA countries have TGC scores less than 1. This signifies that ESA countries are leading the world frontier technology and most African countries are not.
Conclusion
Our study examined the issue of heterogeneity among MFIs worldwide.20 We examined production efficiency of MFIs in Africa and their capacity for poverty alleviation. Out of 929 MFIs listed by the Economist Intelligence Unit, our study included 743 (79.98%) MFIs in 51 countries. Based on regional closeness and socio-economic similarities, we classified these countries into five regional groups. Because our study examined production efficiency, only MFIs that offered both saving and lending facilities were included in the final selection. More than 90% of the MFIs that existed in ESA and LAC at the time of the study were included in our sample. The sample proportions for the regions of SSA, MENA, and Eastern Europe and Central Asia were 60%, 57% and 58% respectively. The total data set included 7430 observations from the 743 MFIs worldwide, covering the years 2004 to 2013.
To examine efficiency, we used two input variables and three output variables. Methodologically, we used metafrontier technology to examine the heterogeneity of MFIs. Initially, the metafrontier MI was used to calculate the technical efficiency, technology gap for the best practice and technological gap ratio among the studied banks. For the efficiency calculation, we ran non-parametric DEA.
The empirical results from our study show that regionally there is a link between group performance and individual performance, which reflects the findings of earlier studies of heterogeneity.10,20 For instance, when identifying technological growth change among the regions, we noted that the highest TGC score occurred in ESA countries. The analysis also showed that all ESA countries had a TGC score of more than 1. A comparison of EC, SSA and MENA countries showed that on average their TGC scores had dropped by less than 1% over the years. The greatest progress among these countries was observed for Morocco. By region, the greatest progress was observed for LAC countries.
The main contribution of this paper is it successfully blends two streams of academic theory, namely the MFI institutional paradigm and theories of efficiency. The results reveal that social outreach is a sequential event that arises from efficient performance of MFIs in a society. Financially sound MFIs can contribute to society by taking higher risks and being flexible about the terms of repayment.
We also introduced MFI heterogeneity as the key measure to compare MFIs' performances worldwide. Thus, benchmarking becomes robust and policy-making for future planning becomes more resourceful. Despite MFIs in some regions having greater financial efficiency through the scale of economy (scale efficiency), they might suffer from deficits in management skills. However, such a result contradicts the earlier studies29. Thus, we identified a gap in examining how MFI efficiency based on managerial skill may further improve MFIs' performance worldwide.
The findings from this study have important implications for managers and policymakers. From the regulatory perspective, MFIs can now be grouped, which means that benchmarking can be based on the group that an MFI belongs to. Internationally, managers can explain other MFIs' performance for benchmarking and decision-making. Heterogeneity is a major concern for benchmarking efficiency. The diverse nature of business and the complexity in defining variables make the efficiency calculation even more difficult. Unidentified or unobserved variables might have a significant influence on banks' efficiency. Nonetheless, our empirical results show that geographical location, strategic and socio-economic conditions, and macroeconomic heterogeneity can significantly influence MFI efficiency.
Authors' contributions
S.M. was the project leader; M.A.K.A. and A.K.M.M. were responsible for data analysis and project design; M.A.K.A., A.K.M.M. and PW. performed the data analysis; M.A.K.A., A.K.M.M., S.M. and PW. made conceptual contributions; and S.M. and PW. performed the analyses. M.A.K.A. and A.K.M.M. wrote the manuscript and S.M. edited and approved it.
References
1. Hermes N, Lensink R, Meesters A. Outreach and efficiency of microfinance institutions. World Dev. 2011;39(6):938-948. http://dx.doi.org/10.1016/j.worlddev.2009.10.018 [ Links ]
2. Woller GM, Dunford C, Woodworth W. Where to microfinance. Int J Econ Dev. 1999;1(29):29-64. [ Links ]
3. Morduch J. The microfinance schism. World Dev. 2000;28(4):617-629. http://dx.doi.org/10.1016/S0305-750X(99)00151-5 [ Links ]
4. Haq M, Skully M, Pathan S. Efficiency of microfinance institutions: A data envelopment analysis. Asia-Pac Finance Markets. 2010;17(1):63-97. http://dx.doi.org/10.1007/s10690-009-9103-7 [ Links ]
5. Sengupta R, Aubuchon CP. The microfinance revolution: An overview. St Louis Rev: Fed Reserve Bank; 2008. pages 9-30. [ Links ]
6. Gutierrez-Nieto B, Serrano-Cinca C, Molinero CM. Social efficiency in microfinance institutions. J Oper Res Soc. 2009;60(1):104-119. http://dx.doi.org/10.1057/palgrave.jors.2602527 [ Links ]
7. Sainz-Fernandez I, Torre-Olmo B, López-Gutiérrez C, Sanfilippo-Azofra S. Crisis in microfinance institutions: Identifying problems. J Int Dev. 2015;27(7):1058-1073. http://dx.doi.org/10.1002/jid.3129 [ Links ]
8. Annim SK. Microfinance efficiency: Trade-offs and complementarities between the objectives of microfinance institutions and their performance perspectives. Europ J Devel Res. 2012;24(5):788-807. http://dx.doi.org/10.1057/Ejdr.2011.60 [ Links ]
9. Wagner C, Winkler A. The vulnerability of microfinance to financial turmoil: Evidence from the global financial crisis. World Dev. 2013;51:71-90. http://dx.doi.org/10.1016/j.worlddev.2013.05.008 [ Links ]
10. Kareithi RN, Lund C. Review of NGO performance research published in academic journals between 1996 and 2008. S Afr J Sci. 2012;108(11-12):36-44. http://dx.doi.org/10.4102/sajs.v108i11/12.755 [ Links ]
11. Van Rooyen C, Stewart R, De Wet T. The impact of microfinance in sub-Saharan Africa: A systematic review of the evidence. World Dev. 2012;40(11):2249-2262. http://dx.doi.org/10.1016/j.worlddev.2012.03.012 [ Links ]
12. Hulme D, Mosley P Finance against poverty. New York, USA: Psychology Press; 1996. [ Links ]
13. Buckley G. Microfinance in Africa: Is it either the problem or the solution? World Dev. 1997;25(7):1081-1093. http://dx.doi.org/10.1016/S0305-750X(97)00022-3 [ Links ]
14. Lafourcade A-L, Isern J, Mwangi P, Brown M. Overview of the outreach and financial performance of microfinance institutions in Africa. Washington, DC: Microfinance Information Exchange; 2005. [ Links ]
15. Bassem BS. Efficiency of microfinance institutions in the Mediterranean: An application of DEA. Transit Stud Rev. 2008;15(2):343-354. http://dx.doi.org/10.1007/s11300-008-0012-7 [ Links ]
16. Bassem BS. Total factor productivity change of MENA microfinance institutions: A Malmquist productivity index approach. Econ Model. 2014;39:182-189. http://dx.doi.org/10.1016/j.econmod.2014.02.035 [ Links ]
17. Tahir IM, Tahrim SNC. Efficiency and productivity analysis of microfinance institutions in Cambodia: A DEA approach. Int Rev Bus Res Pap. 2015;11(1):25-42. [ Links ]
18. Habib M, Jubb C. Poverty alleviation with microfinance: Bangladesh evidence. In Heshmati A, Maasoumi E, Wan G, editors. Poverty reduction policies and practices in developing Asia. Economic studies in inequality, social exclusion and well-being. Singapore: Springer; 2015. p. 11-30. http://dx.doi.org/10.1007/978-981-287-420-7_2 [ Links ]
19. Azad MAK, Masum A, Munisamy S, Sharmin D. Efficiency analysis of major microfinance institutions in Bangladesh: A Malmquist index approach. Qual Quant. 2016;50(4):1525-1537. http://dx.doi.org/10.1007/s11135-015-0219-8 [ Links ]
20. Bolli T, Vo Thi A. Regional differences in the production processes of financial and social outputs of microfinance institutions. Econ Transition. 2014;22(3):461-495. http://dx.doi.org/10.1111/ecot.12045 [ Links ]
21. Guntz S. Sustainability and profitability of microfinance institutions. App Int Fin Dev. 2011;4:1-53. [ Links ]
22. 22. Louis P, Seret A, Baesens B. Financial efficiency and social impact of microfinance institutions using self-organizing maps. World Dev. 2013;46:197-210. http://dx.doi.org/10.1016/j.worlddev.2013.02.006 [ Links ]
23. Hayami Y Sources of agricultural productivity gap among selected countries. Amer J Agr Econ. 1969;51(3):564-575. http://dx.doi.org/10.2307/1237909 [ Links ]
24. Binswanger HP, Ruttan VW. Induced innovation: Technology, institutions, and development. Baltimore: Johns Hopkins University Press; 1978. [ Links ]
25. Battese GE, Rao DP. Technology gap, efficiency, and a stochastic metafrontier function. Int J Bus Econ. 2002;1(2):87-93 [ Links ]
26. Battese GE, Rao DP O'Donnell CJ. A metafrontier production function for estimation of technical efficiencies and technology gaps for firms operating under different technologies. J Productiv Anal. 2004;21(1):91-103. http://dx.doi.org/10.1023/B:PROD.0000012454.06094.29 [ Links ]
27. Liu JS, Lu LYY, Lu W-M, Lin BJY A survey of DEA applications. Omega Int J Manage S. 2013;41(5):893-902. http://dx.doi.org/10.1016/j.omega.2012.11.004 [ Links ]
28. World Bank. Poverty Overview 2015 [document on the Internet]. 2015 [cited 2015 May 5]. Available from: http://www.worldbank.org/en/topic/poverty/overview. [ Links ]
29. Im J, Sun S. Profits and outreach to the poor: The institutional logics of microfinance institutions. Asia Pac J Manag. 2015;32(1):95-117. http://dx.doi.org/10.1007/s10490-014-9398-4 [ Links ]
30. Yunus M. Creating a world without poverty: Social business and the future of capitalism. New York: Public Affairs; 2007. [ Links ]
31. Farrington T. Efficiency in microfinance institutions. Microbanking Bulletin. 2000;4:18-23. [ Links ]
32. Farrell MJ. The measurement of productive efficiency. J Roy Stat Soc A Sta. 1957;120(30):253-290. http://dx.doi.org/10.2307/2343100 [ Links ]
33. Berger AN, Humphrey DB. Efficiency of financial institutions: International survey and directions for future research. Eur J Oper Res. 1997;98(2):175-212. http://dx.doi.org/10.1016/S0377-2217(96)00342-6 [ Links ]
34. Lampe HW, Hilgers D. Trajectories of efficiency measurement: A bibliometric analysis of DEA and SFA. Eur J Oper Res. 2015;240(1):1-21. http://dx.doi.org/10.1016/j.ejor.2014.04.041 [ Links ]
35. Charnes A, Cooper W, Rhodes E. Measuring the efficiency of decision making units. Eur J Oper Res. 1978;2(6):429-l44. http://dx.doi.org/10.1016/0377-2217(78)90138-8 [ Links ]
36. Charnes A, Cooper W, Lewin AY, Seiford LM. Data envelopment analysis theory, methodology and applications. J Oper Res Soc. 1997;48(3):332-333. http://dx.doi.org/10.1057/palgrave.jors.2600342 [ Links ]
37. Cooper W, Seiford L, Tone K. Introduction to data envelopment analysis and its uses: With DEA-solver software and references. US: Springer Science & Business Media; 2006. [ Links ]
38. Agarwal PK, Sinha SK. Financial performance of microfinance institutions of India. Delhi Bus Rev. 2010;11(2):37-46. [ Links ]
39. Nghiem H, Coelli T, Rao P. The efficiency of microfinance in Vietnam: Evidence from NGO schemes in the north and the central regions. Int J Environ Cul Econ Soc Sus. 2006;2(5):71-78. [ Links ]
40. Wijesiri M, Viganò L, Meoli M. Efficiency of microfinance institutions in Sri Lanka: A two-stage double bootstrap DEA approach. Econ Model. 2015;47:74-83. http://dx.doi.org/10.1016/j.econmod.2015.02.016 [ Links ]
41. Servin R, Lensink R, van den Berg M. Ownership and technical efficiency of microfinance institutions: Empirical evidence from Latin America. J Bank Financ. 2012;36(7):2136-2144. http://dx.doi.org/10.1016/j.jbankfin.2012.03.018 [ Links ]
42. Marconatto D, Barin Cruz L, Avila Pedrozo E. Going beyond microfinance fuzziness. J Clean Prod. 2016;115:5-22. http://dx.doi.org/10.1016/j.jclepro.2015.12.070 [ Links ]
43. Allet M. Why do microfinance institutions go green? An exploratory study. J Bus Ethics. 2014;122(3):405-424. http://dx.doi.org/10.1007/s10551-013-1767-2 [ Links ]
44. Oh D-h, Lee J-d. A metafrontier approach for measuring Malmquist productivity index. Empir Econ. 2010;38(1):47-64. http://dx.doi.org/10.1007/s00181-009-0255-0 [ Links ]
45. Pastor JT, Lovell CAK. A global Malmquist productivity index. Econ Lett. 2005;88(2):266-271. http://dx.doi.org/10.1016/j.econlet.2005.02.013 [ Links ]
46. Tulkens H, Vanden Eeckaut P Non-frontier measures of efficiency, progress and regress for time series data. Int J Product Econ. 1995;39(1-2):83-97. http://dx.doi.org/10.1016/0925-5273(95)00002-6 [ Links ]
47. Caves D, Christensen L, Diewert W. The economic theory of index numbers and the measurement of input, output, and productivity. Econometrica. 1982;6:1393-1414. http://dx.doi.org/10.2307/1913388 [ Links ]
48. Fare R, Grosskopf S, Norris M, Zhang Z. Productivity growth, technical progress and efficiency changes in industrial countries. Amer Econ Rev. 1994;84:66-83. [ Links ]
49. Rauf SA, Mahmood T. Growth and performance of microfinance in Pakistan. Pakistan Econ Soc Rev. 2009;74(1):99-122. [ Links ]
50. Cheng E, Ahmed AD. The demand for credit, credit rationing and the role of microfinance. China Agr Econ Rev. 2014;6(2):295-315. http://dx.doi.org/10.1108/CAER-07-2012-0076 [ Links ]
 Correspondence:
Susila Munisamy
susila@um.edu.my
Received: 21 Dec. 2015
Revised: 10 Mar. 2016
Accepted: 28 Apr. 2016
FUNDING: None

