


Services on Demand
Article
 English (pdf)
 Article in xml format
 Article references
Indicators

Related links
-
 Cited by Google
 -
 Similars in Google
Share

 Permalink
South African Journal of Science
On-line version ISSN 1996-7489
Print version ISSN 0038-2353
S. Afr. j. sci. vol.112 n.9-10 Pretoria Sep./Oct. 2016
http://dx.doi.org/10.17159/sajs.2016/20150412
RESEARCH ARTICLES
http://dx.doi.org/10.17159/sajs.2016/20150412
Assessment of visualisation skills in biochemistry students
Lindelani MnguniI; Konrad SchönbornII; Trevor AndersonIII
IDepartment of Science and Technology Education, University of Johannesburg, Johannesburg, South Africa
IIVisual Information Technology and Applications (VITA), Department of Science and Technology, Linköping University, Linköping, Sweden
IIIVisualization in Biochemistry Education (VIBE) Research Group, Department of Chemistry, University of Purdue, West Lafayette, Indiana, United States
ABSTRACT
In the field of biochemistry, the use of external representations such as static diagrams and animations has increased rapidly in recent years. However, their effectiveness as instructional tools can be hindered if students lack the visual literacy and cognitive skills necessary for processing and interpreting such representations. We aimed to identify and assess visualisation skills necessary for effective processing of external representations in biochemistry. We used a modified Bloom's taxonomy to identify the cognitive skills essential for optimal visual literacy, and designed probes based on those skills to develop a test instrument. Student responses to the probes were scored and processed with the Rasch model. This approach enabled us to rate the degree of difficulty of each visualisation skill on a linear logit scale, and to generate a person-item map to measure biochemistry students' level of visual literacy. The results showed that the identified visualisation skills could be measured reliably, and the Rasch model was effective both for ranking the skills according to level of difficulty and for estimating a student's relative level of visual literacy.
SIGNIFICANCE:
• Addresses a recurring problem in biochemistry and similar fields.
• Identifies relevant skills to inform teaching and learning in biochemistry.
Keywords: external representations; Rasch model; visual literacy
Introduction
Bloom's taxonomy is widely accepted as the golden standard for determining learning objectives. In its purest form, Bloom's taxonomy addresses cognitive, affective and psychomotor domains, and can be applied to various competencies. Competencies include mathematics literacy, science literacy and visual literacy (VL), with VL being a key competency in learning biochemistry. According to Mnguni1, the visualisation process has three main stages: internalisation, conceptualisation and externalisation. In this model, internalisation refers to the process in which sense organs (such as the eyes) work with the brain to absorb information from the world (i.e. external to the body). Conceptualisation is the process by which meaning is made and cognitive visual models are constructed.2 During conceptualisation, prior knowledge that has been stored as cognitive visual models may be retrieved from long-term memory and reconstructed or revised in working memory, based on new knowledge. Externalisation is the production of external visual models by way of expressing cognitive mental schema.
Learning in biochemistry is complicated by a number of factors. For example, many biomolecular phenomena cannot be visualised with the naked eye because of their submicroscopic size and levels of complexity. Furthermore, these often abstract phenomena occur across various levels of organisation, usually at molecular level.3 Students therefore have to learn these concepts through individualised cognitive negotiation of 'imagined' concepts. Teaching, in such a field, requires perfecting the art of imagination amongst students and promoting uniformity in the cognitive images formed through the use of formalised external representations (ERs). To this end, a variety of ERs - such as static diagrams and animations - are used to express phenomena graphically and to assist students in visualising phenomena and constructing knowledge of how those phenomena occur in reality.4 However, students often fail to correctly visualise and interpret ERs in a manner that provides them with sound conceptual understanding.5,6 It is therefore not surprising that a lack of VL is one of the major problems faced by students studying biochemistry in modern educational settings.7
Schonbörn and Anderson3 argue that students find it challenging to master the abstract and diverse symbolic language used to represent and externalise biomolecular phenomena. This problem is compounded by the fact that some teaching and learning tools which experts consider to be good are not always effective at promoting learning in novices.8 In addition, students lack the cognitive skills required for optimal (expert level) VL skills which are needed to process and construct meaning from ERs.9,10 In line with this argument, some educators feel that students do not need to be explicitly 'taught' the visualisation skills necessary for interpreting ERs, and instead assume that such skills are automatically acquired during the imparting of prescribed content knowledge.11 However, several studies have suggested this is certainly not always true.12,13 We therefore sought to investigate and assess the VL of students studying biochemistry, so that meaningful action can be taken to help students process ERs effectively3.
Purpose of the study
Our research question was 'What visualisation skills are required for students to effectively process ERs related to biochemistry content?' We hypothesised that a typical class of biochemistry students would show a range of VL levels, which would depend on various factors and could improve with gains in conceptual knowledge and competence in visualisation skills. Given this hypothesis, the specific aims of the study were: (1) to establish which cognitive skills are important for VL in biochemists; (2) to develop a test instrument to assess each relevant visualisation skill; (3) to process student responses with the Rasch model and rank visualisation skills in order of difficulty; and (4) to use the Rasch model to construct a person-item map to determine students' relative levels of VL. To address these aims, we employed a primarily quantitative design. Elements of a mixed-methods approach were also adopted, in which both qualitative and quantitative data were collected and analysed.
Our main objective was to develop an instrument to test students' VL in biochemistry, based on item-response theory using the Rasch model. We used item-response theory because it allows for a number of features that are not provided by other forms, such as classical test theory. One such feature is that item-response theory converts non-linear raw scores to linear logit values that can be used to control for the difficulty level of scale items and the non-additive feature of ordinal data.14,15 In this way, 'responses based on the ordinal items are transformed into an interval scale based on logits to which proper parametric statistics can be applied'.14 Logits are interpreted directly; for instance, an item with 20 logits is twice as difficult as an item with 10 logits. A person with 10 logits has double the ability of a person with 5 logits. This comparison is impossible with normal classical test theory, in which a person who scores 50% does not necessarily have twice the ability as a person who scores 25%.
The Rasch model
To generate logit scores, a number of item-response theory models can be used. One common model is the single parameter Rasch model, which uses mathematical formulae to calculate probabilities based on the actual scores obtained.15 These probability-based scores are then converted to logit scores. Using fit statistics, the model is able to detect logit scores that differ too widely from actual scores before conversion. In the Rasch model, fit statistics indicate how accurately data fit the model. In this instance, 'infit' means inlier-sensitive and 'outfit' means outlier-sensitive fit, whereas mean-square fit statistics show the degree of randomness. Most scholars16 suggest that ideal fit statistics should be around 1.5. Extreme differences from this value indicate a less reliable instrument.
Another feature of the Rasch model is that it can determine dimensionality of the test. In this regard, tests measuring psychological variables (such as ability) on an interval scale should measure exactly the same variable with equal intervals in the level of difficulty. In other words, other factors that may tamper with that variable should be eliminated. The test should be unidimensional - that is, it should measure one variable only. The Rasch model determines dimensionality by calculating the Rasch unidimensionality coefficient. Smith et al.17 argue that absolute unidimensionality is observed if the mean-square fit statistic equals 1. They state that if the fit statistic of an item is 1.25, this indicates 25% variation; if the fit statistic is 0.7 then there is 30% less variation. However, other scholars16,18 suggest that fit statistics ranging from 0.5 to 1.7 are acceptable indicators of unidimensionality in clinical observations.
Cognitive skills that contribute to visual literacy
We consulted the literature to identify cognitive skills that are intrinsic to VL. According to Mnguni1, the main stages of the visualisation process are internalisation, conceptualisation and externalisation. Based on this model, we used the revised Bloom's taxonomy19 to identify cognitive skills that would most likely be engaged during each stage. We chose the revised Bloom's taxonomy because of its wide application as a mechanism of classification and categorisation of levels of learning.19
We studied each cognitive skill from Bloom's taxonomy with respect to examples of activities carried out and the definition of each cognitive skill. Thereafter we placed each cognitive skill in a visualisation stage that is most relevant. As shown in Table 1, this procedure yielded 24 cognitive skills, which we called visualisation skills because of their association with the visualisation process. As shown in Table 1, each skill has its own code number. Importantly, we realised that not all skills are utilised exclusively during a single stage of the visualisation process. For instance, 'mental rotation' (code T16) requires first perceiving the orientation of an object, followed by cognitive processes to mentally rotate the object in different dimensions.
Development of instrument to assess visualisation skills
We used the visualisation skills identified (Table 1) to develop an instrument to assess students' visualisation skills. We noted that students' interpretation of ERs in the test instrument would depend on at least three interdependent factors. These are students' reasoning ability (including visualisation skills) to make sense of an ER, prior conceptual knowledge that students apply in interpreting the ER, and the mode in which the knowledge is represented externally (e.g. graphic features, markings, diagrams and animations).20 The interdependent nature of these factors during the visualisation process suggests that it is not possible to design an assessment task that would assess students' visualisation skills exclusively, without also considering students' conceptual knowledge of relevance to a particular ER.
We therefore developed ER-based probes that require respondents to utilise their reasoning skills and prior knowledge in their search for answers. For each visualisation skill we first identified a basic biochemistry concept that in our judgement requires the use of a particular visualisation skill. Thereafter we identified an ER that is associated with each biochemistry concept. We then developed a probe that requires utilisation of the visualisation skill, by testing students' understanding of the biochemistry concept as represented by an ER. Each probe focused on at least one aspect of basic biochemistry, which included the topics of amino acid and protein structure, nucleic acid and protein synthesis, cellular structures and protein binding.
To minimise the influence of conceptual knowledge on assessing students' visualisation skill competence and therefore any VL measurements, we kept the biochemistry content required to answer the probes as basic as possible. This ensured that participating students would have few problems understanding the content. We also obtained expert validation of the test instrument, as discussed later in this paper. In addition, we examined students' performance on other course tests in which similar propositional knowledge was assessed. This analysis revealed that our student sample had adequate knowledge of the basic biochemistry concepts tested by the probes.
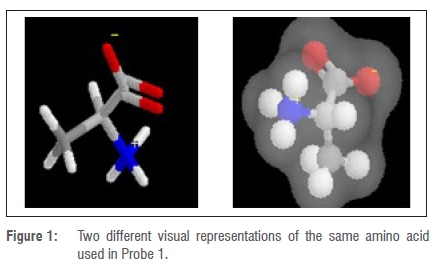
The final test instrument consisted of 12 probes. Each probe assessed more than one of the 24 visualisation skills. All probes included an ER, such as a static diagram or animation, with accompanying text. The probes were presented to students in MS PowerPoint format, with each question having an allotted time in which it had to be answered. For example, in probe 1, students were asked to determine whether two diagrams depicting amino acid features (Figure 1) represented the same amino acid. In this question, students were expected to use visualisation skills and knowledge of symbolic language to explain the concepts represented by the various symbols, graphical markings and visual cues composing the ERs. In essence, the visualisation skill 'analyse' (code T01, Table 1) was the skill of interest, because students were expected to break the ERs down into smaller components or essential features and provide a detailed explanation of each through careful examination.
For the skill 'analyse' (T01), students' responses were scored as 'correct' (3 points) if there was evidence of visualisation skills and correct interpretation of the ER. Such skills were demonstrated through knowledge of the symbolic language and a high degree of conceptual understanding of the biochemistry (propositional) knowledge represented by the ER. A score of 'acceptable' (2 points) was given if there was evidence of a moderate level of visualisation and interpretation of the ER, as demonstrated by some understanding of the symbolic language and biochemistry (propositional) knowledge represented by the ER. A score of 'partially correct' (1 point) was given if there was evidence of very limited visualisation and interpretation of the ER, as demonstrated by a poor understanding of the symbolic language and biochemistry (propositional) knowledge represented by the ER. A score of 'incorrect' (zero) was given if there was an incorrect or no response to the question, or an incorrect interpretation of the ER based on inappropriate reasoning and incorrect symbolic and conceptual knowledge.
Scoring was performed by the three researchers independently, and the results were then compared. Differences and concerns were negotiated among the researchers until consensus was reached. By the end of this exercise, each student had been given an aggregate score for each visualisation skill, which enabled the calculation of an overall average score for the entire student sample and for each visualisation skill (Table 1). This approach led to the output of non-linear raw scores, which were then further processed using the WINSTEPS Rasch model, which is a rating scale model often employed to analyse Likert-type data.15,17,24,25 The Rasch model enabled us to convert the non-linear raw data into linear logit scores25,26 which were then used to rank the visualisation skills in order of difficulty (Figures 2 and 3). We also used the logit scores to construct a person-item map (Figure 4) that indicated students' relative levels of VL.
Validation of the instrument
To improve the trustworthiness and credibility of our instrument, the lead researcher first developed the instrument independently by identifying relevant cognitive skills from Bloom's taxonomy. The list of identified skills was presented to the two co-researchers, who individually scrutinised the skills and probes for face and content validity. Concerns were negotiated among the researchers until consensus was reached. Thereafter an independent panel of experts was consulted to further validate the instrument for face and content validity. In line with a previous study21, the panel was made up of nine experts, P1 to P9, including three postgraduate biochemistry students, two biochemistry lecturers (PhD-qualified) and four senior science educators.
The experts completed a questionnaire that required them to scrutinise each probe in terms of its legitimacy and appropriateness for the current study. In particular, they considered whether the probes were valid measures of each identified visualisation skill and the particular biochemistry propositional knowledge that was being assessed. The questionnaire consisted of both open-ended and closed-ended items. Responses to the closed items were scored on a Likert scale of 0, 1, 2 or 3 for 'strongly disagree', 'disagree', 'agree' and 'strongly agree', respectively. Content validity indices21 were calculated to determine whether any of the designed probes required revision or exclusion. Based on the expert feedback, necessary adjustments were made to improve and optimise the test instrument.
Reliability of the instrument
The Rasch model was also employed to determine various measures of test instrument reliability. The first measured variable was 'dimensionality', which is an important measurement in using the Rasch model.15,16,22 Unidimensionality was assumed if the fit statistics ranged between 0.5 and 1.7, as suggested by Velozo et al.16 and Wright and Linacre18. The dimensionality of our items (visualisation skills) ranged from 0.56 to 1.6 for infit statistics, and from 0.58 to 1.66 for outfit statistics. These values suggested our data were unidimensional, which further justified the use of the Rasch model in our study.
Test-retest reliability was also calculated, to ensure internal consistency in scoring the items. For this assessment, the test was administered twice to one group, over 8 weeks. Internal consistency was measured using SPSS to determine if the mean scores were the same. The retest results indicated a statistically significant correlation between the initial and second tests, with a correlation coefficient of 0.45 (p<0.0001, 95% CI: 0.27 to 0.59). The results yielded a Cronbach alpha value of 0.798. These values showed that the results from the first test were consistent with the results of the second test, which indicates satisfactory internal consistency.
Administration of the instrument
Ethical clearance was obtained from a South African university (name withheld for ethical reasons; ethical clearance number HSS/0150/07). All participating students were over 18 years of age and gave their written consent to participate in the study. The test was administered to 106 third-year students, of whom 31 attended Campus A and 75 attended Campus B at the same university. The students were selected using a purposive (non-probability) sampling method23. All participating students were enrolled in a course on protein structure and function, which covered the propositional knowledge required to answer the probes.
We used predetermined and validated criteria to score student responses to the probes. The probes focused primarily on students' visualisation skills and knowledge of symbolic language, demonstrated by their ability to explain the concepts represented by symbols and graphical cues composing the ERs. The content of each ER was kept simple so that student responses were less influenced by conceptual knowledge and more by cognitive ability to interpret ERs.
Results
Reliability coefficients were calculated using the Rasch model to measure test reliability as well as person reliability. The reliability coefficients were therefore computed for both the Campus A and Campus B student groups. However, probably due to unequal student sample sizes, the Campus B data reflected a higher item reliability coefficient (r = 0.96) than that of the Campus A sample (r = 0.93). This was also reflected in the person reliabilities, which were 0.86 and 0.80 for the Campus B and Campus A data, respectively. Based on this analysis we concluded that the probes were reliable and the persons were reliable.
Ranking visualisation skills by level of difficulty
As indicated above, WINSTEPS Rasch software was used to generate the order of visualisation skill difficulty for both campuses as as shown in Figures 2 and 3. These figures show the order of difficulty of the visualisation skills (Table 1) as tested through the 12 probes. The t-test showed that difficulty levels for the general items (visualisation skills) did not differ significantly for students at the two campuses (p>0.05). However, we noted that the difficulty indices tended to change relative to standard deviations. As shown in Figures 2 and 3, the difficulty level of visualisation skills varied among students, such that overall each skill had a unique difficulty index. However, for both samples (i.e. both campuses), skill T02 ('arrange, order, organise, classify') was the 'easiest' and T18 ('perceive luminance, identify colours') was the 'most difficult'.
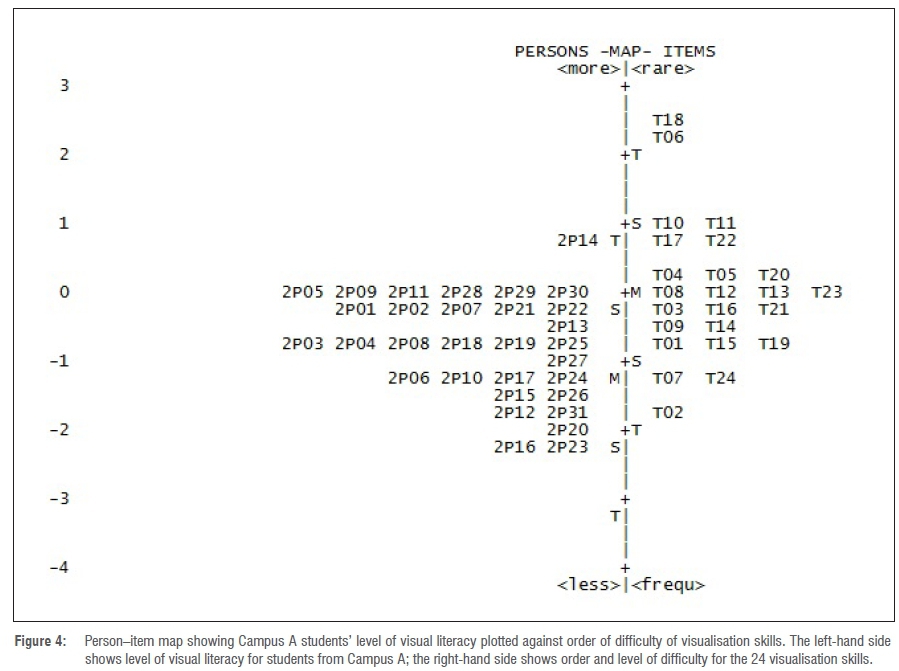
To obtain a more uniform order of item difficulty, data from both sample groups were combined to form one larger dataset. This approach was based on Linacre's27 suggestion that in order to normalise or calibrate a scale of item difficulty, the sample size should range from 16 to 36 and from 27 to 61, such that the standard deviation may lie within ± 1 logit at a 95% and 99% level of confidence, respectively. In accordance with this approach, we used the combined linear logit scores to generate an item difficulty map (Figure 4).
The right hand column of Figure 4 indicates the order and level of difficulty of the 24 visualisation skills (as shown in Table 1). Skills that had similar scores (i.e. differed by less than 0.1 logit) do not have a separating line ( | ) to the left of the items. For instance, visualisation skills T07 ('Describe, discuss, explain') and T24 ('use') had scores that were similar. A similar pattern was observed with T08, T12, T13 and T23. The item mean (M) was set automatically by the Rasch model at zero, representing the average difficulty level, where items above 0 are more difficult and items below 0 are less difficult15. Letters S and T indicate 1 and 2 standard deviations from M, respectively.
Determining relative levels of visual literacy
The retest results for the Campus A sample (n=31) were used to determine students' levels of VL. Using the Rasch analysis, we generated a person-item map for these 31 students (left side of Figure 4). The map shows person ability measures (i.e. Campus A students' VL levels) plotted on the same scale as item difficulty measures (order of difficulty for visualisation skills for the combined Campus A and B dataset). The person-item map (Figure 4) shows the students' level of VL in relation to the visualisation skills item map. The right-hand portion of Figure 4 shows the order and level of difficulty for the 24 visualisation skills (listed in Table 1). The left-hand portion of the person-item map displays a ranking of the participating students in accordance with their converted logit scores. The scale ranges from +3 to -3 logits, with the highest value corresponding to the most visually literate and most difficult skill, and the bottom of the scale indicating the least visually literate and least difficult skill.
The following inferences can be made from the person-item map (Figure 4). Firstly, students 2P05, 2P09, 2P11, 2P28, 2P29 and 2P30, who achieved a VL level of 0 logits, would have a 50% odds of correctly answering the probes for the corresponding visual skills (namely T08, T12 and T13)15. The same students would have only a 25% odds of correctly answering probes for visualisation skills T10 and T11, which have a difficulty level of 1 logit for those students. Secondly, the person-item map suggests that almost all participating students did not show an ability to perform skills T18, T06, T10, T11, T17, T17, T22, T04, T05 and T20 (see Table 1). Students were generally able to perform other skills. Thirdly, for visualisation skills as a whole, student 2P14 scored the highest, whereas students 2P16 and 2P23 scored the lowest in terms of person measure. These three students demonstrated the highest and lowest levels of VL in the Campus A class.
Notably, both the student and item scores followed an (overlapping) normal distribution, with an acceptable spread of values and match between the range of item and person measures, and there were few gaps in the data. This suggests that the test instrument was sensitive to differences in skill difficulty for the participating students, and was also sensitive to differences in student competence in these skills. Only two test items (T06 and T18) showed a difficulty level greater than 2 logits (i.e. greater than 2 standard deviations from M), and none of the person measures showed VL levels above 1 logit. Furthermore, M of person abilities (left portion of Figure 4) was about 1.25 logits lower than M for item measures (right portion), which suggests that the test instrument was generally too difficult for most students in the Campus A sample. This in turn suggests that either the standard of the visualisation test needs lowering, or that action needs to be taken to improve the visual competence of this group of students.
Regarding the need to improve the VL of biochemistry students, it is important to note that out of the 31 students in the Campus A sample, only one student (2P14) obtained a score above the item mean score. In other words, the remaining 30 students had a more than 50% chance of failing or scoring below average15 on the VL test under study. Furthermore, three students (2P20, 2P16 and 2P23) scored below the lowest scoring visualisation skill (T02), and thus had more than 50% odds of failing all the visualisation skill probes in the test instrument. Thus, clearly the test instrument is very sensitive to differences in student levels of VL and could be used as a useful tool to inform both students and instructors about specific remedial needs to improve students' VL.
Discussion and conclusion
Research shows that a lack of VL is one of the major factors leading to poor content understanding among students.7 Schonbörn and Anderson20 also show that visualisation skills are necessary for students to comprehend content knowledge presented in ERs. Consequently, to better understand the causes of poor VL, we wanted to identify and assess visualisation skills required for students to effectively process ERs of biochemistry content. Our study identified and assessed 24 cognitive skills that can be regarded as visualisation skills for biochemistry. Therefore, in addition to teaching content knowledge, biochemistry education should foster the development of these specific visualisation skills so that students can better understand the complex and abstract biomolecular phenomena taught in biochemistry.
A key finding of our study is that VL varies among biochemistry students, as predicted in literature3,8-10. Determining students' levels of VL, and the levels of difficulty of specific skills, means that teachers and curriculum designers can make more informed decisions about prioritising the development of certain skills. This would address the problem identified by scholars, namely that students are not explicitly taught VL, probably because of a lack of suitable framework.10 Furthermore, students' levels of VL can be measured so that developmental programmes can be designed to foster visualisation skills. In addition, instructors can make informed decisions regarding the choice of ERs to use, based on the presence or absence of visualisation skills among students.3 For example, most students in our sample had difficulties with 'depth perception'. Therefore, ERs that require the application of this skill may prove challenging for most students. Instructors need to make sure that before utilising certain ERs, their students have the necessary skills required for optimal comprehension of content.
Schonbörn and Anderson3 point out that the symbolic language used to represent and externalise biomolecular phenomena is difficult for students to master. We argue that the visualisation skills addressed in our study provide the vocabulary for this symbolic language. As the results of the Rasch model showed, students who had an average level of VL had a strong chance of developing and using visualisation skills below the average level. Therefore, the more skills students have, the higher they move on the VL scale, and the more adept they can become at communicating in the symbolic language of biochemistry.
Our study has contributed some unique findings to the literature. The main limitation was that the probes were tested on a sample of students who attended a single learning institution. There is a need to further calibrate the instrument through multiple rounds of testing with a broader sample. Further research is also required on approaches for improving the VL of students, and to remediate any visual difficulties and problems with visualisation skill competence where they might arise. In this regard, it is important to consider explicitly teaching visualisation (and other cognitive) skills as part of the formal biochemistry curriculum.10
Our study may stimulate further important research questions to improve the understanding of VL. For instance, educators and ER designers may ask questions such as: 'Besides conceptual knowledge, which visualisation skills are students expected to have in order to use a particular ER effectively?', 'What visualisation skill(s) is this ER promoting, and how?' and 'What types of ERs are appropriate for the educational level and visual competence of a certain group of students?' Asking such questions is crucial if we wish to see meaningful, effective learning and teaching take place with the use of ERs in biochemistry and the molecular life sciences.
Authors' contributions
L.M. was the main researcher, who led the work, collected and analysed the data, and prepared the manuscript. K.S. was the project co-supervisor and contributed to drafting the manuscript. T.A. was the supervisor of the project and contributed to drafting the manuscript.
References
1. Mnguni LE. The theoretical cognitive process of visualization for science education. SpringerPlus. 2014;3:184 http://dx.doi.org/10.1186/2193-1801-3-184 [ Links ]
2. Burton L. Helping students become media literate. Workshop paper. Australian School Library Association (NSW) Inc. 5th State Conference; 2004. [ Links ]
3. Schonbörn KJ, Anderson TR. The importance of visual literacy in the education of biochemists. Biochem Mol Biol Educ. 2006;34(2):94-102. http://dx.doi.org/10.1002/bmb.2006.49403402094 [ Links ]
4. Dori YJ, Barak M. Virtual and physics molecular modelling: Fostering model perception and spatial understanding. Educ technol soc. 2001;4(1):61-70. [ Links ]
5. Huk T, Steinke M. Learning cell biology with close-up views or connecting lines: Evidence for the structure mapping effect. Comput Human Behav. 2007;23(3):1089-1104. http://dx.doi.org/10.1016/j.chb.2006.10.004 [ Links ]
6. Mayer RE, Hegarty M, Mayer S, Campbell J. When static media promote active learning: Annotated illustrations versus narrated animations in multimedia instruction. J Exp Psychol Appl. 2005;11(4):256-265. http://dx.doi.org/10.1037/1076-898x.11.4.256 [ Links ]
7. Bottomley S, Chandler D, Morgan E, Helmerhorst E. jAMVLE, A new integrated molecular visualization learning environment. Biochem Mol Biol Educ. 2006;34(4):343-349. http://dx.doi.org/10.1002/bmb.2006.494034052666 [ Links ]
8. Littlejohn A, Falconer I, Mcgill L. Characterising effective eLearning resources. Comput Educ. 2008;50(3):757-771. http://dx.doi.org/10.1016/j.compedu.2006.08.004 [ Links ]
9. Grisham D, Power M, Riles P Visual skills of poor readers in high school. Optometry. 2007;78(10):542-549. http://dx.doi.org/10.1016/j.optm.2007.02.017 [ Links ]
10. Anderson TR, Schönborn KJ. Bridging the educational research-teaching practice gap: Conceptual understanding, part 1: The multifaceted nature of expert knowledge. Biochem Mol Biol Educ. 2008;36(4):309-315. http://dx.doi.org/10.1002/bmb.20209 [ Links ]
11. Lowe R. Visual literacy and learning in science. [Document on the Internet.] ERIC Digests, Art. # ED463945. c 2000 [Cited 2012 February 20] Retrieved from http://www.ericdigests.org/2003-1/visual.htm. [ Links ]
12. Seufert T. Supporting coherence formation in learning from multiple representations. Learn Instr. 2003;13(2):227-237. http://dx.doi.org/10.1016/S0959-4752(02)00022-1 [ Links ]
13. Sims E, O'Leary R, Cook J, Butland G. Visual literacy: What is it and do we need it to use learning technologies effectively? Paper presented at Australasian Society for Computers in Learning in Tertiary Education (ASCILITE). Auckland, New Zealand; 2002. [ Links ]
14. Anshel MH, Weatherby NL, Kang M, Watson T. Rasch calibration of a unidimensional perfectionism inventory for sport. Psychol Sport Exerc. 2009;10(1):210-216. http://dx.doi.org/10.1016/j.psychsport.2008.07.006 [ Links ]
15. Bond TG, Fox CM. Applying the Rasch model. New Jersey: Lawrence Erlbaum; 2001. [ Links ]
16. Velozo CA, Kielhofner G, Gern A, Lin F-L, Azhar F, Lai J-S, et al. Worker role interview: Toward validation of a psychosocial work-related measure. J Occup Rehabil. 1999;9(3):153-168. http://dx.doi.org/10.1023/A:1021397600383 [ Links ]
17. Smith AB, Rush R, Fallowfield LJ, Velikova G, Sharpe M. Rasch fit statistics and sample size considerations for polytomous data. BMC Med Res Methodol. 2008;8(1):33. ISSN 14712288 http://dx.doi.org/10.1186/1471-2288-8-33 [ Links ]
18. Wright BD, Linacre JM, Gustafson JE, Martin-Löf P. Reasonable mean-square fit values. Rasch Measurement Transactions. 1994;8:370. [ Links ]
19. Anderson LW, Krathwohl DR, Airasian RW, Cruikshank KA, Mayer RE, Pintrich PR, et al., editors. A taxonomy for learning, teaching, and assessing. New York: Addison Wesley Longman; 2001. [ Links ]
20. Schonbörn KJ, Anderson TR. A model of factors determining students' ability to interpret external representations in biochemistry. Int J Sci Educ. 2009;31(2):193-232. http://dx.doi.org/10.1080/09500690701670535 [ Links ]
21. Hyrkäs K, Appelqvist-Schmidlechner K, Oksa L. Validating an instrument for clinical supervision using an expert panel. Int J Nurs Stud. 2003;40(6):619-625. http://dx.doi.org/10.1016/S0020-7489(03)00036-1 [ Links ]
22. Hsueh IP Wang WC, Sheu CF, Hsieh CL. Rasch analysis of combining two indices to assess comprehensive ADL function in stroke patients. Stroke. 2004;35(3):721-726. http://dx.doi.org/10.1161/01.STR.0000117569.34232.76 [ Links ]
23. Maree K. First steps in research. Pretoria: Van Schaik Publishers. 2007. [ Links ]
24. Boone W, Rogan J. Rigour in quantitative analysis: The promise of Rasch analysis techniques. Afr J Res Math Sci Technol Educ. 2005;9:25-38. [ Links ]
25. Pesudovs K, Garamendi E, Keeves JP Elliott DB. The activities of daily vision scale for cataract surgery outcomes: Re-evaluating with Rasch analysis. Invest Ophth Vis Sci. 2003;44(7):2892-2899. http://dx.doi.org/10.1167/iovs.02-1075 [ Links ]
26. O'Neill T. Definition of a logit. NCLEX Psychometric Technical Brief. 2005;2:1- 3. Retrieved from https://www.ncsbn.org/02_18_05_brief.pdf [ Links ]
27. Linacre JM. Sample size and item calibration stability. Rasch Measurement Transactions. 1994;7(4):328. [ Links ]
 Correspondence:
Lindelani Mnguni
lmnguni@uj.ac.za
Received: 04 Nov. 2015
Revised: 15 Feb. 2016
Accepted: 12 Apr. 2016
FUNDING: None

