


Services on Demand
Article
 English (pdf)
 Article in xml format
 Article references
Indicators

Related links
-
 Cited by Google
 -
 Similars in Google
Share

 Permalink
South African Journal of Science
On-line version ISSN 1996-7489
Print version ISSN 0038-2353
S. Afr. j. sci. vol.112 n.7-8 Pretoria 2016
http://dx.doi.org/10.17159/sajs.2016/20150056
RESEARCH ARTICLE
Effects of animal class and genotype on beef muscle nanostructure, pHu, colour and tenderness
Amanda Y. Chulayo*; Voster Muchenje
Livestock and Pasture Science, Faculty of Science and Agriculture, University of Fort Hare, Alice, South Africa
ABSTRACT
The objective of the study was to determine the effects of animal class and genotype of cattle on Muscularis longissimus thoracis et lumborum (LTL) nanostructure, ultimate pH (pHu), colour and tenderness of beef. We found significant positive relationships between distance travelled (DT) and meat temperature (Tm) (p<0.01); lairage duration (LDhr) and lightness of colour (L*) (p<0.01); ambient temperature (Ta) and L* (p<0.05) and LDhr and yellowness (b*) (p<0.05) of beef from Bonsmara cattle. Positive linear relationships were observed between DT and Tm(p<0.05) and DT and L* (p<0.01) of the non-descript cattle. There were no significant relationships between pre-slaughter stress and other beef quality parameters (pHu, Warner-Bratzler shear force [WBSF], redness [a*] and b*) of Bonsmara, Nguni and non-descript cattle. Muscle fibres differed among class and genotype and had an effect on meat quality. The Bonsmara, non-descript and Nguni cows and heifers had visible skeletal muscle fibres which were thin and long, promising improved tenderness of beef. Genotype and class had significant effects on meat quality parameters (Tm, pHu, L*, a*, b* and WBSF). The first important principal components as they appeared from the analysis were pHu, Tm, L*, a*, b* and WBSF. Therefore, animal class did not affect the nanostructure of beef; instead, meat tenderness was enhanced by the longer and visible muscle fibres. Nguni cattle produced meat of superior quality to that of the Bonsmara and the non-descript cattle.
Keywords: meat quality; muscle fibre; nanostructure; principal component analysis; scanning electron microscopy
Introduction
Meat is an important source of nutrients for people and most consume it also for its flavour, aroma and tenderness. Meat is composed of about 300 distinct muscles of the carcass including the fat deposited in the muscles and connective tissues. Consumers appreciate meat with a bright red colour and a medium amount of fat, referred to as marbling, because it enhances the flavour, juiciness and tenderness of meat.1-3 However, factors that interplay 'from farm to fork' - such as sex, age, nutrition, rearing conditions, weight at slaughter and genetics of the cattle as well as environmental conditions - usually have an impact on the quality of the meat.2,4,5 Other variables affected by these factors include the amount of external and intramuscular fat, the appearance of the meat and sensory properties (such as the aroma, flavour, texture, first impression of juiciness and off-flavours).6 Moreover, the structure of the muscle and the size of the bundles affect the connective tissue and therefore tenderness. Muscles are differentiated into smooth, cardiac and skeletal depending on their structure, contractile properties and mechanism of control. They are responsible for the support and movement of the animal skeleton; movement is initiated voluntarily through impulses of the neurons in the nervous system.6-8
The chemical composition and biological properties of these skeletal muscles are important for a better understanding of the major causes of variations in meat quality, particularly colour, intramuscular fat and tenderness. Meat tenderness is influenced by the amount of myofibrillar and connective tissue of the muscle tissue.9 Furthermore, muscle development in cattle has an effect on muscle structure, connective tissue and tenderness and the quantity of meat produced for human consumption.10 Mapiye et al.11 highlighted that the appropriate utilisation of cattle genotypes with the necessary dietary regimes could be the way forward in order to meet the quality that is required by consumers. According to Strydom et al.12 and Muchenje et al.13, among the local genotypes, Nguni cattle have favourable genes that contribute to better outcomes of this genotype in terms of meat quality. However, besides genotype influences, there are other factors such as pre-slaughter conditions, stunning, animal class, age and nutritional factors which influence the acceptability of beef for consumers.14-16 In addition, it is not possible to improve the tenderness of meat through genetic manipulation of cattle if the nanostructure components - such as sarcomere length, muscle fibre orientation and fibre texture - are not known.17
Some muscles are less favoured by consumers as meat because of their reduced tenderness and discolouration. The meat industry therefore requires reliable information on meat quality throughout the production process that will ensure high-quality meat for consumers.16,18 Variability in meat products prevents the industry from marketing its produce according to quality (tenderness, colour, water-holding capacity and juiciness). Previous studies have been conducted on the improvement of meat quality using genetic variation16,19, optical scattering and absorption coefficients9, sensorial consumer evaluation13,20, and use of video image analysis13,11,21 to measure sarcomere length - with a longer sarcomere resulting in more tender beef. However, there is little information with regard to the influence of genotype and distance travelled by cattle on the tenderness of beef. Therefore, the objective of this study was to determine the quality of beef as affected by genotype, animal class and distance travelled by cattle.
Materials and methods
Study site
The study was conducted in Buffalo City Municipality at a commercial East London abattoir situated in the Eastern Cape Province of South Africa. The abattoir is governed by the Meat Safety Act22and the South African Meat Industry Company23. The abattoir is located 120 km from the University of Fort Hare in Alice (Nkonkobe Municipality in the Eastern Cape).
Animal management
Cattle (n=170) consisting of three breeds (56 Bonsmara, 65 nondescript and 49 Nguni) were brought to the abattoir in trucks by road from different environments at different times. The animal classes per breed (or genotype) are highlighted in Table 1. Upon arrival at the abattoir, distance travelled by the animals was obtained from the drivers. The minimum and maximum distance travelled (DT) and lairage duration (LDhr) recorded ranged from 183 km to 300 km and from 12 h to 16 h, respectively.

The ambient temperatures at the abattoir ranged from 14.5 °C to 19.5 °C in the months of May to July 2014 (autumn-winter season). On arrival, the animals were allowed to rest at the lairages and had ad-libitum access to water overnight. The captive bolt method of stunning was used to stun the animals before they were slaughtered, following the standard slaughter procedures at the abattoir.
Meat quality parameters
At 48 h after slaughter, the hanging carcasses were split in half following the abattoir's procedures. A total of 170 representative samples of the Muscularis longissimus thoracis et lumborum (LTL) muscle (100-mm thick) were cut between the tenth rib and the third lumbar vertebra of the carcass. The samples were then used to determine ultimate pH (pHu) and colour coordinates (lightness, L*; redness, a*; and yellowness, b*). From each breed, 36 samples (from 4 bulls, 4 cows and 4 heifers each) were randomly selected to determine the nanostructure of beef.
Determination of pHu, colour and Warner-Bratzler shear force
A portable fibre-optic pH and Tm meter probe with a sharp metal sheath to prevent damage from raw meat (pH 25, CRISON Instruments S.A., Alella, Spain) was used to measure the ultimate pH and temperature of the carcasses 48 h post-mortem. The pH meter was calibrated before taking measurements using pH 4, pH 7 and pH 9 standard solutions (CRISON Instruments S.A.). The L*, a* and b* colour coordinates were determined at 48 h after slaughter using a Minolta colour guide 45/0 BYK-Gardener GmbH machine with a 20-mm diameter measurement area and illuminant D65-day light, 100 standard observer. The machine was calibrated each day before taking measurements using the green, black and white colour standard samples provided for this purpose. The readings were taken by rotating the colour guide 90° between measurements so as to obtain the average value for the colour. The samples were frozen at -20 °C (for 7 days) until tenderness was measured.
The LTL beef samples were weighed after 1 week of freezing and then thawed for 10 h and weighed again. The samples were placed in a plastic bag and cooked in a water bath at 85 °C for 45 min. After cooking, three sub-samples of meat were cored, parallel to the grain of the meat using a specified core diameter (100 mm). The samples were mounted on an Instron 3344 Universal Testing System (with a crosshead speed of 400 mm/min) and sheared perpendicular to the fibre direction (one shear in the centre of each core) using a Warner-Bratzler shear device. The mean maximum load recorded for the three cores represented the average of the peak force in Newtons (N) for each sample.
Determination of beef nanostructure
LTL muscle samples from four bulls, four cows and four heifers randomly selected from each breed (n=36) were used to determine the nanostructure of beef. The LTL samples were immediately put in a small bottle containing 10% formalin for fixation. The samples were then dehydrated to remove the formalin and kept in ethanol of increasing concentration from 10% to 100% for 20 min at each concentration. In order to improve the electrical conductivity of the sample surface in the scanning electron microscope, a thin film of gold-palladium was used for sputter coating to enhance the analysis. Critical point drying was performed using the Hitachi critical point dryer HCP-2 (Hitachi Koki Co Ltd, Tokyo, Japan) to prevent the samples from alteration and to boost good structural preservation. This was done by mounting the samples on aluminium stubs with double-sided carbon tape then sputter coating with gold-palladium (Au-Pb) using the Eiko IB.3 Ion Coater (EIKO Engineering Co TD, Japan). The samples were then observed under the JEOL JSM-6390LV scanning electron microscope for determination of the skeletal surface area of beef muscles. The nanostructure of the skeletal surface area of beef samples was then viewed using a JEOL JM-5600 scanning electron microscope at a magnification of x5000.
Statistical analysis
PROC GLM24 (general linear model) was used to determine the influence of class and breed on meat quality parameters. PROC REG24 (regression) was performed to determine the potential relationships between pre-slaughter conditions (distance travelled, lairage duration and ambient temperature) and meat quality characteristics (pHu, Tm, L*, a*, b* and Warner-Bratzler shear force [WBSF]). The relationships between pHu, L*, a*, b* and WBSF, and the width and length between intercalated discs of muscle fibres, among animal classes where genotype was used as a random variable, were determined using principal component analysis in JMP 9.0.25
Results and discussion
Animal-related factors, pre-slaughter conditions and beef quality
Table 2 shows the relationships between pre-slaughter conditions -distance travelled (DT), lairage duration (LDhr) and ambient temperature (Ta) - and beef quality characteristics (pHu, Tm, L*, a*, b* and WBSF). Significant positive relationships were observed between DT and Tm (p<0.01), LDhr and L* (p<0.01), Ta and L* (p<0.05) and between LDhr and b* (p<0.05) for Bonsmara cattle. For Nguni cattle, positive relationships were observed between DT and pHu(p<0.001), LDhr and pHu(p<0.01), DT and Tm(p<0.01) and between DT and L* (p<0.01). A negative linear relationship was observed between DT and a* (p<0.05) for Nguni cattle. For the non-descript cattle, positive linear relationships were observed between DT and Tm(p<0.05) and DT and L* (p<0.01), while significant negative relationships were observed between DT and a* (p<0.01), LDhr and Tm(p<0.001) and DT and WBSF (p<0.01). There were no significant relationships between pre-slaughter stress and other beef quality parameters (pHu, WBSF, a* and b*) for Bonsmara, Nguni and non-descript cattle. According to Muchenje et al.13 who observed negative relationships between pre-slaughter conditions and beef quality parameters, poor meat quality can result when animals are exposed to high temperature and humidity during transportation, which causes heat production and reduced energy levels in the muscles.26

The biochemical and physiological changes have a detrimental effect on the amount of muscle glycogen which increases pHu and leads to 'dark, firm and dry' beef. During long transportation distances, animals experience undue stress which reduces meat quality. Stressed animals produce darker and tougher meat, with reduced water-holding capacity.27 Short lairage duration was highlighted to have a negative impact on meat quality. Similar results were observed in the current study in which LDhr had a negative relationship with the L* and a* values of Bonsmara beef. This is an indication that animals did not experience an adequate lairage period to regain the energy levels lost during transportation. However, the beef parameters of other breeds were not significantly affected by lairage period; therefore the observed relationships could also be because of differences among breeds.
The relationship observed between genotype and meat quality parameters was linked to the response of cattle to different environmental conditions prior to slaughter. There was a decline in muscle performance during long hours of transportation, which could be recovered through enough hours of rest at the lairages.28 However, if care is not taken, some animals die before they arrive at the abattoir, which also is a loss to the industry.29,30
The effects of genotype on beef quality characteristics are presented in Table 3. There were significant effects of genotype on Tm(p<0.001), pHu (p=0.0452), L* (p<0.001), a* (p<0.001), b* (p<0.001) and WBSF (p<0.05). Tm (16.5±0.18 °c) and L* (38.6±0.76) were higher in beef from Nguni cattle than that from the non-descript and Bonsmara cattle (Table 3). The difference in the L* values was a result of the amount of myoglobin in the muscle. The lightness of the colour is used by consumers when assessing the visual appearance of meat and thereby influences the purchasing decisions of consumers as reported by Vimiso et al.3 The non-descript cattle had higher values for yellowness (18.4±0.39) and WBSF (54.4±1.69 N) than did Bonsmara (15.7±1.46 and 51.5±2.20 N, respectively) and Nguni (13.3±0.37 and 48.6±1.80 N, respectively) cattle. Genotype therefore had an effect on the WBSF values. In a previous study, genotype was the major determinant of meat quality, especially tenderness, which is considered to be one of the most important factors for consumer satisfaction.31
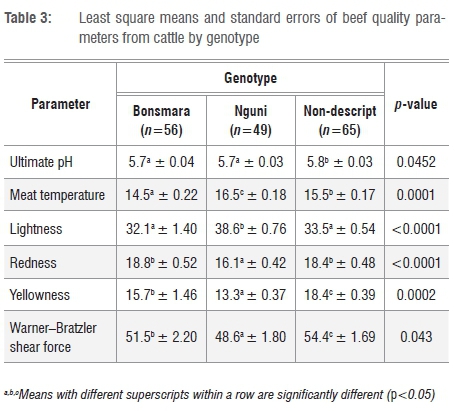
Genotype, age and weight of the animal at slaughter determines the type of meat grade that is produced.32-34 Nguni cattle reportedly produce leaner meat grades than Bonsmara and Angus cattle because of variations in intramuscular fat, fibre types and moisture content.1 However, different fibre types of the skeletal muscles could also have been the cause of variation in tenderness between these three breeds of cattle. A similar report35 indicated that breed had an influence on fibre composition, protein availability, and molecular structure and thereby contractile texture of the muscle, all of which influences tenderness. It was also reported that as the animal ages, the meat becomes redder, tougher and darker as a result of the amount of collagen, haem and myoglobin in the muscles.32,36,37
Monsón et al.38 reported that double-muscled animals produced meat with improved tenderness compared to others. Sanudo et al.33 also indicated that the high WBSF values from larger animals led to tougher beef as a result of a higher intake of grass all year round. The amount of collagen in the muscle may be reduced and transformed into soluble collagen during cooking.39 Enhanced tenderness improves the value of the final meat product.
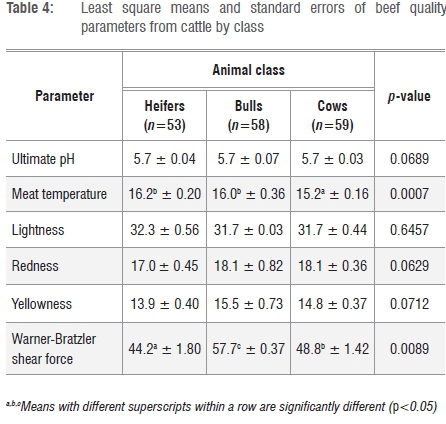
Table 4 shows the effect of animal class on the quality parameters of beef. Significant differences in beef quality parameters were observed between classes, with bulls having higher values of Tm (16.0±0.36 °C) and WBSF (57.7±3.30 N) than heifers (Tm=16.2±0.26 °C and WBSF=44.2±1.80 N) and cows (Tm=15.2±0.16 °C and WBSF=48.8±1.42 N). The results indicated that beef from bulls was relatively tough with less intramuscular fat and reduced flavour. Animal classes of cattle did not exhibit the same body weight, conformation and fatness. Bulls were characterised by higher lean meat content, lower fat and higher bone content than heifers and cows. It has been reported that meat from bulls had undesirable traits such as high pHu, dark colour and toughness, and was hence less desirable for direct market sales.39,40 The observed greater tenderness of meat from heifers was a result of a higher intramuscular fat content and the smaller diameter of muscle fibres. In addition, tenderness increased with age as a result of the structural changes that occurred in the muscles, thus increasing the purchasing and acceptability of the meat because of its enhanced juiciness and flavour.39,41
Nanostructure of beef muscles
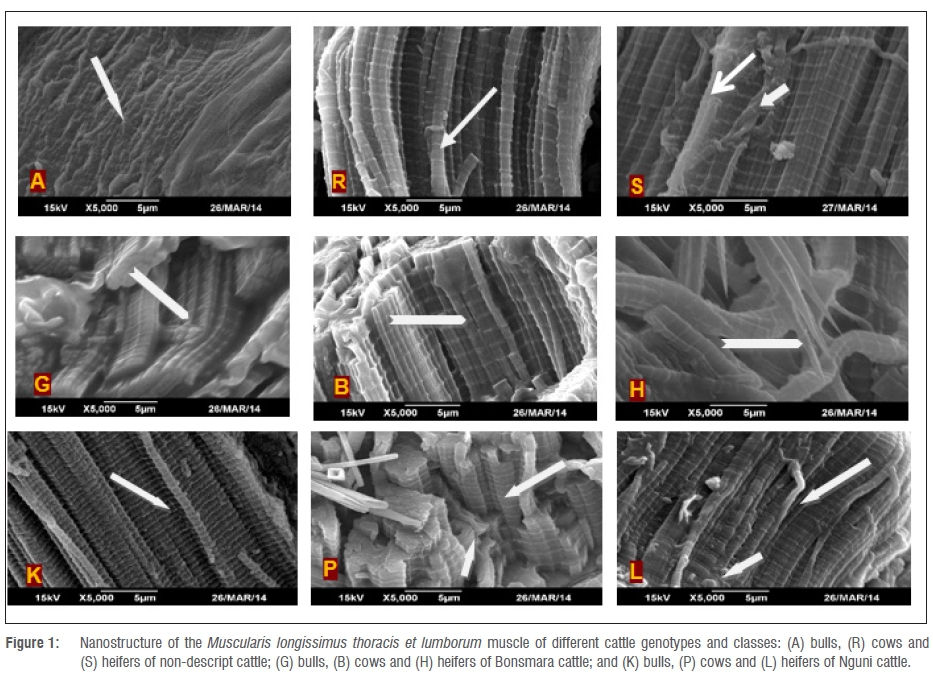
Figure 1 shows the nanostructure of LTL muscles from the non-descript, Bonsmara and Nguni cattle of different classes (bull, cow and heifer). Among the non-descript, Bonsmara and Nguni bulls, different fibre orientation and length between discs were revealed, with non-descript cattle having less visible intercalated discs than the other breeds. However, it was observed that Bonsmara, non-descript and Nguni cows had visible fibres which were thin and long for improved meat tenderness. The observed differences in the muscle fibres has been anecdotally reported to be because of the finer muscle grain that some genotypes possess, making the muscle fibres visible microscopically.18,42 This characteristic is appreciated by consumers because it enhances tenderness.
The heifers of Nguni and non-descript cattle had thin and visible intercalated discs, with few traces of the intramuscular fat that enhances flavour and tenderness. Although conformation and fatness were not determined, it has been reported that these parameters have an effect on fibre orientation.32 Intramuscular fat increases with age because it develops late in the maturation of cattle.4345 Intramuscular fat consists of fat cells which are situated in the perimysium and endomysium that surround myofibrils and muscle fibre bundles. The Bonsmara heifers had visible and thick muscle fibres which indicate tougher meat. Muscle fibre type is linked to variations in the glycolytic rate among animal classes of different genotypes, changes in growth, and meat quality traits. As an animal ages, the collagen content and stability of cross-bridges increases, leading to reduced meat tenderness.18,46 Muscle structure and composition is influenced by breed, and is a factor which must be considered during the selection of meat animals to ensure beef quality as well as quantity.1
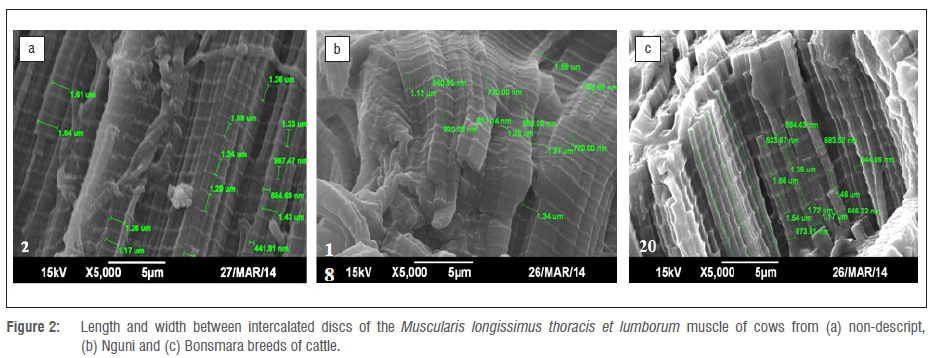
Figure 2 highlights the differences in length between intercalated discs of muscle from different breeds. The length between the z-line of cows of the non-descript breed ranged from 967.47 nm to 1.33 μm whereas the width ranged from 441.81 nm to 684.69 nm. The length between the z-lines of the Nguni cow meat ranged from 720 nm to 1.12 μm while that of the Bonsmara ranged from 1.39 μmto 1.72 μm. The fibre orientations were significantly different between cattle genotypes. Fibre orientation is linked to the tenderness of meat and is greatly influenced by muscle structure of different genotypes and age groups.47 From our results, Bonsmara cows had elongated z-lines compared with the non-descript and Nguni cows, indicating that the sarcomere length of Bonsmara cows was longer, which results in more tender meat and higher acceptability by consumers. Fibres are essential units of all muscles; some are long and narrow with multinucleated cells.48 Previous research has indicated that stress decreases the length of the fibres. The sliding motion of many cross-bridges forces the thin filaments (actin) towards the centre of a sarcomere, so shorter fibres affect the sarcomere length and produce tougher meat.6 Swatland17 has indicated that it is important to understand the function of sarcomere length which forms the length of fibres in order to improve the tenderness of meat. Toughness is associated with dark, firm and dry meat, found especially in animals that are starved for too long.49,50 The collagen content and the stability of cross-bridges increases as the animal ages, causing reduced tenderness.46 This finding was also reported by Koohmaraie and Geesink43 who observed that proteins such as nebulin and desmin play a role in the post-mortem tenderisation of meat as they lie next to the z-line.
A study conducted in chicken by Lukasiewicz et al.49 indicated that genotype had an influence on the histological structure of muscles, such that tenderness, moisture content and muscle pH were affected. Tougher meat was associated with lean and older animals, and especially those that were stressed in the pre-slaughter environment.49 Less tender meat also resulted from muscle fatigue pre-slaughter. During this ante-mortem period, there was a rapid increase in the size of muscle fibres and an increase in the diameter through expansion of new myofibrils and sarcoplasm, which led to tougher meat.10,48 Because meat is a complex structure that is affected by several factors during its production chain, it is of paramount importance to examine the sarcoplasmic changes of animals destined for slaughter.
The length between the z-line of the Nguni bulls was between 720 nm and 1.12 μm, whereas the Brahman cow had a length of 1.39-1.72 μΓη. The shorter distance between the z-lines for the Nguni bulls indicates tougher meat, because the length is below the normal values of 1.53.5 μm.6 White et al.20 indicated that in hot-boned and non-electrically stimulated beef, muscles had shorter sarcomeres which led to higher values for WBSF. In addition, it should be noted that bulls usually produce tougher meat than cows because of differences in the amount of fat between the sexes with cows having more intramuscular fat.50,51 Studies have indicated that the microstructure alterations in beef intramuscular connective tissue are caused by hydrodynamic pressure processing.52 Xia et al.9 characterised cooked beef muscles using optical scattering and absorption coefficients to measure tenderness. However, more research is required to determine the effects of pre-slaughter stress on the sarcomere length of cooked muscles.
Beef quality parameters
Table 5 presents the eigenvalues of beef from heifers, bulls and cows according to the percentage contribution to the total variance. The first important principal components as they appear from the principal component analysis were pHu, Tm, L*, a*, b* and WBSF, with eigenvalues greater than 0.5. The literature indicates that principal components with an eigenvalue greater than 0.5 are considered to be important to contribute to the quality of beef.53 The first two principal components - pHu and Tm - of beef from heifers contributed about 94% of the total variance while pHu and Tm of meat from bulls and cows contributed about 65% and 62%, respectively. Figure 3 indicates the relationship between tenderness and visual aspects of beef quality. The first principal component is explained by the pHu, Tm and WBSF while the second principal component is explained by L*, a* and b*. pHu was positively correlated with WBSF but negatively correlated with a* and b* values. Significant differences were observed between a* and b* and between L* and Tm.

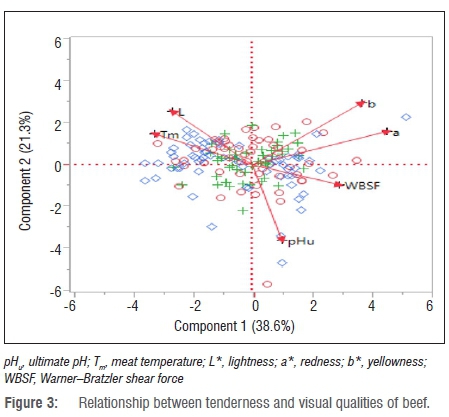
The observed negative relationships between pHu and L* have been previously reported in beef.54,55 This finding implies that the amount of myoglobin was affected by a pH decline in the muscles after slaughter.56 Muscle pH decreased during post-mortem storage of meat as a result of accumulation of lactic acid during glycolysis. However, contrastingly, Purchas57 indicated that ultimate pH and colour coordinates were not related. The technological or physico-chemical properties of meat included meat pH, water-holding capacity, colour, tenderness, thawing and cooking loss, evaporation loss and water distribution.13,53,58
According to Hoffman et al.59, meat quality is the sum of all quality factors of meat in terms of the sensory, nutritive, hygienic, toxicological and technological properties. Muchenje et al.13 first indicated that pHu affected the colour and tenderness of beef. Contradictory reports have, however, shown that pHu is a weak predictor of final meat quality.60
Heifers, bulls and cows had the highest percentage variance for pHu (55%, 40% and 41%, respectively) in comparison to the other meat quality parameters. It has been previously reported that pHu made the highest contribution to beef quality in all animal classes (heifers, bulls and cows).13 This finding agrees with that of Andrés-Bello et al.61 who indicated that pH was the major determinant of functional foods because of the influence it had on other meat quality characteristics. The concentration of hydrogen ions in meat were the determinant of the proceeding chemical reaction, especially when the animal was in a stressful environment which apparently reduced the quality of meat.62 Ultimate pH had an effect on the content of myoglobin which was responsible for the bright colour of meat. In addition, pH was responsible for the increased growth, while at the same time, death of microorganisms, to enhance the enzymatic activities which determine the shelf life of meat. Meat temperature also has an effect, because high meat temperatures favour the growth of microorganisms which eventually deteriorates the quality and shelf life of meat. Moreover, a higher meat temperature also increases the mobility of hydrogen ions as a result of the dissociation that occurs in the molecules, which leads to a change in pH.63,64
Lightness of colour contributed about 5% to meat quality in heifers, although in bulls and cows it contributed about 24% and 15% of the total variance, respectively. So although L* was less important in the quality of meat from heifers, it is an important parameter in meat quality in beef from bulls and cows. The L* values were dependent on the animal class, based on the accumulation of fat, amount of myoglobin and the type of feed consumed. Myoglobin is the principal protein (water soluble) found in muscles and is responsible for the bright colour of meat. Once the colour of meat is reduced, the acceptability of meat is also affected because colour is one of the sensory characteristics used by consumers to judge the freshness of beef. Andrés-Bello et al.61 and Dewi et al.62 agree that colour is important as it affects consumer acceptance of meat. The relationship observed between L* and Tm is associated with the handling of meat after slaughter. An increase in meat temperature reduces the colour of meat and provides a medium for meat spoilage by bacteria.65 Mancini and Hunt66 further indicated that the formation of metmyoglobin depended on temperature and pH, and that meat lightness was the third principal component after pHu and Tm. However, further research is needed to determine the amount of myoglobin that is required to give a bright and acceptable colour to beef from different genotypes and classes of cattle.
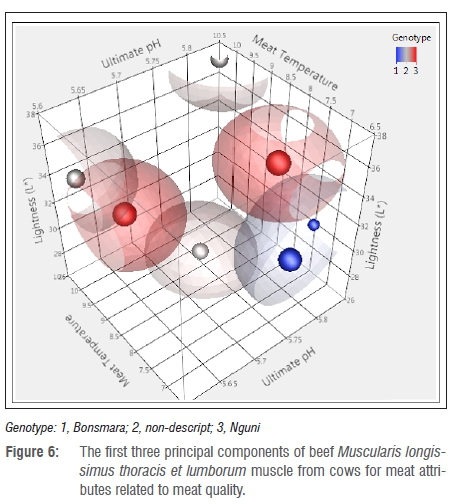
Figures 4-6 present the first three eigenvalues of beef from heifers, bulls and cows, respectively. Heifers, bulls and cows of the Nguni cattle had normal pHu, Tm and L*. Sanudo et al.37 reported that meat becomes darker owing to different factors related to animal age and muscle energy which lead to poor colour stability. The results from the study were also related to age differences between classes as it was observed that older animals tend to have a higher myoglobin content which lowers the L* value leading to darker meat.66 The observed darker meat in Bonsmara cattle was also linked to reduced intramuscular fat, as fat also plays a role in the brightness of meat.11 In addition, darker meat was caused by an increased ultimate pH as a result of depleted glycogen levels and reduced production of lactic acid. Li et al.53 highlighted that pHu influenced the extent of protein denaturation, colour and water-holding capacity of fresh meat. In addition, pH variation is caused by mitochondria consumption67, and the size, thickness and location of the muscle.,


As observed in Table 5, pHu is the primary attribute that controls the outcome of the other meat quality attributes. This implies that when considering the improvement of beef, one has to make sure that the factors that influence pH are minimised as far as possible. In agreement with this study, reports by Li et al.53, Vimiso and Muchenje55 and Scholtz68 indicated that pHu was the major factor in meat quality and the extent of protein denaturation. In addition, the amount of protein in the muscles was negatively affected by reduced metmyoglobin which affected the water-holding capacity and colour stability of the muscle.61,69 This finding is in agreement with reports by Xia et al.9 in which the variation of the pigment and oxidation state led to differences in the L* and a* values.
Conclusion
It could be inferred from this study that animal class and genotype do not affect the nanostructure of beef. Among the Bonsmara, non-descript and Nguni cattle, heifers had a better meat quality than bulls and cows. The first two principal components of beef from heifers had the highest contribution of the total variance followed by bulls and cows. Therefore, the nanostructure of beef was not affected by animal class, with heifers having the best meat followed by bulls and cows. Considering the most important beef quality traits, heifers produced better meat, with pHu, Tm and L* contributing the highest percentages to the total variance.
Acknowledgements
We are grateful to the National Research Foundation of South Africa and the Red Meat Research and Development, Technology and Human Resources for Industry Programme (Projects T079 and T113) and Govan Mbeki Research and Development Centre, University of Fort Hare for funding this research. We thank Ms Elizabeth Famewo, Ms Papadi Nakalebe and Ms Maurine Mangoale for their support during the analysis of the nanostructure of beef at the Scanning Electron Microscopy Unit, University of Fort Hare.
Authors' contributions
A.Y.C. developed this project together with V.M. and designed the data collection process. A.Y.C. further analysed, interpreted and discussed the results while V.M. proofread the manuscript and submitted it to the journal. V.M. also used funds from his research grants to purchase the equipment needed for this research.
References
1. Sisson S, Grossman JD. The anatomy of domestic animals. 4th ed. Philadelphia, PA: WB Saunders; 1953. [ Links ]
2. Maltin CA, Sinclair KD, Warriss PD, Grant CM, Porter AD, Delday MI, et al. The effects of age at slaughter, genotype and finishing systems on the biochemical properties, muscle fibre type characteristics and eating quality of bull beef from suckled calves. Anim Sci. 1998;66:341-348. http://dx.doi.org/10.1017/S1357729800009462 [ Links ]
3. Vimiso P Muchenje V Marume U, Chiruka R. Preliminary study on consumers' and meat traders' perceptions of beef quality and how the beef quality is affected by animal welfare practices. Sci Res Essays. 2012;7(22):2037-2048. http://dx.doi.org/10.5897/SRE12.071 [ Links ]
4. Muchakilla MB, Asimwe L, Kimambo AE, Mtenga LA, Laswai GH. Effect of diet and muscle type on meat quality characteristics of Tanzania Shorthorn Zebu. Livestock Res Rural Dev. 2014;26(10), Art. #186. Available from: http://www.lrrd.org/lrrd26/10/much26186.html. [ Links ]
5. Iwanowska A, Pospiech E. Comparison of slaughter value and muscle properties of selected cattle breeds in Poland - Review. Acta Sci Pol Technol Aliment. 2010;9(1):7-22. [ Links ]
6. Loeb GE, Ghez C. The motor unit and muscle action. In: Kandel ER, Schwartz JH, Jessell TM, editors. Principles of neural science. New York: McGraw-Hill; 2000. p. 674-693. [ Links ]
7. Fayemi PO. Perceptions on ante-mortem welfare, quantitation of pain and pregnancy biomarkers, muscular fibre architecture and quality of Dohne Merino offal [PhD thesis]. Alice: University of Fort Hare; 2013. [ Links ]
8. Albrecht E, Teuscher F, Ender K, Wegner J. Growth- and breed-related changes of muscle bundle structure in cattle. J Anim Sci. 2014;84:2959-2964. http://dx.doi.org/10.2527/jas.2006-345 [ Links ]
9. Xia JJ, Berg EP, Lee JW, Yao G. Characterizing beef muscles with optical scattering and absorption coefficients in VIS-NIR region. Meat Sci. 2007;75:78-83. http://dx.doi.org/10.1016/j.meatsci.2006.07.002 [ Links ]
10. Albrecht E, Lembcke C, Wegner J, Maak S. Prenatal muscle fiber development and bundle structure in beef and dairy cattle. J Anim Sci. 2013;91:3666-3673. http://dx.doi.org/10.2527/jas.2013-6258 [ Links ]
11. Mapiye C, Chimonyo M, Marufu MC, Muchenje V. Stress reactivity and its relationship to beef quality in Nguni steers supplemented with Acacia Karroo leaves. Animal. 2011;5(9):1361-1369. http://dx.doi.org/10.1017/S1751731111000395 [ Links ]
12. Strydom PE, Naude RT, Smith MF, Scholtz MM, Van Wyk JB. Characterisation of indigenous African cattle breeds in relation to meat quality traits. Meat Sci. 2000;55:79-88. http://dx.doi.org/10.1016/S0309-1740(99)00128-X [ Links ]
13. Muchenje V Dzama K, Chimonyo M, Raats JG, Strydom PE. Meat quality of Nguni, Bonsmara and Aberdeen Angus steers raised on natural pasture in the Eastern Cape, South Africa. Meat Sci. 2008;79:20-28. http://dx.doi.org/10.1016/j.meatsci.2007.07.026 [ Links ]
14. Terlouw C. Stress reactions at slaughter and meat quality in pigs: genetic background and prior experience. A brief review of recent findings. Livestock Prod Sci. 2005;94:125-135. http://dx.doi.org/10.1016/j.livprodsci.2004.11.032 [ Links ]
15. Terlouw EMC, Rybarczyk P. Explaining and predicting differences in meat quality through stress reactions at slaughter: The case of Large White and Duroc pigs. Meat Sci. 2008;79:795-805. http://dx.doi.org/10.1016/j.meatsci.2007.11.013 [ Links ]
16. Robinson DL, Ferguson DM, Oddy VH, Perry D, Thompson J. Genetic and environmental influences on beef tenderness. Aust J Exp Agric. 2001;41:997-1003. http://dx.doi.org/10.1071/EA00039 [ Links ]
17. Swatland HJ. Fibre-optic spectrophotometry of beef relative to sarcomere length. Arch Tier Dummerst. 2003;46(1):31-34. [ Links ]
18. Damez JL, Clerjon S. Meat quality assessment using biophysical methods related to meat structure. Meat Sci. 2008;80:132-149. http://dx.doi.org/10.1016/j.meatsci.2008.05.039 [ Links ]
19. Greeff JC, Safari E, Fogarty NM, Hopkins DL, Brien FD, Atkins KD, et al. Genetic parameters for carcass and meat quality traits and their relationships to live weight and wool production in hogget Merino rams. J Anim Breed Genet. 2008;125:205-215. http://dx.doi.org/10.1111/j.1439-0388.2007.00711.x [ Links ]
20. White A, O'Sullivan A, Troy DJ, O'Neill EE. Effects of electrical stimulation, chilling temperature and hot-boning on the tenderness of bovine muscles. Meat Sci. 2006;73:196-203. http://dx.doi.org/10.1016/j.meatsci.2005.11.020 [ Links ]
21. Marino R, Albenzio M, Della Malva A, Caroprese M, Santillo A, Sevi A. Changes in meat quality traits and sarcoplasmic proteins during aging in three different cattle breeds. Meat Sci. 2014;98:178-186. http://dx.doi.org/10.1016/j.meatsci.2014.05.024 [ Links ]
22. Meat Safety Act, Act no. 40 of 2000, South Africa. Red Meat Regulations, 2004 Part V: Humane treatment of animals and slaughter process [Section 11(1) (b)], 64. Requirements for vehicles. [ Links ]
23. South African Meat Industry Company (SAMIC). Classification of South African beef - A key to consumer satisfaction. Pretoria: SAMIC; 2006. [ Links ]
24. Statistical Analysis System (SAS). SAS/STAT Guide to personal computers, version 6. Cary, NC: SAS Institute; 2003. [ Links ]
25. Statistical Analysis System (SAS). JMP 9: Discovering JMP. Cary: SAS Institute; 2010. [ Links ]
26. Ferguson DM, Warner RD. Have we underestimated the impact of pre-slaughter stress on meat quality? Meat Sci. 2008;80:12-19. http://dx.doi.org/10.1016/j.meatsci.2008.05.004 [ Links ]
27. Allen DG, Lamb GD, Westerblad H. Skeletal muscle fatigue: Cellular mechanisms. Physiol Rev. 2008;88:287-332. http://dx.doi.org/10.1152/physrev.00015.2007 [ Links ]
28. Dalla Costa OA, Faucitano L, Coldebella A, Ludke JV Peloso JV Dalla Roza D, et al. Effects of the season of the year, truck type and location on truck on skin bruises and meat quality in pigs. Livestock Sci. 2007;107:29-36. http://dx.doi.org/10.1016/jJivscL2006.08.015 [ Links ]
29. Hoffman LC, Lühl L. Causes of cattle bruising during handling and transport in Namibia. Meat Sci. 2012;92:115-124. http://dx.doi.org/10.1016/j.meatsci.2012.04.021 [ Links ]
30. Van der Wal PG, Engel B, Reimert HGM. The effect of stress, applied immediately before stunning on pork quality. Meat Sci. 1999;53:101-106. http://dx.doi.org/10.1016/S0309-1740(99)00039-X [ Links ]
31. Silva CCG, Rego OA, Simões ERE, Rosa HJD. Consumption of high energy maize diets is associated with increased soluble collagen in muscle of Holstein bulls. Meat Sci. 2010;86:753-757. http://dx.doi.org/10.1016/j.meatsci.2010.06.017 [ Links ]
32. Hulof F, Ouhayoun J. Muscular pH and related traits in rabbits: A review. World Rabbit Sci. 1999;7(1):15-36. [ Links ]
33. Sanudo C, Macie ES, Olleta JL, Villarroel M, Panea B, Albertí P The effects of slaughter weight, breed type and ageing time on beef meat quality using two different texture devices. Meat Sci. 2004;66:925-932. http://dx.doi.org/10.1016/j.meatsci.2003.08.005 [ Links ]
34. Hanzelková S, Simeonovová J, Hampel D, Dufek A, Subrt J. The effect of breed, sex and aging time on tenderness of beef meat. Acta Vet Brno. 2011;80:191-196. http://dx.doi.org/10.2754/avb201180020191 [ Links ]
35. Ryu JH, Kim SH, Lee HY Bai JY Yam YD, Bae JW, et al. Innate immune homeostasis by the homeobox gene Caudal and commensal gut mutualism in Drosophila. Science. 2008;319(5864):777-782. http://dx.doi.org/10.1126/science.1149357 [ Links ]
36. Martínez-Cerezo S, Sanudo C, Panea B, Medel I, Delfa R, Sierra I, et al. Breed, slaughter weight and ageing time effects on physico-chemical characteristics of lamb meat. Meat Sci. 2005;69:325-333. http://dx.doi.org/10.1016/j.meatsci.2004.08.002 [ Links ]
37. Sanudo C, Olleta JL, Campo MM, Panea B, Renand G, Turin F, et al. Meat quality of ten cattle breeds of the southwest of Europe. FAIR1 CT95 0702 - Final Report. c2014 [cited 2014 Nov 26]. p. 190-232. Available from: http://www.recercat.net/bitstream/handle/2072/4685/informefinalcarne.pdf. [ Links ]
38. Monsón F, Sanudo C, Sierra I. Influence of cattle breed and ageing time on textural meat quality. Meat Sci. 2004;68:595-602. http://dx.doi.org/10.1016/j.meatsci.2004.05.011 [ Links ]
39. Wfjglarz A. Quality of beef from semi-intensively fattened heifers and bulls. Anim Sci Pap Rep. 2010;28(3):207-218. [ Links ]
40. Schiavon S, De Marchi M, Tagliapietra F, Bailoni L, Cecchinato A, Bittante G. Effect of high or low protein ration combined or not with rumen protected conjugated linoleic acid (CLA) on meat CLA content and quality traits of double-muscled Pietmontese bulls. Meat Sci. 2011;89:133-142. http://dx.doi.org/10.1016/j.meatsci.2011.03.025 [ Links ]
41. Li C, Zhou G, Xu X, Zhang J, Xu S, Ji Y Effects of marbling on meat quality characteristics and intramuscular connective tissue of beef longissimus muscle. Asian Australas J Anim Sci. 2006;19(12):1799-1808. http://dx.doi.org/10.5713/ajas.2006.1799 [ Links ]
42. Christensen M, Ertbjerg P, Failla S, Sanudo C, Richardson RI, Nute GR, et al. Relationship between collagen characteristics, lipid content and raw and cooked texture of meat from young bulls of fifteen European breeds. Meat Sci.2011;87(1):61-65. http://dx.doi.org/10.1016/j.meatsci.2010.09.003 [ Links ]
43. Koohmaraie M, Geesink GH. Contribution of post-mortem muscle biochemistry to the delivery of consistent meat quality with particular focus on the calpain system. Meat Sci. 2006;74:34-43. http://dx.doi.org/10.1016/j.meatsci.2006.04.025 [ Links ]
44. Ahnström ML. Influence of pelvic suspension on beef meat quality [PhD thesis]. Uppsala: Swedish University of Agricultural Sciences; 2008. [ Links ]
45. Webb EC, O'Neill HA. The animal fat paradox and meat quality. Meat Sci. 2008;80:28-36. http://dx.doi.org/10.1016/j.meatsci.2008.05.029 [ Links ]
46. Petracci M, Cavani C. Muscle growth and poultry meat quality issues. Nutrients. 2012;4:1-12. http://dx.doi.org/10.3390/nu4010001 [ Links ]
47. Muchenje V, Dzama K, Chimonyo M, Strydom PE, Hugo A, Raats JG. Some biochemical aspects pertaining to beef eating quality and consumer health: A review. Food Chem. 2009;112:279-289. http://dx.doi.org/10.1016/j.foodchem.2008.05.103 [ Links ]
48. Dubost A, Micol D, Picard B, Lethias C, Andueza D, Bauchart D, et al. Structural and biochemical characteristics of bovine intramuscular connective tissue and beef quality. Meat Sci. 2013;95:555-561. http://dx.doi.org/10.1016/j.meatsci.2013.05.040 [ Links ]
49. Lukasiewicz M, Niemiec J, Wnuk A, Mroczek-Sosnowska N. Meat quality and the histological structure of breast and leg muscles in Ayam Cemani chickens, Ayam Cemani x Sussex hybrids and slow-growing Hubbard JA 957 chickens. J Sci Food Agric. 2014;95(8):1730-1750. http://dx.doi.org/10.1002/jsfa.6883 [ Links ]
50. Lind V, Berg J, Eilertsen SM, Hersleth M, Eik LO. Effect of gender on meat quality in lamb from extensive and intensive grazing systems when slaughtered at the end of the growing season. Meat Sci. 2011;88:305-310. http://dx.doi.org/10.1016/j.meatsci.2011.01.008 [ Links ]
51. Guerrero A, Velandia Valero M, Campo MM, Sanudo C. Some factors that affect ruminant meat quality: From the farm to the fork: Review. Acta Sci Anim Sci. 2013;35(4):335-347. [ Links ]
52. Zuckerman H, Bowker BC, Eastridge JS, Solomon MB. Microstructure alterations in beef intramuscular connective tissue caused by hydrodynamic pressure processing. Meat Sci. 2013;95:603-607. http://dx.doi.org/10.1016/j.meatsci.2013.05.041 [ Links ]
53. Li YX, Cabling MM, Kang HS, Kim TS, Yeom SC, Sohn YG, et al. Comparison and correlation analysis of different swine breeds meat quality. Asian Australas J Anim Sci. 2013;26(7):905-910. http://dx.doi.org/10.5713/ajas.2012.12622. [ Links ]
54. Kopuzlu S, Onenc A, Bilgin OC, Esenbuga N. Determination of meat quality through principal components analysis. J Anim Plant Sci. 2011;21(2):151- 56. [ Links ]
55. Vimiso P Muchenje V. A survey on the effect of transport method on bruises, pH and colour of meat from cattle slaughtered at a South African commercial abattoir. S Afr J Anim Sci. 2013;43:105-111. http://dx.doi.org/10.4314/sajas.v43i1.13 [ Links ]
56. Byrne CE, Troy DJ, Buckley DJ. Post-mortem changes in muscle electrical properties of bovine M. longissimus dorsi and their relationship to meat quality attributes and pH fall. Meat Sci. 2000;54:23-34. http://dx.doi.org/10.1016/S0309-1740(99)00055-8 [ Links ]
57. Purchas RW. An assessment of the role of pH differences in determining the relative tenderness of meat from bulls and steers. Meat Sci. 1990;27:129-140. http://dx.doi.org/10.1016/0309-1740(90)90061-A [ Links ]
58. Kusec G, Kralik G, Petricevic A, Gutznirtl H, Grguric D. Meat quality indicators and their correlation in two crosses of pigs. Agric Conspec Sci. 2003;86(2):115-119. [ Links ]
59. Hoffman LC, Kroucamp M, Manley M. Meat quality characteristics of springbok (Antidorcas marsupialis). 4: Sensory meat evaluation as influenced by age, gender and production region. Meat Sci. 2007;76:774-778. http://dx.doi.org/10.1016/j.meatsci.2007.02.020 [ Links ]
60. Gajana CS, Nkukwana TT, Marume U, Muchenje V. Effects of transportation time, distance, stocking density, temperature and lairage time on incidences of pale, exudative (PSE) and the physicochemical characteristics of pork. Meat Sci. 2013;95:520-525. http://dx.doi.org/10.1016/j.meatsci.2013.05.028 [ Links ]
61. Andrés-Bello A, Barreto-Palacios V García-Segovia P Mir-Bel J, Martínez- Monzó J. Effect of pH on color and texture of food products. Food Engineer Rev. 2013;5:158-170. http://dx.doi.org/10.1007/s12393-013-9067-2 [ Links ]
62. Dewi SH, Gurnadi E, Priyanto R, Manalu W. Sucrose supplementation, insulin injection and resting period prior to slaughtering on meat physical characteristics in sheep exposed to stressful transportation. J Agric Sci Technol. 2011;1:1162-1165. [ Links ]
63. Hambrecht E, Eissen JJ, Nooijen RIJ, Ducro BJ, Smits CHM, Den Hartog LA, et al. Pre-slaughter stress and muscle energy largely determine pork quality at two commercial processing plants. J Anim Sci. 2004;82:1401-1409. [ Links ]
64. Lin HS, Lee JY Ke BC. Effect of cooking method and storage on the quality of minced pork. J Agric Sci Technol. 2011;1:1249-1256. [ Links ]
65. Singh P Wani AA, Saengerlaub S, Langowski H-C. Understanding critical factors for the quality and shelf-life of map fresh meat: A review. Crit Rev Food Sci Nutr. 2015;51(2):146-177. http://dx.doi.org/10.1080/10408390903531384 [ Links ]
66. Mancini RA, Hunt MC. Current research in meat color. Meat Sci. 2005;71:100-121. http://dx.doi.org/10.1016/j.meatsci.2005.03.003 [ Links ]
67. Hudson NJ. Mitochondrial treason: A driver of pH decline rate in post-mortem muscle? Anim Prod Sci. 2012;52:1107-1110. http://dx.doi.org/10.1071/AN12171 [ Links ]
68. Scholtz MM. Improvement of meat quality in commercial beef and pork production systems. S Afr J Anim Sci. 2007;8:31-34. [ Links ]
69. Kim YH, Lonergan SM, Huff-Lonergan E. Protein denaturing conditions in beef deep semimembranosus muscle results in limited μ-calpain activation and protein degradation. Meat Sci. 2010;86:883-887. http://dx.doi.org/10.1016/j.meatsci.2010.06.002 [ Links ]
 Correspondence:
Voster Muchenje
Livestock and Pasture Science, Faculty of Science and Agriculture
University of Fort Hare, Private Bag X1314
Alice 5700, South Africa
vmuchenje@ufh.ac.za
Received: 02 Feb. 2015
Revised:01 Nov. 2015
Accepted: 29 Mar. 2016
* Current address: Animal, Wildlife and Grassland Science, Faculty of Natural and Agricultural Science, University of the Free State, South Africa

