


![Dichloro(bis[diphenylthiourea])cadmium complex as a precursor for HDA-capped CdS nanoparticles and their solubility in water](/img/en/prev.gif)


Services on Demand
Article
 English (pdf)
 Article in xml format
 Article references
Indicators

Related links
-
 Cited by Google
 -
 Similars in Google
Share

 Permalink
South African Journal of Science
On-line version ISSN 1996-7489
Print version ISSN 0038-2353
S. Afr. j. sci. vol.112 n.7-8 Pretoria 2016
http://dx.doi.org/10.17159/sajs.2016/20150010
RESEARCH ARTICLE
Development of census output areas with AZTool in South Africa
Tholang MokheleI, II; Onisimo MutangaII; Fethi AhmedIII
IPopulation Health, Health Systems and Innovation, Human Sciences Research Council, Pretoria, South Africa
IISchool of Agriculture, Earth and Environmental Sciences, University of KwaZulu-Natal, South Africa
IIISchool of Geography, Archaeology and Environmental Studies, University of the Witwatersrand, Johannesburg, South Africa
ABSTRACT
The use of a single geographical unit to both collect and disseminate census data is common in many countries across the world, especially in developing countries. In South Africa this approach poses some challenges, as the design of small geographical units called enumeration areas to facilitate data collection differs considerably from the design of units that aid data analysis and interpretation. We aimed to create optimised census output areas using the Automated Zone-design Tool (AZTool) program, using the 2001 census enumeration areas as building blocks at various spatial levels, for both rural and urban settings in two South African provinces. The results were consistent and stable. The primary criterion of the confidentiality limit of 500 people was respected at all geographical levels or regions, in both urban and rural settings, for newly created optimised output areas. For the second criterion, lower intra-area correlation values at lower geographical levels for both rural and urban areas showed that higher geographical levels produced more homogeneous output areas than did lower geographical levels or regions. Our obtained intra-area correlation of 0.62 for the two provinces combined indicated that the selected homogeneity variables were good indicators of social homogeneity for creating optimised output areas in South Africa. We conclude that the AZTool software can be used to effectively and objectively create optimised output areas for South African data. Further research on the comparison of the newly created output areas with existing output areas in South Africa should be explored.
Keywords: automated zone design; enumeration areas; output areas
Introduction
Many countries use a single geographical layer for both census data collection and dissemination. This was the case in South Africa prior to the 2001 census. However, this practice has caused challenges for census data users. Firstly, the ideal characteristics of an area to facilitate efficient data collection are not the same as those which aid data analysis.1,2 Secondly, in some enumeration areas (EAs) the population falls below the confidentiality limits, resulting in those EAs being merged with nearby EAs.1,3,4 Thirdly, the design of EAs prior to census data collection did not consider social homogeneity.4,5 Lastly, the shape compactness was also not directly considered.1,3 Certain exceptions exist, such as the United Kingdom, where output areas have been used for census disseminations.5-10
In South Africa, EAs typically contain between 100 and 250 households. The most important criteria for the design of EAs are that they should not overlap, they should have boundaries that can be identified on the ground, and they should be of approximately equal population size to enable an enumerator to cover each unit within the census period.
The fact that census data are collected at household level but are disseminated at higher geographical levels, such as EAs, raises concerns. One problem is the modifiable areal unit problem (MAUP), a term first used by Openshaw11 but originally coined by Gehlke and Biehl12. The MAUP has two components: (1) scale problem -namely the variation in results caused by the progressive aggregation of smaller areas into larger areas; and (2) zoning problem - the variation in results caused by different arrangements of a set of zones.1120 Openshaw11developed the automated zoning procedure (AZP) in an attempt to solve the MAUP problem. Briefly, the AZP algorithm works by iteratively combining and recombining sets of building blocks to create output areas that optimise a set of pre-specified design criteria.10,21,22 The AZP model was further enhanced by Openshaw and Rao23. It was then further reviewed and extended to automated zone matching (AZM) software by Martin in 1998 and 2003, to permit its application to the intersection of two zonal geographical systems.21 In 2006, Cockings, Martin and Harfoot at the University of Southampton developed the AZTool software from AZM. This tool was further enhanced to the current version (AZTool 1.0.3), which does not require ArcInfo for preparing .pat and .aat files.
Among many studies on the automated zone design applications, in 2002 Martin and the Office for National Statistics created output areas for the 2001 census for England and Wales using automated zone design methods24. These output areas were designed to respect minimum population and household threshold sizes of 100 and 40 respectively, as well as a compact shape and with a degree of homogeneity in terms of housing tenure and type. In addition, these output areas had to be nested within higher geographical regions. This project was seen as a success even though there were some concerns about the resulting abstract nature of output area boundaries.
The applications of automated zone design techniques were further employed in the health research environment by Cockings and Martin25 and Flowerdew et al.26 Flowerdew et al.26 used the 1991 limiting long-term illness data in Great Britain, with enumeration districts as building blocks to construct alternative zonal systems with the AZTool zone design algorithm, to determine if neighbourhoods defined in various ways would have similar implications for health. Their results showed that, for sets of pseudo-wards that made sense in terms of population equality and shape, the zonation effect was real. Hence they concluded that it did matter where boundaries are drawn.
Haynes et al.27 compared automated zone design program zones - the A2Z developed by Daras28 - with areal units identified subjectively by local government officers as being communities in the city of Bristol, United Kingdom. They found that automated zone design came close to replicating the subjective communities when the balance
of objectives and boundary constraints was adjusted. In 2009, Ralphs and Ang20 developed new geographies in New Zealand using the AZTool. Their results indicated that the newly created geographies substantially outperformed the current geographies across almost all their optimisation criteria. Ralphs and Ang20 argued that the algorithm they used was stable and consistent, hence it could repeatedly generate high-quality solutions in a timely manner. In France, Sabel et al.22 used the AZTool program (using 250 m x 250 m cells as building blocks) to create new zones to explore relationships between asthma and deprivation in Strasbourg. Their newly-produced synthetic neighbourhood solution performed better than the then-existing IRIS census areas, as shown by stronger statistical relationships between asthma and deprivation.
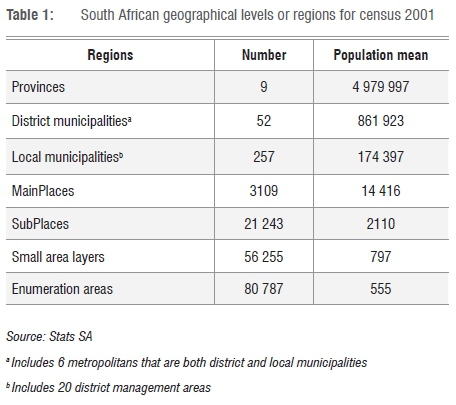
In South Africa, for the 1991 and 1996 censuses, the same EAs were used for both census enumeration and dissemination. For the 2001 census, it was decided that census data must be released for an area larger than an EA to enhance confidentiality.4 For that purpose, two names were attached to each EA, and a spatial layer was created from the name attributes (SubPlaces and MainPlaces). In many instances the areas created were too large for most census data users. In 2005, a non-automated zone design approach was employed to create a small area layer (SAL) for dissemination of the 2001 census in an effort to meet user needs. A similar non-automated zone design approach was employed in the creation of SALs for the 2011 census data. This was mainly to create a spatial area layer that corresponded as closely as possible to the EA layer while adhering to the confidentiality limit of 500 people.4 The following criteria were set and adhered to as far as possible for the creation of the SAL. Firstly, EAs can only be merged if they are within the same SubPlace; secondly, EAs can only be merged if they have the same EA geography type; thirdly, an EA can only be merged if its population is less than 500; and lastly, the resulting small area polygons must have a population total of 500 or more.4 These new criteria resulted in 56 255 SALs from the previous 80 787 EAs, as shown in Table 1. Table 1 highlights the South African geographical levels or regions used for the 2001 census.
The maintenance and update of provincial and municipality boundaries is the responsibility of the Municipal Demarcation Board, while the National Statistics Office (Statistics South Africa, Stats SA) is responsible for the creation and maintenance of MainPlaces, SubPlaces, SALs and EAs. In the creation of the SAL, only the census confidentiality limits and population size were addressed; social homogeneity and output shape were not. It is worth noting that out of 56 255 SALs, 13.5% of the SALs breached the confidentiality limit.4 Although the issue of census output areas being too large for most South African census data users had been addressed by the creation of the SAL, the issue of confidentiality remains a concern. Policies for census output areas vary from country to country, but confidentiality requirements are strictly enforced in almost all countries. Therefore, the advanced techniques of automated zone design methods such as the AZTool are worth exploring for the creation of optimal output areas in South Africa. Our study attempted to address this by creating census output areas with AZTool software, using the 2001 census EAs as building blocks and prioritising the confidentiality limit (minimum population threshold of 500) as well as homogeneity, population mean target and shape compactness. In addition, we examined the performance of the AZTool program for both urban and rural areas in South Africa at different geographical levels or regions. This was to give a general picture as to how the program was likely to perform when the entire country was analysed.
Methods
Study area
The study area comprised two of the nine provinces of South Africa. These were Free State, representing rural settings, and Gauteng, the most populated province but the smallest in area, representing urban areas. Free State province includes the former homelands of Phuthaditjhaba and Botshabelo, and is one of only two provinces that did not experience any provincial boundary change for the 2001 and 2011 censuses. It experienced less than 1.5% population increase within that period. Gauteng, by contrast, is the most populated and developed province in South Africa, and had the highest population growth between 2001 and 2011 (2.7%). The analysis of both provinces provides examples of rural and urban settings in South Africa.
The provincial, district, municipality and MainPlace levels were analysed for each province, to gain a better understanding of the performance of the AZTool at each geographical level in both rural and urban settings. In the Free State, Thabo Mofutsanyane district and Maluti-a-Phofung municipality were selected. In addition, Phuthaditjhaba MainPlace (a former homeland) was analysed to gain a full understanding of the behaviour of the AZTool at lower geographical levels in a rural setting. For Gauteng, City of Tshwane Metropolitan (which is both a district and a metropolitan municipality) was analysed, and Pretoria MainPlace was selected from this district or metro to explore the potential challenges that might occur in urbanised settings at lower geographical levels or regions.
AZTool software
The AZTool software version 1.0.3 (available from www.geodata.soton.ac.uk10) was used for the creation of optimal output areas in our study. As mentioned earlier, this software was derived from the AZP developed by Openshaw11. The AZP-based algorithms normally take input building blocks and iteratively aggregate them into larger output areas from an initial random aggregation, by checking the effect of swapping individual building blocks between output areas based on criteria set by the user. Such criteria include mean population target, minimum population threshold, homogeneity and compactness of the shape. The user may also set various options for how the AZTool will operate; for example, how many iterations and swaps the AZTool should run, whether donuts are allowed or not (that is, one output area surrounding another), setting minimum boundary lengths, and allowing output areas to be wholly contained within higher geographical levels or regions.20
Data preparation
Our study employed EAs from 2001 census estimates29 as building blocks to create new census output areas in South Africa. We were not able to access data at household and EA levels from Stats SA. The ESRI ArcGIS 10.2 software was used to prepare data for analysis by the AZTool and to display output results. The variables employed were total population, dwelling type and geotype, and higher geographical levels or regions. The geotype variable was the geography type of the EA, which was divided into the following categories: Geotype1=Formal Urban, Geotype2=Informal Urban, Geotype3=Informal Rural (tribal areas), and Geotype4=Formal Rural (farms). The AZTool expects the intra-area correlation variables to be provided as counts. Therefore, the geotype variable - which contained the above four categories - was expanded into four attributes, one for each category (each with a count of 0 or 1).
The AZTImporter, which is part of the AZTool software download, was used to convert the building block shapefile (geospatial vector data format) to polygon attribute table (.pat) and arc attribute table (.aat) files. These files have the format required by the AZTool software.
Zone design criteria
The criteria or rules for the AZTool runs were set in the .xml parameter file. This file specifies the location of .aat and .pat files as well as defining the parameters, rules, constraints, criteria and column position of variables in the .pat file to be used in the AZTool run. The following criteria were considered for developing optimised output areas:
• minimum threshold population size: 500 (minimum used by Stats SA4)
• homogeneity: IAC measure of dwelling type and geotype variables
• shape compactness: perimeter squared per area (P2A)
• mean target population: 1000
The minimum threshold population size is a hard constraint, as are the higher geographical regions. The others are soft constraints, which are traded off in the objective criteria as in previous studies - which also indicated that it is not possible to satisfy all four criteria20,25,30. The weights for population target, homogeneity (IAC score) and shape compactness were left at the default weight of 100%, indicating that all were weighted equally. The same design criteria were applied to all geographical levels in both rural and urban settings.
Confidentiality limit
The population variable from the 2001 census was used for respecting the confidentiality limit, with a minimum population of 500 set for output areas.4 Generally, statistical spatial data analysis requires the aggregation of basic spatial areas into larger areas to preserve confidentiality, to minimise population differences and to reduce inaccuracies in the data.18Therefore, the population target mean was also set to 1000 in this study in order to minimise population differences.
Degree of homogeneity
To measure the degree of homogeneity within the created output areas, IAC was employed. The IAC is a direct measure of within-area homogeneity, which is the correlation for a given variable between different people living in the same areal unit.7,31-33 Higher values indicate a higher degree of homogeneity within areas, coupled with a higher degree of heterogeneity between areas.7,33,34 The homogeneity variables that were selected from the 2001 census data included dwelling type and geotype. The dwelling type or housing type is a variable commonly used as a proxy for the social built environment homogeneity measure, as it has been identified as one of the variables that tends to possess a high degree of homogeneity.7,20 It was therefore applied in our study. The EA geographical type (geotype) was also used as one of the rules to create the SAL that was used to disseminate 2001 census data in South Africa.4
Shape compactness
Shape compactness, adapted from Cockings and Martin25 and Haynes et al.27, was used in an effort to produce more compact (circular rather than linear) output areas. The overall perimeter squared per area (P2A) was used as a measure of shape compactness. Lower P2A mean values indicated that output shapes were more compact, whereas higher P2A mean values indicated that output areas were less compact.
Results
This section presents results for both rural and urban settings at all geographical levels. Figure 1a shows the boundaries of original EAs of Phuthaditjhaba MainPlace, and indicates an EA that is widely spread on the northern part of the study area. This is typical especially for rural areas in South Africa. In most cases, EAs that are large in size in the rural areas are sparsely populated. Figure 1b shows the newly created output areas for the same area of Phuthaditjhaba. Donut EAs or building blocks, which are areas that completely surround other areas (such as the ones on the north-eastern part of our study area), no longer show in the new output areas. These have been combined with other building blocks to form the largest output area in terms of size. However, the largest EA in terms of coverage or area does not possess the greatest total population. This indicates that some building blocks which formed the new output area were not as populated as some of their counterparts in the same northern part, or in the southern part of the study area.


Table 2 highlights the statistical characteristics of the original EAs and the newly created output areas for the rural areas in all four geographical regions. It is important to note that the original EAs were slightly more homogeneous and compact than the newly created output areas, at all geographical levels. The confidentiality threshold of 500 was not breached at any of the four geographical levels (MainPlace, municipality, district and provincial). The results show a steady increase in IAC from the lower geographical level (0.22) to the higher geographical level (0.59), meaning that the degree of homogeneity within–area increased as the geographical level increased. The mean population sizes were also close to the targeted mean, with reasonable standard deviations, but the MainPlace level had a higher mean value and standard deviation compared with the municipal level. The mean shape tended to increase from lower to higher geographical levels, indicating that the output areas at higher geographical levels were much less compact in shape than those of lower geographical levels (which had lower means and lower standard deviations).
For urban areas, a similar trend was noticed. The EAs were slightly more homogeneous and compact than the newly created output areas at all geographical levels. Table 3 shows that the IAC increased dramatically from 0.09 at MainPlace level to 0.46 for the district or metro level. The provincial level experienced a slight decrease to 0.45. The mean population limit was adhered to at all geographical levels, as it was for the rural areas. For both rural and urban areas, IAC values at the lower geographical levels were smaller than IAC values at higher geographical levels.
This means that higher geographical levels produced more homogeneous output areas than did the lower levels. This finding might be due to the fact that at higher geographical levels there are many building blocks that output areas can be constructed from, whereas at lower geographical levels there are fewer building blocks and hence the AZTool has limited options with regard to improving the IAC or any other constraints. With regard to the compactness of the shape of the output areas, a contradiction to what happened in rural areas was noted. The lower geographical levels' output areas were less compact compared with those of higher geographical areas.
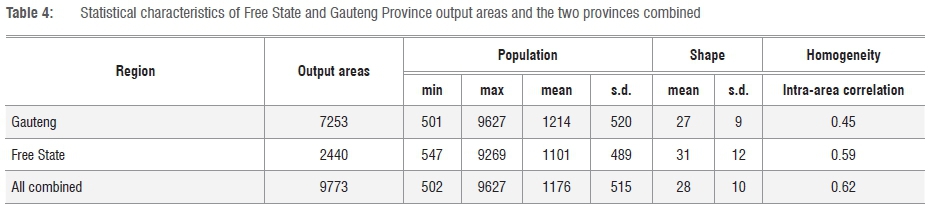
Table 4 shows the comparison of rural and urban provinces as well as their combined results. The mean population threshold was not breached for either province or when the two were combined. The urban province, Gauteng, seemed to be outperformed by the rural province with regard to the degree of homogeneity, but it outperformed the rural province with regard to compactness of the output shapes. Similar trends were noted at other geographical levels. The IAC for two provinces combined was higher than that of the two provinces run separately, whereas the shape of output areas for the combined provinces was more compact than that of Free State province. The higher degree of homogeneity (IAC of 0.62) for both provinces combined suggests that the selected variables can be used as good indicators of social homogeneity, to create homogeneous output areas across the entire country.
Optimal number of AZTool runs
Several AZTool runs were performed for Phuthaditjhaba and Pretoria MainPlaces to see if increasing the number of iteration runs would improve the results. For Phuthaditjhaba, there was only a slight improvement in the results when the runs were increased up to 1000. For Pretoria MainPlace, IAC values remained constant throughout the runs (10 to 1000) at 0.09, while the mean shape compactness declined only slightly from 28 to 27 after 500 runs. It is worth noting that the higher number of runs came at a price of increased processing time. Therefore, if no tangible improvement with regard to output areas is achieved with a higher number of runs, it may be wise to retain a low number of runs; hence, 10 runs were kept in this case. On average, it took approximately three to four hours of processing time when Gauteng and Free State provinces were combined, with 10 runs. Free State province on its own, and lower geographical regions in both rural and urban areas, took a much shorter time to complete. We anticipate that if the creation of census output areas using the AZTool program is considered for the entire country, processing might take between 10 and 18 hours. But with an increased number of runs, such as 1000, processing would take even longer.
Respecting higher geographical levels or regions
In an effort to make sure that output areas were nested within higher geographical regions such as MainPlace, municipality and district, the 'Respect Regions' rule was set to 'True' in the .xml parameter file for the AZTool program. The AZTool could not successfully produce any solutions when any of the higher geographical regions were respected. To overcome this, higher geographical regions were analysed separately and merged at the end to produce an overall output for Free State province (Table 5). The results show that an average IAC score (0.46) for the five districts was below the exact IAC score (0.59) for Free State. The importance of census output areas nesting within higher geographical levels is to enable exact statistics to be compiled for geographical areas used for applications such as elections or public resource allocation. However, these higher geographical levels change regularly as the population grows, which makes it difficult to keep census output areas nested within them. Hence, some countries - including Australia, England and Wales - have removed the requirement for census output areas to be nested within certain higher geographical levels.34
Boundary length constraint
Boundary length is the length of the perimeter of boundaries that is shared between adjacent building blocks. When minimum boundary length was set to 5%, the shape of the output areas for Pretoria MainPlace improved slightly compared with the shape of the original EA building block. At the same time, the population mean increased away from the population target mean. The IAC measure did change compared to when the minimum boundary length was ignored. Care should be taken when using this option, as many building blocks might become isolated due to boundary length restrictions. This was the case for Phuthaditjhaba MainPlace.
Donut constraint
Overall, donut areas were allowed in all analyses. Figure 2a shows some donut output areas (shaded on the map) in the western part of Pretoria MainPlace. Further experiments were undertaken with donuts not allowed in the final output areas for MainPlace, municipality and district levels for the two provinces. When comparing 'donuts allowed' against donuts not allowed', the results showed that not allowing donuts had little or no effect on the shape compactness of the output or on the IAC score's degree of homogeneity. For example, the western part of Pretoria MainPlace no longer contained donuts, as illustrated in Figure 2b. In general the inclusion of a donut constraint made no real difference in this experiment. The donut criterion might be of importance in a broader application for avoiding disjointed census output areas, especially when output areas are created for mapping and analysis.
Discussion
This paper illustrates the potential of automated zone design techniques, and possible challenges that might occur when applying such techniques in the creation of optimised output areas in South Africa. Generally, we noted that the original building blocks were slightly more homogeneous and compact than the newly created output areas, at all geographical levels and for both rural and urban settings. The IAC values were smaller at lower geographical levels than those of any higher geographical levels, for both rural and urban areas. This indicates that higher geographical levels produced more homogeneous output areas than did lower geographical levels. One reason might be that at a higher geographical level there are many building blocks from which output areas can be constructed, whereas at lower geographical levels there are fewer building blocks. Hence, the AZTool has limited options with regard to improving IAC and other constraints. Similarly, in New Zealand, Ralphs and Ang20 found that larger areas seemed to be more homogenous with each other compared with smaller areas (i.e. evidence of a scale effect of MAUP). Lower IAC scores for lower geographical levels - MainPlace levels - were also noted in previous studies at detailed levels.9,10,33
When comparing the performance of the AZTool at the two spatial settings, urban and rural areas, the newly created output areas from rural areas had higher degrees of homogeneity than their urban counterparts. However, the urban areas were more compact than the rural areas. Overall, the relatively high degree of homogeneity for all provinces combined (urban and rural provinces), with an IAC of 0.62, suggests that the selected variables can be used as good indicators of social homogeneity in creating homogeneous output areas across South Africa. Generally, an IAC of 0.5 is regarded as a very reasonable degree of homogeneity.22 It is also important to mention that in all our experiments that were performed for urban and rural areas at all geographical levels, the confidentiality limit was adhered to.
Ideally, increasing the number of runs should improve the AZTool's solution, as it enables finding better optimal output areas. On the contrary, results from this study did not show reasonable improvement of optimal output areas when different numbers of runs were explored. Our results concur with previous studies that were conducted with the AZTool, such as those of Ralphs and Ang20 and Sabel et al.22 When increasing the number of runs, they found that increasing numbers of iteration runs achieved little real improvement in the quality of outputs, while significantly increasing computing time. Therefore, we are confident that setting the number of runs to 10 can still produce quality output areas even when expanding the analysis to the entire country.
The donut constraint had minimal effect on the quality of output areas with regard to shape and degree of homogeneity. Therefore, we did not restrict output areas to exclude donuts in the final output areas. That means donuts were allowed as in the initial run. To make sure that output areas were nested within a higher geographical level or region, the AZTool was set to respect higher geographical regions. Unfortunately the program did not produce any solutions when any higher geographical levels were respected. Cockings et al.10 argued that having to respect a higher geographical region constraint is particularly restrictive and often prevents solutions being found at all. Further investigations need to be performed to examine the cause of this in the context of South African geographical areas. To overcome this challenge, higher geographical regions can be analysed separately and merged at the end to produce an overall output, even though this might be time-consuming for larger samples.
The uniqueness of our approach in this study was that we considered the performance of the AZTool program for both urban and rural areas at different geographical levels or regions. This provided a clear indication as to how the program is likely to perform when the whole of South Africa is analysed. In addition, the current version of the AZTool has promising potential for application in developing countries, including South Africa, as it does not require an ArcInfo licence for preparing the contiguity files (.aat and .pat files). However, further consultations with relevant stakeholders should be undertaken before output areas from this study can be considered for possible use for any census data dissemination, as each set of output areas is the product of a set of criteria determined by the authors.
From a policy and practice point of view, it is important to note that this research was a stand-alone project with the aim of influencing policies and practice of government stakeholders, such as Stats SA. We believe that the positive findings from these initial experiments regarding the AZTool applications in the creation of census output areas in South Africa will encourage future possible collaboration between researchers and government stakeholders (such as Stats SA) as well as other South African census data users.
Regarding the limitations of our study, the poor accessibility of data at lower geographical levels (such as household and EA levels) and from the most recent 2011 census posed a problem. Hence, only the 2001 census EA estimates data were used as building blocks. Based on literature, there seems to be a challenge with regard to accessing census data at lower geographical levels for research purposes or for other purposes such as business and marketing, due to confidentiality.20,25,34Alternatively, dwelling-frame data could have been used, but this was challenging because the data had a lot of missing information or dwellings that were not captured in some areas across the country. The use of household-level data would have minimised the flaws carried by administrative data (EAs), which were created for a different purpose, when using EAs as building blocks for the created output areas. Therefore, caution should be taken when using pre-existing input areas to aggregate them into larger areas, as the flaws that are inherent in the building blocks will be carried over into the output areas - as well as possible bias and potential errors associated with the MAUP20,30,34.
Conclusion
The success of this study is evident in the fact that the primary criterion of minimum population threshold of 500 people was kept and not breached throughout all newly created output areas, at different geographical levels, and for both rural and urban areas. In addition, the second most prioritised criterion, homogeneity of output areas, showed IACs of 0.45 for Gauteng, 0.52 for Free State, and 0.62 for both provinces combined. These IAC values are encouraging, as international studies show that an IAC of 0.5 indicates a highly acceptable degree of homogeneity within output areas. Based on these findings from different spatial settings and different geographical levels, we conclude that the AZTool software could be used to effectively and objectively create optimised output areas in South Africa. Further research should explore comparisons of the newly created output areas with existing output areas in South Africa. The availability or accessibility of data at lower geographical levels, such as the household level (or updated dwelling-frame data in South Africa), is highly recommended. The use of such data would improve the development of robust and optimised output areas using automated zone design techniques.
Acknowledgements
We sincerely thank Prof. David Martin and Dr Samantha Cockings for their permission to use the AZTool software (which is copyright to David Martin, Samantha Cockings and the University of Southampton). We also thank Ms Leana Meiring and Prof. Zitha Mokomane for editing and proofreading this paper.
Authors' contributions
T.M. prepared and analysed the data. F.A. and M.O. supervised the work and guided the main author. T.M. wrote the manuscript, and F.A. and M.O. provided valuable contributions to the final manuscript.
References
1. Martin D. 2001 Census output areas: From concept to prototype. Population Trends. 1998;94:19-24. [ Links ]
2. Hofstee P Islam M. Disaggregation of census districts: Better population information for urban risk management. 25th Asian Conference on Remote Sensing, 22-26 November 2004, Thailand. [ Links ]
3. Martin D. Optimizing census geography: The separation of collection and output geographies. Int J Geogr Inf Sci. 1998;12(7):673-685. http://dx.doi.org/10.1080/136588198241590 [ Links ]
4. Verhoef H, Grobbelaar N. The development of a small area layer for South Africa for census data dissemination. [Document on the Internet]. Pretoria: Statistics South Africa; 2005 [cited 2014 May 31]. Available from: http://www.cartesia.org/geodoc/icc2005/pdf/poster/TEMA26/HELENE%20VERHOEF.pdf [ Links ]
5. Martin D. Neighbourhoods and area statistics in the post 2001 census era. Area. 2004;36(2):136-145. http://dx.doi.org/10.1111/j.0004-0894.2004.00210.x [ Links ]
6. Duke-Williams O, Rees P. Can offices publish statistics for more than one small area geography? An analysis of the differencing problem in statistical disclosure. Int J Geogr Inf Sci. 1998;12(6):579-605. http://dx.doi.org/10.1080/136588198241680 [ Links ]
7. Martin D, Nolan A, Tranmer M. The application of zone-design methodology in the 2001 UK Census. Environ Plann A. 2001;33(11):1949-1962. http://dx.doi.org/10.1068/a3497 [ Links ]
8. Martin D. Geography for the 2001 census in England and Wales. Population Trends. 2002;108:7-15. [ Links ]
9. Martin D, Cockings S, Harfoot A. Development of a geographic framework for census workplace data. J Roy Stat Soc. 2013;176(2):585-602. http://dx.doi.org/10.1111/j.1467-985X.2012.01054.x [ Links ]
10. Cockings S, Harfoot A, Martin D, Hornby D. Maintaining existing zoning systems using automated zone-design techniques: Methods for creating the 2011 Census output geographies for England and Wales. Environ Plann A. 2011;43(10):2399-2418. http://dx.doi.org/10.1068/a43601 [ Links ]
11. Openshaw S. A geographical solution to scale and aggregation problems in region building, partitioning and spatial modelling. T I Brit Geogr. 1977;2(4):459-472. http://dx.doi.org/10.2307/622300 [ Links ]
12. Gehlke CE, Biehl K. Certain effects of grouping upon the size of the correlation coefficient in census tract material. J Am Stat Assoc. 1934;29:169-170. [ Links ]
13. Openshaw S. The modifiable areal unit problem. Norwich, UK: Geo Books; 1984. http://dx.doi.org/10.1068/a160017 [ Links ]
14. Reynolds HD. The modifiable unit problem: Empirical analysis by statistical simulation [PhD Thesis]. Toronto, Canada: University of Toronto; 1998. [ Links ]
15. Ratcliffe JH, McCullagh MJ. Hotbeds of crime and the search for spatial accuracy. J Geograph Syst. 1999;1(4):385-398. http://dx.doi.org/10.1007/s101090050020 [ Links ]
16. Kitchin R, Tate NJ. Conducting research into human geography, theory, methodology & practice. London: Prentice Hall, Essex; 2000. [ Links ]
17. Heywood I, Cornelius S, Carver S. An introduction to geographical information systems. 2nd ed. London: Pearson Prentice Hall; 2002. [ Links ]
18. Duque JC, Ramos R, Surinach J. Supervised regionalization methods: A survey. Int Regional Sci Rev. 2007;30(3):195-220. http://dx.doi.org/10.1177/0160017607301605 [ Links ]
19. Dumedah G, Schuurman N, Yang W. Minimizing effects of scale distortion for spatially grouped census data using rough sets. J Geograph Syst. 2008;10(1):47-69. http://dx.doi.org/10.1007/s10109-007-0056-y [ Links ]
20. Ralphs M, Ang L. Optimized geographies for data reporting: Zone design tools for census output geographies. Statistics New Zealand Working Paper No 09-01. Wellington: Statistics New Zealand; 2009. [ Links ]
21. Martin D. Extending the automated zoning procedure to reconcile incompatible zoning systems. Int J Geogr Inf Sci. 2003;17(2):181-196. http://dx.doi.org/10.1080/713811750 [ Links ]
22. Sabel CE, Kihal W, Bard D, Weber C. Creation of synthetic homogeneous neighbourhoods using zone design algorithms to explore relationships between asthma and deprivation in Strasbourg, France. Soc Sci Med. 2013;91:110-121. http://dx.doi.org/10.1016/j.socscimed.2012.11.018 [ Links ]
23. Openshaw S, Rao L. Algorithms for reengineering 1991 Census geography. Environ Plann A. 1995;27(3):425-446. http://dx.doi.org/10.1068/a270425 [ Links ]
24. Martin D, Office for National Statistics. Output area production: Overview of the system used to create the Output Areas. 2002 [cited 2016 February 1]. Available from: https://www.ons.gov.uk/census/2001censusandearlier/dataandproducts/ outputgeography/outputareaproduction [ Links ]
25. Cockings S, Martin D. Zone design for environment and health studies using pre-aggregated data. Soc Sci Med. 2005;60(12):2729-2742. http://dx.doi.org/10.1016/j.socscimed.2004.11.005 [ Links ]
26. Flowerdew R, Manley DJ, Sabel CE. Neighbourhood effects on health: Does it matter where you draw the boundaries? Soc Sci Med. 2008;66(6):1241- 1255. http://dx.doi.org/10.1016/j.socscimed.2007.11.042 [ Links ]
27. Haynes R, Daras K, Reading R, Jones A. Modifiable neighbourhood units, zone design and residents' perceptions. Health Place. 2007;13(4):812-825. http://dx.doi.org/10.1016/j.healthplace.2007.01.002 [ Links ]
28. Daras K. An information statistics approach to zone design in the geography of health outcomes and provision [PhD Thesis]. Newcastle, England: University of Newcastle; 2006. [ Links ]
29. HSRC. 2001 census EA estimates. Human Sciences Research Council in collaboration with Prof DJ Stoker. Pretoria, South Africa; 2005. [ Links ]
30. Drackley A, Newbold KB, Taylor C. Defining socially-based spatial boundaries in the Region of Peel, Ontario, Canada. Int J Health Geogr. 2011;10(38):[12], 12 pages. http://dx.doi.org/10.1186/1476-072X-10-38 [ Links ]
31. Flowerdew R. How serious is the modifiable areal unit problem for analysis of English census data? Population Trends. 2011;145(1):106-118. http://dx.doi.org/10.1057/pt.2011.20 [ Links ]
32. Tranmer M, Steel D. Using local census data to investigate scale effects. In Tate NJ, Atkinson PM, editors. Modelling scale in geographical information science. Chichester: John Wiley & Sons; 2001. p. 105-122. [ Links ]
33. Tranmer M, Steel D. Using census data to investigate the causes of the ecological fallacy. Environ Plann A. 1998;30(5):817-831. http://dx.doi.org/10.1068/a300817 [ Links ]
34. Cockings S, Harfoot A, Martin D, Hornby D. Getting the foundations right: Spatial building blocks for official population statistics. Environ Plann A. 2013;45(6):1403-1420. http://dx.doi.org/10.1068/a45276 [ Links ]
 Correspondence:
Tholang Mokhele
Population Health, Health Systems and Innovation
Human Sciences Research Council
Private Bag X41, Pretoria 0001, South Africa
TAMokhele@hsrc.ac.za
Received: 12 Jan. 2015
Revised:03 Aug. 2015
Accepted: 13 Feb. 2016

