


Services on Demand
Article
 English (pdf)
 Article in xml format
 Article references
Indicators

Related links
-
 Cited by Google
 -
 Similars in Google
Share

 Permalink
South African Journal of Science
On-line version ISSN 1996-7489
Print version ISSN 0038-2353
S. Afr. j. sci. vol.112 n.5-6 Pretoria May./Jun. 2016
http://dx.doi.org/10.17159/sajs.2016/20160032
RESEARCH ARTICLE
Multimodal spatial mapping and visualisation of Dinaledi Chamber and Rising Star Cave
Ashley KrugerI; Patrick Randolph-QuinneyI, II, *; Marina ElliottI
IEvolutionary Studies Institute, School of Geosciences, University of the Witwatersrand, Johannesburg, South Africa
IISchool of Anatomical Sciences, University of the Witwatersrand, Johannesburg, South Africa
ABSTRACT
The Dinaledi Chamber of the Rising Star Cave has yielded 1550 identifiable fossil elements - representing the largest single collection of fossil hominin material found on the African continent to date. The fossil chamber in which Homo naledi was found was accessible only through a near-vertical chute that presented immense practical and methodological limitations on the excavation and recording methods that could be used within the Cave. In response to practical challenges, a multimodal set of recording and survey methods was thus developed and employed: (1) recording of fossils and the excavation process was achieved through the use of white-light photogrammetry and laser scanning; (2) mapping of the Dinaledi Chamber was accomplished by means of high-resolution laser scanning, with scans running from the excavation site to the ground surface and the cave entrance; (3) at ground surface, the integration of conventional surveying techniques as well as photogrammetry with the use of an unmanned aerial vehicle was applied. Point cloud data were used to provide a centralised and common data structure for conversion and to corroborate the influx of different data collection methods and input formats. Data collected with these methods were applied to the excavations, mapping and surveying of the Dinaledi Chamber and the Rising Star Cave. This multimodal approach provides a comprehensive spatial framework from individual bones to landscape level.
Keywords: Cradle of Humankind; Homo naledi; laser scanning; vertebrate taphonomy; archaeological survey
Introduction
The field recovery of hominin fossils and other skeletal remains is a process which owes much of its practical and epistemological background to prehistoric archaeology and archaeological field techniques. As such, searching for, recovering and collecting evidence from a sub-surface or surface scatter of bones are disruptive processes that occur during field investigation. Field archaeology is, by its very nature, a destructive process1 - once a fossil (or stone tool) has been removed, it can never be put back in its original place, and the link to its context of deposition is broken. As a result, the goal of spatial field recording is to ensure that all items and samples taken from a site can be sourced to their particular context and modelled in three dimensions. Adequate survey and mapping techniques allow investigators to maintain a record of where every item of evidence was found within a defined area, allowing the investigator to recreate the order of events that took place from when the deposit was first exposed, to final recovery. The recording process of any site usually follows the traditional archaeological field recording and requires at least two fixed reference points from which the fieldworker can extrapolate the position of any bone or sample within a deposit, using basic spatial geometry. In many respects the practical fundamentals of field recording of bones, artefacts, dating and sediment samples, is a largely unchanged component of archaeological field skills, and can use items as simple as tape measures, plumb-bobs, and pencil and drafting film, up to the level of electronic distance measuring devices, the Global Positioning System (GPS), photogrammetry and non-contact surface laser scanning.1 Regardless of the level of technology utilised, it is critical that any recording system allows the archaeologist or palaeoanthropologist to accurately record, plot and model the contexts and contents of a site as precisely as possible in three dimensions. Whether the expected outcome is hand-drawn maps and plans, or three-dimensional computerised models of a site, the fundamental principles are the same.
Historically, work conducted in the Cradle of Humankind with three-dimensional recording methods aimed for visualisation of geological structures, taphonomic associations, and linkages between in-situ and ex-situ fossils. With respect to early hominin sites, mapping the cave systems with reference to the excavation process is essential to understanding the development and movement of sediments and geological units, and has been advanced by several researchers in Africa and Europe.2-20 Because of the breccified nature of the primary fossil deposits of the Cradle of Humankind (Taung, Gladysvale, Sterkfontein, Kromdraai, Swartkrans, Makapansgat and Malapa), conventional archaeological recovery techniques using traditional methods of recording and planning of discrete contexts (production of single-context plans, overlays and sections, e.g. those used by fieldworkers in the UK) have been difficult to apply in South Africa. Many historical excavations, such as the central component of Sterkfontein21,22 or Cave of Hearths (Makapansgat)23,24, have traditionally used an above-site fixed-grid system from which metal poles or markers are suspended, allowing for an approximation of spatial location to the level of the nearest cubic yard or cubic metre, or using offsets from the grid to determine x-y-z location within a square or cubic unit with greater precision. With the advent of laser-rangefinder technology later South African excavators have often sought to record the general position of fossils and fossil blocks within the cave by means of broader coordinate systems, using instruments such as electronic distance measuring devices, laser theodolite or total stations (although the adoption of this technology has been relatively late in South African palaeoanthropology as a result of the prohibitive cost of purchasing such equipment).
Three-dimensional digitisation of caves has been undertaken by many researchers since the late 1990s, and has often been used in conjunction with other archaeological and palaeontological data collection methods. Some of the earliest uses of three-dimensional recording within the Cradle of Humankind were undertaken by Quinney and Calabrese in mapping the 'Little Foot' StW 573 skeleton at Sterkfontein in 199825, using a Leica total station in conjunction with PenMap surveying software. This undertaking allowed for the precise three-dimensional collection of coordinate data (x, y and z axes) and the reconstruction of contour maps of the exposed geological units within which the skeleton was entombed. Other work (1997 to 2001) by Quinney, Sinclair and colleagues at sites within the Makapansgat Valley (including the Limeworks australopithecine site and the Cave of Hearths) used the same Leica/PenMap system to assist in the construction of archaeological site plans within individual excavation units, and to combine these with landscape-level surveys of river terraces, sinkholes and fossil-bearing caves, in order to build up broadscale spatial data of the landscape and karstic features.26,27 In combination with aerial survey data from microlight aircraft, photogrammetry and Geographical Positioning System (GPS) data, the spatial data was integrated into a geographical information system (GIS) model of landscape archaeology in IDRISI.27
Later work in 2002 by Lacruz and colleagues28 at the site of Gladysvale provided a three-dimensional surface (mesh) visualisation of the cave system extrapolated from total station coordinate data, and, more importantly, situated the cave system in direct spatial reference to the current landscape surface. This was followed by Nigro and colleagues13, who developed an integrated GIS framework in order to map and analyse the fossil deposits at Swartkrans.
Methods of spatial coordinate capture and three-dimensional visualisation of hominin-bearing deposits are now routinely applied at palaeoanthropological fieldschools such as those undertaken at Drimolen and Sterkfontein. All excavations at the site of Malapa (including work on ex-situ dump deposits) have utilised three-dimensional recording from total station equipment (Figure 1). Recent research excavations by Stratford at the site of Sterkfontein have focused on the use of three-dimensional coordinate systems for the mapping of geological units, artefactual and fossil deposits, integrated into a GIS framework.29 This work has resulted in significant methodological advances compared to earlier approaches and has led to practical frameworks comparable to those applied at European cave excavations.30 Most recently, Subsol and colleagues31 applied surface laser scanning to capture the in-situ three-dimensional morphology of the StW 573 skeleton. This work included a test of different laser scanners in order to judge the efficacy and efficiency of different technical set-ups, with resulting recommendations for best practice in such environments.
Such work within the Cradle of Humankind has been mirrored elsewhere in South Africa and beyond, with laser scanning in particular being used in an increasing capacity to record fragile cultural heritage, or to facilitate public understanding of the past through three-dimensional reconstruction. Within cave environments, laser scanning (combined with GIS data) has been applied to spatial reconstructions and mapping, often in conjunction with conventional spatial survey.2-20,29-32
Three-dimensional data can also be used in the reconstruction of previously worked sites which were excavated before technology such as terrestrial laser scanning existed. In one such case study, Puchol and colleagues5 virtually recreated an archaeological excavation site using three-dimensional laser scan data and integrating the data with previously recorded archaeological data, to analyse the spatial context from over 60 years earlier. This amalgamation of 'old' and 'new' data allowed the researchers to extract entire data sets which might not have even been considered in the past. This increases the need for accurate three-dimensional recording of sites, as the better the quality and resolution of recorded data, the easier it will be to relate to new and developing methods of data capture in the future.
Rising Star excavations and Homo naledi
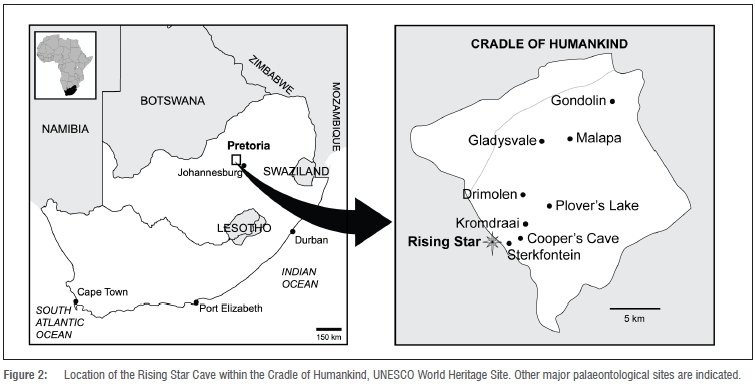
The Rising Star Cave system is located in the Cradle of Humankind World Heritage Site, some 50 km outside of Johannesburg, South Africa (Figure 2). Whilst amateur cavers had been periodically visiting the Cave for a number of years, an incursion by a caving team from the Evolutionary Studies Institute in September 2013 was the first to formally investigate the system for the fossil remains of early hominins. Excavations in November 2013 and March 2014 yielded 1550 identifiable fossil elements representing a minimum of 15 individuals; 300 bone specimens were collected from the surface of the Dinaledi Chamber and 1250 fossil specimens were recovered from a small excavation pit in the chamber floor. This assemblage is the largest single collection of fossil hominin material found on the African continent to date, and has been assigned to the de novo hominin taxon, Homo naledi. The taxonomy of this new species is detailed by Berger and colleagues33, with the geological and taphonomic context by Dirks and colleagues34. The latter includes a detailed description of the recovery and recording methods applied to the excavation, with aspects detailed in additional commentaries on inferred mortuary behaviours by Randolph-Quinney35,36.
Taphonomically, the assemblage presents a unique situation compared to other South African early hominin-bearing karstic cave sites for three reasons: (1) the hominin remains are numerous and concentrated in a very small area; (2) with the exception of a small number of recent intrusive rodent and bird bones, only hominin bones are found within the Chamber; and (3) the assemblage is unique by what it lacks - there is no evidence of carnivore modifications, sub-aerial exposure or weathering, peri-mortem breakage or trauma, cut marks, or fluvial transport, and no evidence of burning or charring of remains.
Furthermore, the Dinaledi Chamber presents an anomalous depositional environment in comparison to the primary historical hominin sites of the Cradle of Humankind in Gauteng - Sterkfontein, Kromdraai and Swartkrans.34,37 The latter sites are noted for fossil remains contained in lithified breccia or found in decalcified sedimentary units derived ultimately from clastic breccias. The Dinaledi Chamber is unique in that the fossils were recovered from unconsolidated sediments, and appear never to have been lithified during their depositional history. The basic stratigraphic development of the cave infill is divided into two facies (Facies 1 and 2, with 1 being the oldest) subdivided into three stratigraphic units (1-3, from old to young). Unit 1 comprises reworked laminated mudstones preserved as erosion remnants within the Chamber. Unit 2 is a composite unit that consists of remnant outcrops of variably consolidated sediments containing hominin bones. Unit 3 is the youngest stratigraphic unit, composed of largely unconsolidated sediment derived from weathering and erosion of Units 1 and 2. The majority of the hominin bones was derived from Unit 3. The clay-rich sediments making up the units were derived from in-situ weathering, and from exogenous clays and silts, which entered the Chamber through fractures that prevented passage of coarser-grained materials. Thus, the infill of the Dinaledi Chamber is largely endogenous, fine grained and unconsolidated in nature.34 Because of the sedimentary environment, recovery of fossils could proceed relatively rapidly using methods more akin to bioarchaeology, rather than the traditional palaeontology of the Cradle in which fossils are extracted from calcified breccia blocks. Unfortunately, the size of the Chamber and the difficulty of the access route precluded the use of conventional surveying equipment such as total stations and necessitated a trade-off in conventional excavation recording strategies. This situation presented immense practical and methodological limitations on the excavation and recording methods that could be used within the cave, where conventional methods of high-resolution spatial data retrieval proved impossible.
Materials and methods
As historical work at sites such as Gladysvale, Makapansgat and Sterkfontein has demonstrated, three-dimensional coordinate data are seen as essential in placing fossil remains in context. At Rising Star, this contextualisation includes collecting three-dimensional data, visualising and understanding the location of fossil material in relation to (1) other material in the Dinaledi Chamber, (2) other chambers within the Rising Star Cave system and (3) the position of the Chamber relative to the landscape surface and surrounding structural geology. Collection of such data demanded high-resolution acquisition, and necessitated the use of equipment of considerable monetary value. Data collection techniques used at the Rising Star Cave ranged from landscape level, down to scanning in-situ fossils (Figure 3). A centralised data structure, in the form of point cloud data, was fundamental to integrating these different formats and data types, many of which have not been integrated in this way at any palaeontological site before.
In response to the practical challenges noted above, a multimodal set of recording and survey methods was developed and employed for use at Rising Star: (1) recording of spatial distribution of the fossils (spatial taphonomy) and the excavation process was achieved through the use of white-light photogrammetry and laser scanning; (2) mapping of the Dinaledi Chamber in landscape context, with scans running from the excavation site to the ground surface and the cave entrance, was accomplished by means of high-resolution laser scanning; (3) at surface level, the integration of conventional surveying techniques as well as photogrammetry with the use of an unmanned aerial vehicle (UAV) was applied. Point cloud data were used to provide a centralised and common data format for conversion and to corroborate the influx of different data collection methods and input formats. Data collected with these methods pushed the boundaries of both technology and image reconstruction as applied to the excavations, mapping and surveying of the Dinaledi Chamber and the Rising Star Cave. This multimodal approach represents the first time that such a seamlessly integrated three-dimensional survey has been applied to a South African hominin site, and provides a comprehensive spatial framework from individual bones within the excavation context, up to the landscape level.
White-light source photogrammetry
The constraints of the Rising Star Cave and Dinaledi Chamber affected both excavators and equipment and demanded an innovative approach to collecting high-resolution spatial data. These data are important for documenting spatial orientation, but can also be used for mapping and surveying. During excavations in November 2013 and March 2014, a handheld Artec Eva (Luxembourg City, Luxembourg; http://www.artecthree-dimensional.com/hardware/artec-eva/) white-light source photogrammetry device was employed for this purpose. 'Painting' or 'sweeping' the desired area with the Artec Eva produces a real-time visualisation of the scan area on an accompanying laptop computer. The Eva has its own white-light source, which is activated in a series of strobe-like flashes during data capturing. Documenting the excavations within the Dinaledi Chamber with the Eva served two purposes. Firstly, spatial data on the location and orientation (axial and surface) of every bone were collected, with a surface resolution of approximately 0.5 mm and a three-dimensional point accuracy of approximately 0.1 mm. Secondly, the data recorded during this process were transported to the surface after every scan, allowing the scientists above ground to provide guidance and direction to the excavators concerning excavations and recovery.
Fossil material from Unit 3 of the Dinaledi Chamber31 was scanned at approximately 50-mm intervals, or before and after large amounts of material were removed from the sediments. This meant that the excavation recordings were limited to a maximum interval of 50 mm or less. To date, the main excavation area has been excavated to an average depth of 100 mm, and is represented by 151 Artec scans. Fossil material from other parts of the Dinaledi Chamber (i.e. not from the main excavation area, and found mostly at surface level) was also scanned before and after recovery using the same equipment and method.
The post-scan process was managed in Artec Studio 9 (and more recently Artec Studio 10 Professional). Each scan 'sweep' comprised a number of separate images compiled into a single layer. Each scan was then registered to acquire three-dimensional triangulated points. Once registration was complete, the separate layers were manually aligned, using a minimum of three reference points. These reference points were a combination of fixed survey markers within the Dinaledi Chamber, and physical features of the excavation area, which were captured in each scan to provide optimal registration. Once alignment was complete, a global registration process allowed for the scan data to be merged accurately. This produced a three-dimensional mesh representation of the scanned area. The three-dimensional mesh was then overlain with a photographic texture map, captured by the Artec Eva concurrently at the time of scanning. The final product resembles a realistic, photo-like, overlay of the three-dimensional scan. After compiling each three-dimensional scan, the surface scan was exported as a PLY (polygon file format, also known as the Stanford triangle format), which was then stitched together to create a composite surface scan from multiple scans. This composition allowed for the excavation areas and Chamber to be visualised in a three-dimensional environment, through time. Each individual three-dimensional scan, once registered, aligned and fused, was then converted to the E57 file format38 for three-dimensional imaging data exchange for effortless visualisation and coordinate system manipulation in AutoDesk Recap.
High-resolution laser scanning
Data capture of large areas proved to be cumbersome with the Eva as even small areas (e.g. <1 m2) of the cave walls or floor, could produce gigabytes of scan data, and in turn many hours of data rendering, fusion and meshing. As a result, a FARO Focus3D X330 laser scanner (Lake Mary, FL, USA; http://www.faro.com/products/three-dimensional-surveying/laser-scanner-faro-focus-three-dimensional/) was used to scan the Dinaledi Chamber, as well as the route between the Chamber and the entrance of the Rising Star Cave system. The Focus3D scanner is physically larger than the Eva and is capable of scanning areas or objects from 0.6 m to a maximum of 330 m. This range was advantageous as large portions of the Rising Star Cave could be scanned relatively quickly.
With a distance accuracy of about 2 mm, the Focus3D scanner was able to produce ultra-high resolution, accurate scans of the cave.
To allow the best possible registration and geo-referencing while scanning in the Rising Star Cave, each scan with the Focus3D scanner was undertaken with the use of 145-mm diameter spheres. These spheres have a magnetic base that attaches to a steel bracket and allows for secure placement. As the cave surfaces are extremely rough and inconsistent, the team modified a number of JOBY GorillaPods (Petaluma, CA, USA; http://joby.com/gorillapod) for positioning the spheres throughout the cave. In this manner, it was possible to attach the spheres securely and safely to various formations and features in the cave. The spheres were placed strategically throughout the cave to complete the scanning as efficiently and accurately as possible, with a minimum of 3 and a maximum of 10 spheres present in each scan.
The Dinaledi Chamber was scanned in its entirety with six scans, each of which took 10-12 min to complete at a resolution of 3.086 mm per 10 m scanned. At this resolution, a point cloud of 173 million points per scan was achieved. A set of 37 scans was completed on a slightly lower resolution of 6.136 mm per 10 m scanned, producing a point cloud of 43 million points per scan. A total of 43 scans was completed, to capture the entire path from the entrance of the Rising Star Cave system to, and including, the Dinaledi Chamber, with the exception of the very confined 'Chute' area (discussed later). Each scan totalled approximately 300 MB and all 43 were combined to create an ultra-accurate point cloud, map and digitisation of the Rising Star Cave. Scans were processed with FARO's SCENE software and were then exported to the Pointools POD file format (.pod) with a compression accuracy of 1 mm. The .pod files were visualised and given a coordinate system with the utilisation of AutoDesk Recap.
UAV photogrammetry
A UAV was used to capture data of the land surface above the Rising Star Cave system. The UAV used was the Aerialtronics ATX8 (Den Haag, the Netherlands) with a full-frame Nikon D610 digital single-lens reflex (DSLR) camera attached. A total of 1031 time-lapse images were taken over three flights, at a height of 103 m. Each flight lasted approximately 8 min. Calibration and corroboration of the data were accomplished using four ground control points, as well as a Nikon GP-1A GPS unit. The program Agisoft Photoscan was used to generate the three-dimensional spatial data, which were then exported as .tiff and .txt data formats. The data were imported to AutoDesk Recap (.rcp) and assigned a coordinate system, which was then overlaid on the Eva and FARO scanner data. In this way, it was possible to accurately locate the Dinaledi Chamber in relation to the ground above it.
Other scanning techniques
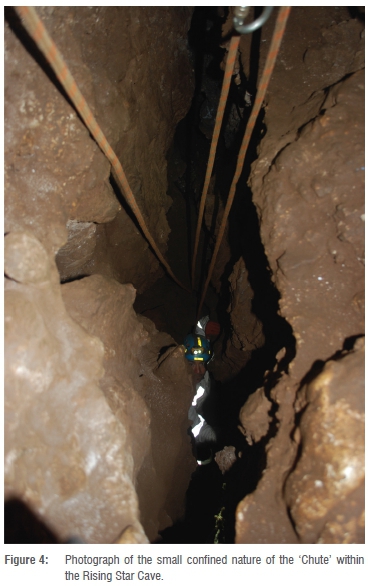
The 'Chute' is an extremely difficult and confined 12-m fissure leading down into the Dinaledi Chamber (Figure 4). Despite several attempts, the nature of this passageway proved to be too difficult to scan using either the Artec Eva or FARO Focus3D scanners. Consequently, in order to link the three-dimensional spatial data of the two systems, the Chute was manually mapped and measured using a Leica DISTO S910 laser distance meter. Points were measured at intervals between the top and bottom of the Chute, in the form of x, y and z coordinates at a resolution of approximately 1 mm. Known points collected with the Focus3D were shot in with the S910 and used to align the Dinaledi Chamber scan data with the rest of the laser scan data acquired from the top of the Chute all the way back to the entrance of the Cave.
Manual surveying of the ground above the cave system was also conducted, using traditional surveying techniques. Data acquired in this way were compiled in AutoDesk AutoCad (.dwg file format) and once again overlaid on the data collected with the white-light source photogrammetry, high-resolution laser scanning and UAV photogrammetry. Above ground, two fixed beacons were erected, and assigned UTM coordinates.
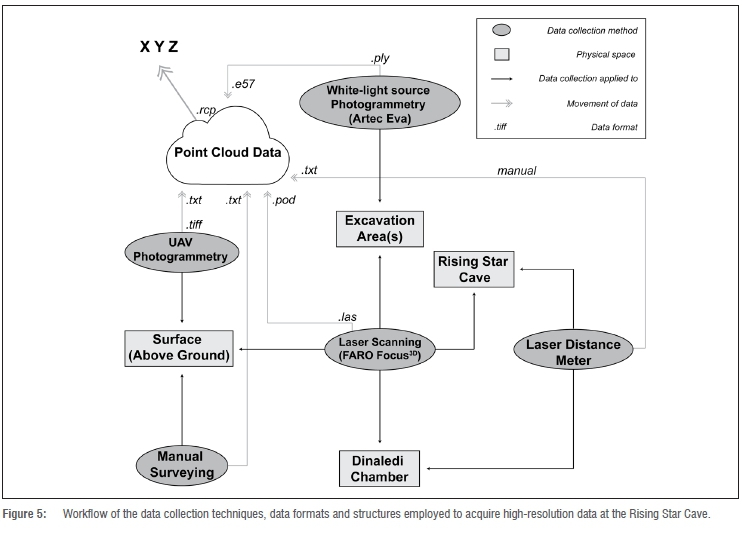
Workflow for three-dimensional data
An integral part of combining the many different formats and scan data presented in this paper was ensuring a centralised and common data structure for conversion. In this case, point cloud data served as an amenable arrangement for data processing, as sets of local, global or arbitrary coordinates could be used to tie data sets together. In addition, a number of different data formats such as .txt, .xyz, .e57, .pod or .rcp can be configured as point cloud data.
A workflow was introduced to handle all the data collected from the excavations and surveys of the Dinaledi Chamber and Rising Star Cave (Figure 5). As noted previously, scan data using the Artec Eva white-light source photogrammetry were processed and rendered in Artec studio. Once the final scan of each layer of excavations was completed and ready for export, a positioning tool was used to set the horizontal plane of the surface. These data were exported to the .e57 file format and imported into AutoDesk Recap as a Recap project (.rcp). Now comprising point cloud data, these data were then given arbitrary, local position coordinates. Coordinates were all set to millimeters and the origin of the coordinates was set to a feature in the cave. This process allowed the excavation area, as well as features and fossil material in the Dinaledi Chamber, to be located and expressed as points, each one with an x, y and z coordinate. By simply selecting a point in Recap, the x, y and z coordinate for a specific point is shown, and the data recorded for spatial data analyses.
Data collected with the FARO high-resolution laser scanner were exported as .pod and also imported to Recap as a .rcp project. These data were then linked to the Eva white-light source photogrammetry data by updating a point in the point cloud data, and setting it to the same coordinate as it appeared in the photogrammetry data. In this way, a point in the white-light scans would have the same coordinate x, y and z position as the same point in the laser scans. As data from the excavation area are limited to that region, and are constantly changing as excavations proceed, the linking of this data with the rest of the Dinaledi Chamber and the laser scan data, was essential for alignment and fitting of the coordinates to the larger coordinate system of the Cave's point cloud. Thus, if a point in the white-light source photogrammetry data was 'missing' (for example, a fixed marker was not scanned in a particular scan) it still had a coordinate value in the form of x, y and z.
This procedure allowed fossil material to be assigned an x, y and z value in the form of points. Each in-situ fossil was given a number of coordinates for different spatial attributes, such as proximal, distal or centre of a bone, before excavation. The layered point clouds produced from the white-light and laser scanners were then used to record the fossils' positional attributes in three dimensions while they were still in place.
Laser scan data collected inside the Rising Star Cave system were linked to the ground surface by scanning fixed markers at the entrance to the cave. These reference markers served two purposes. Firstly, they allowed the data collected above ground, by means of manual surveying and UAV photogrammetry, to be synced with data below ground for accurate location of underground features on the surface. Secondly, the reference markers provided a set coordinate system to allow new sections of the cave to be scanned and linked to the existing cave scans, thus expanding the three-dimensional knowledge of the system.
As with the other methods, the UAV photogrammetry data were converted to point cloud data and imported to Recap. Visualisation of these data is more simplified compared to the others as most of it is represented by x and z coordinates only. By locating the fixed markers at the entrance of the cave, the UAV photogrammetry point cloud data could be assigned the same coordinate system as the other systems, and the coordination of data by the various methods presented in this paper could be achieved. As the UAV captures global coordinates for its data (in the same way as GPS and ground control points are assigned GPS coordinates), it was possible to assign global (GPS) coordinates to the point cloud data, essentially assigning GPS coordinates for fossil material in the Dinaledi Chamber. However, assigning such GPS coordinates to the fossil material offered little benefit above that of assigning arbitrary points and this method was not applied. The GPS coordinate data were, however, instrumental in coordinating the manual surface surveys, in accurately locating the underground chambers, and in visualising underground features in relation to the ground surface. This visualisation is important as the positions of chambers relative to the surface, as well as their relationship to geological features above ground, may bear on how material was deposited or accumulated in the system.
Results
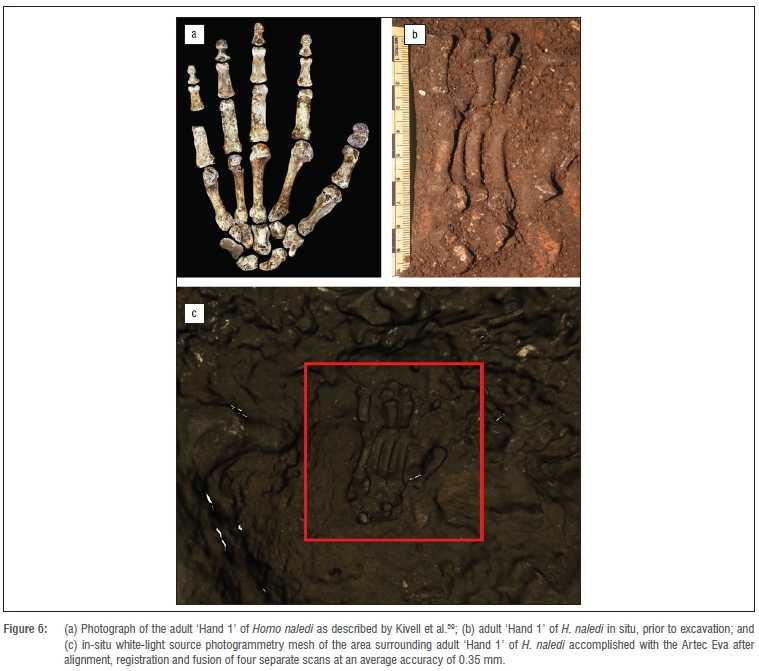
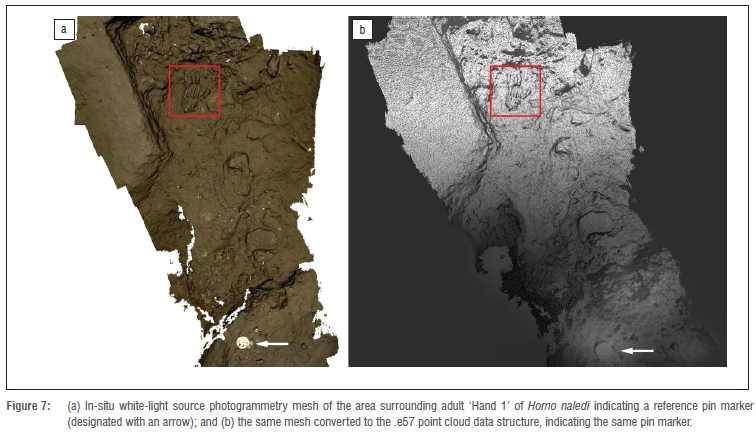
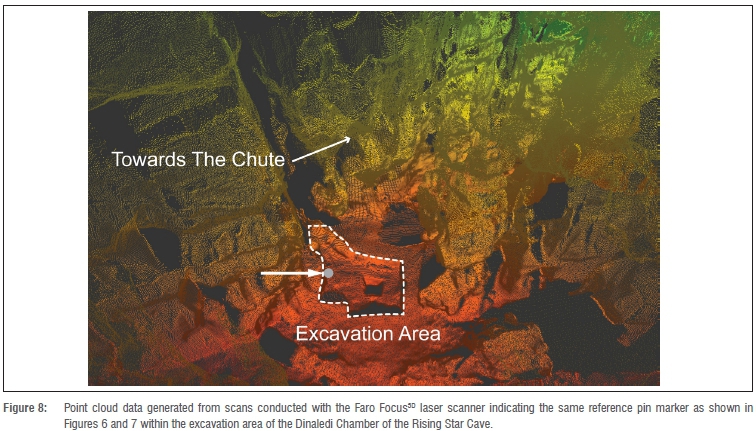
Ongoing analyses are underway to fully describe the context of each fossil element recovered from the excavations in the Dinaledi Chamber. An example of the results obtained by means of the scanning techniques presented here can be seen in Figure 6. Figure 6a is a photograph of the adult 'Hand 1' of H. naledi, as described by Kivell and colleagues39. Beside it is the hand in situ prior to excavation (Figure 6b). Figure 6c shows the in-situ white-light source photogrammetry mesh accomplished with the Eva after alignment, registration and fusion from four separate scans at an average accuracy of 0.35 mm. The location of the articulated hand is clearly visible, and its spatial context, in relation to the broader excavation area, is captured. Accurate measurements are obtainable through the Artec Studio software, including the distance (in any direction) between specimens within the excavation chamber. Figure 7a shows the broader context of 'Hand 1' in relation to the excavation area and a fixed registration marker ('Pin 2') within the Chamber Figure 8 displays one of six point cloud areas generated from the high-resolution laser scanning within the Dinaledi Chamber. As it shows, each point in this cloud has a coordinate, and the location of 'Pin 2' is indicated as in Figure 7. Multiple shared points in each of the different scanning methods allowed for scans and coordinates to be tied together. If a fixed marker within the cave was not represented in an Artec scan, its coordinates were still available in the Focus3D scans. For example, the marker assigned as 'Pin 1' is not present in Figures 6 and 7, which only covers the 'Pin 2' area. However, through the multi-method registration process, fossil material found in scans relating to 'Pin 1' can still be measured and placed in context to fossil material found in scans relating to 'Pin 2'.
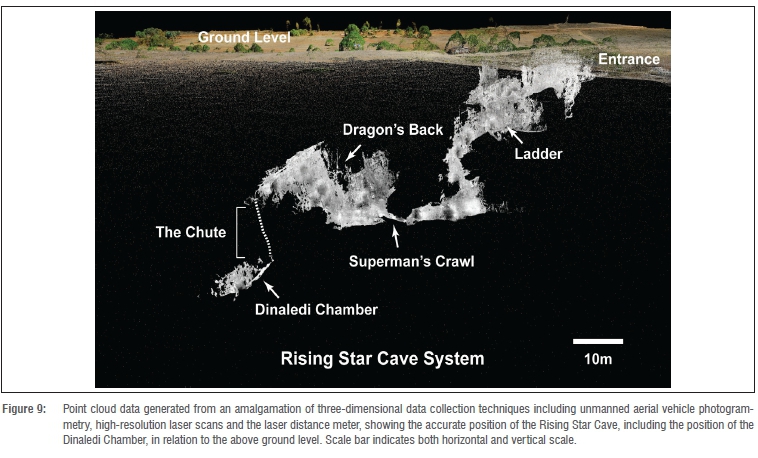
Figure 9 shows the accurate placement of the Dinaledi Chamber in relation to the ground surface in high resolution. This image combined data from the Focus3D scans and the point cloud data generated by the UAV photogrammetry and illustrates how the Dinaledi Chamber, and the fossil material recovered from it, relates to the rest of the Rising Star Cave system and the ground above.
Discussion
The multimodal approach to the acquisition of three-dimensional data as applied to palaeontology will, we hope, become commonplace, as advancements in technology continue to unfold. As methods for collaborating these data also advance, it would be fortuitous to incorporate these methods into new and existing fieldwork at fossil and archaeological sites. As three-dimensional modelling processes improve, post-processing of extremely large data sets will become much more efficient and less time consuming. At this stage, the requirements for three-dimensional data processing are extremely expensive - in terms of monetary output and processing power and time - and are thus not always attainable. As the advancement of three-dimensional scanners continues, the cost will undoubtedly become more affordable and such equipment will earn its place in archaeological and palaeontological tool kits.
Strengths and limitations of each scanning method
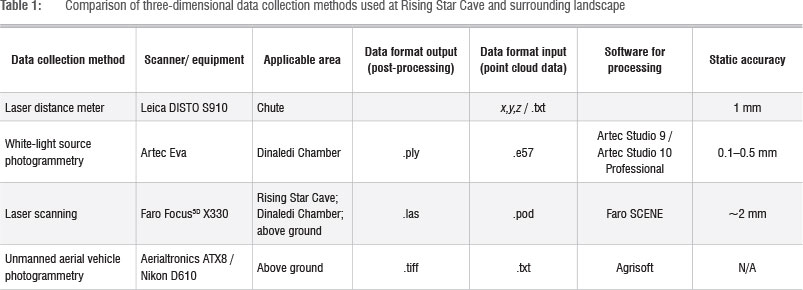
Table 1 highlights the relative format and precision (static accuracy) of each method utilised in the three-dimensional data collection at Rising Star. However, in practice, it was found that each recovery method had a series of inherent strengths and weaknesses in in-field recovery, post-hoc processing, or subsequent data analysis and presentation. The strengths and limitations of the Artec Eva and the FARO Focus3D systems are discussed below.
Artec Eva white-light scanner
Although the small, handheld Artec Eva is a more than adequate scanning device for medium-sized objects (e.g. a human skull), the work resolution and static accuracy is inadequate for rendering smaller objects. For example, isolated human teeth and small fossil fragments were exceptionally hard to visualise in the post-processing stage as they simply did not stand out against the sedimentary 'background'. In addition, the Eva is challenged when presented with right angles, such as the edges of the excavation pit. This inadequacy led to missing data in these areas. The accompanying laptop computer was both a hindrance and an aid during excavations at Rising Star. Because the laptop required an active power source, the Eva unit was unable to operate independently. In addition, the power cabling had to be run into the excavation chamber from the surface because a generator could not be brought into the cave. However, the live display of the scanning area that the laptop provided, allowed the person scanning to make sure the areas or objects scanned were captured correctly. The minimum working distance for the Eva (approximately 400 mm) meant that extremely tight spaces, such as that of the Chute, could not be scanned with this method. The Eva is relatively expensive and perhaps not financially viable for all researchers; however, it is a useful and powerful scanner ideal for creating three-dimensional models of large surfaces as well as smaller objects, not only in the field but also in the laboratory. Rendering larger models takes considerable time, much of which is determined by the computer and graphical processing power at hand.
FARO Focus3D laser scanner
The FARO Focus3D has its own power source, and a replaceable battery pack should extra power be needed. Independent power made for easier scanning in the cave and Dinaledi Chamber, as no cords or cabling were required and the power pack provided power for a substantial period of time. In addition, all data were recorded onto a secure digital (SD) memory card, further reducing its bulk. The Focus3D, however, relies on the use of multiple spheres for registration in the post-processing stage. These spheres are relatively expensive and fragile, which is not ideal in a cave environment. In addition, the requirement for multiple spheres to be visualised in more than one scan presented significant challenges for placement within the tight confines of the cave. The Focus3D is larger than the Eva and requires a tripod and platform in order to conduct its scans. However, its size did not hinder its transportation through the cave, and the tripod-platform assembly was detachable. The need for a line-of-sight connection between the spheres meant that the Focus3D was still incapable of scanning the Chute and x, y and z data for this section of the cave had to be captured with the DISTO S910. This meant that high-resolution data were acquired for the entire path to the Dinaledi Chamber, with the exception of the Chute. The Focus3D is exceptionally expensive, and is usually rented out for a prescribed number of days. Rending the resulting point cloud from scans is remarkably quick.
Combining different survey and recording modalities: A way forward
The large amounts of data collected with the methods presented in this paper, will serve to answer a number of key questions around the formation of the site (UW-101) at Rising Star and the deposition of the material found within the Dinaledi Chamber. Laser scanning has been used successfully in many archaeological sites for GIS12,13 and heritage preservation5,9,10,17. Work conducted at Wonderwerk Cave in the Northern Cape Province of South Africa by Rüther and colleagues17 shows the extent to which laser scan data can be useful. The main aims of this project were to collect data for the 'African Cultural Heritage and Landscape Database' - a database of information for heritage preservation. Non-contact laser and photogrammetric recovery methods served as an ideal form of data collection as the process is exceptionally rapid, and the data set compiled from it can be used for a variety of other uses, including scientific ones. The data from this project were found to be useful for three-dimensional grid plotting, three-dimensional mapping and the reconstructions of lithic, faunal, botanical and geological associations.17 As with the work carried out at Rising Star, and the Dinaledi Chamber, the data collected with laser scanning have allowed the creation of a three-dimensional map of the cave system and three-dimensional grid plotting (should it be necessary) and will be used in the mapping of natural and geological features occurring in the Rising Star Cave and their association to features above ground. Accurate placement of the cave system in relation to the ground above it will allow for other technologies to be used on the surface, including ground penetrating radar and geological magnetics studies. We will report on these developments in due course.
Acknowledgements
We acknowledge the following for providing funding: DST-NRF Centre of Excellence in Palaeosciences; Lee R Berger Foundation for Exploration; Lyda Hill Foundation; National Geographic Society; National Research Foundation (South Africa); and University of the Witwatersrand. We thank R. Hunter, S. Tucker, D. van Rooyen, W. Crichton, M. Ramalepa and M. Hlophe for assistance in the field during data collection. We thank R. Hugo for his assistance with operating and training of the FARO Focus3D, innovative solutions to positioning calibration spheres and modifying tripods, as well as his dedication to this project. We also thank Group Five Survey Department for the loan of the FARO Focus3D and Aerialtronics ATX8, and processing of laser scan and UAV photogrammetry data.
Authors' contributions
A.K. conducted the research and wrote the original draft of the manuscript. PR-Q. supervised and developed the original recovery protocols. M.E. supervised the infield recovery of three-dimensional data. All authors contributed equally to manuscript rewrites and editing.
References
1. Hunter J, Cox M. Forensic archaeology: Advances in theory and practice. London: Routledge; 2005. [ Links ]
2. Assefa Z, Pleurdeau D, Duquesnoy F, Hovers E, Pearson O, Asrat A, et al. Survey and explorations of caves in southeastern Ethiopia: Middle Stone Age and Later Stone Age archaeology and Holocene rock art. Quatern Int. 2014;343:136-147. http://dx.doi.org/10.1016/j.quaint.2013.07.132 [ Links ]
3. Carvalho M, Fernández S, Pujia L, Rocha C, Rodríguez C, Zelli F. Architecture, archaeology and landscape: An interdisciplinary educational experience in archaeological sites. Procedia Chem. 2013;8:292-301. http://dx.doi.org/10.1016/j.proche.2013.03.036 [ Links ]
4. Elliott WR. Cave exploration and mapping in the Sierra de El Abra Region. In: Keene AC, Yoshizawa M, McGaugh SE, editors. Biology and evolution of the Mexican Cavefish. Cambridge, MA: Academic Press; 2016. p. 9-40. http://dx.doi.org/10.1016/B978-0-12-802148-4.00001-3 [ Links ]
5. Puchol OG, McClure SB, Blasco Senabre J, Cotino Villa F, Porcelli V. Increasing contextual information by merging existing archaeological data with state of the art laser scanning in the prehistoric funerary deposit of Pastora Cave, Eastern Spain. J Archaeol Sci. 2013;40(3):1593-1601. http://dx.doi.org/10.1016/j.jas.2012.10.015 [ Links ]
6. Geiling JM, Marin-Arroyo AB. Spatial distribution analysis of the Lower Magdalenian human burial in El Mirón Cave (Cantabria, Spain). J Archaeol Sci. 2015;60:47-56. http://dx.doi.org/10.1016/j.jas.2015.03.005 [ Links ]
7. Gopher A, Parush Y Assaf E, Barkai R. Spatial aspects as seen from a density analysis of lithics at Middle Pleistocene Qesem Cave: Preliminary results and observations. Quatern Int. 2016;398:103-117. http://dx.doi.org/10.1016/j.quaint.2015.09.078 [ Links ]
8. Joukowsky MS. Survey and excavation (field methods) in archaeology. In: Wright, JD, editor. International encyclopedia of the social & behavioral sciences. 2nd ed. Oxford: Elsevier; 2015. p. 742-746. http://dx.doi.org/10.1016/B978-0-08-097086-8.13052-1 [ Links ]
9. Leonov AV Anikushkin MN, Bobkov AE, Rys IV Kozlikin MB, Shunkov MV et al. Development of a virtual 3D model of Denisova Cave in the Altai Mountains. Archaeol Ethnol Anthropol Eurasia. 2014;42(3):14-20. http://dx.doi.org/10.1016/j.aeae.2015.04.003 [ Links ]
10. Lerma J, Navarro S, Cabrelles M, Villaverde V. Terrestrial laser scanning and close range photogrammetry for 3D archaeological documentation: The Upper Palaeolithic Cave of Parpalló as a case study. J Archaeol Sci. 2010;37:499-507. http://dx.doi.org/10.1016/j.jas.2009.10.011 [ Links ]
11. Melnikova N, Orlov S, Shabrov N, Kiev V Kuzin A, Resch M, et al. CAVE 3D: software extensions for scientific visualization of large-scale models. Procedia Comp Sci. 2015;66:679-688. http://dx.doi.org/10.1016/j.procs.2015.11.077 [ Links ]
12. Neruda P. GIS analysis of the spatial distribution of Middle Palaeolithic artefacts in Kfilna Cave (Czech Republic). Quatern Int. In press 2015. http://dx.doi.org/10.1016/j.quaint.2015.10.028 [ Links ]
13. Nigro J, Ungar P, De Ruiter D, Berger L. Developing a geographic information system (GIS) for mapping and analysing fossil deposits at Swartkrans, Gauteng Province, South Africa. J Archaeol Sci. 2003;30:317-324. http://dx.doi.org/10.1006/jasc.2002.0839 [ Links ]
14. Núñez M, Buill F, Edo M. 3D model of the Can Sadurni cave. J Archaeol Sci. 2013;40:4420-4428. http://dx.doi.org/10.1016/j.jas.2013.07.006 [ Links ]
15. Olivares M, Castro K, Corchón M, Gárate D, Murelaga X, Sarmiento A, et al. Non-invasive portable instrumentation to study Palaeolithic rock paintings: The case of La Pena Cave in San Roman de Candamo (Asturias, Spain). J Archaeol Sci. 2013;40:1354-1360. http://dx.doi.org/10.1016/j.jas.2012.10.008 [ Links ]
16. Robu M. The assessment of the internal architecture of an MIS 3 cave bear bone assemblage. Case study: Ursjlor Cave, Western Carpathians, Romania. Palaeogr Palaeoclimatol Palaeoecol. 2016;444:115-123. http://dx.doi.org/10.1016/j.palaeo.2015.12.012 [ Links ]
17. Rüther H, Chazan M, Schroeder R, Neeser R, Held C, Walker SJ, et al. Laser scanning for conservation and research of African cultural heritage sites: The case study of Wonderwerk Cave, South Africa. J Archaeol Sci. 2009;36(9):1847-1856. http://dx.doi.org/10.1016/j.jas.2009.04.012 [ Links ]
18. Sellers W, Chamberlain A. Ultrasonic cave mapping. J Archaeol Sci. 1998;25:867-873. http://dx.doi.org/10.1006/jasc.1997.0232 [ Links ]
19. Sellers W, Orton R, Chamberlain A. Computer-aided visualisation of archaeological caves [archive on the Internet]. c2001 [cited 2002 Aug 30]. Available from: http://capra.group.shef.ac.uk/3/sellars.html [ Links ]
20. Stephens M. Cave archaeology and karst geomorphology of Northwest England. In: O'Regan HJ, Faulkner T, Smith IR, editors. Proceedings of the Geologists' Association. 2014;125(3):359-360. [ Links ]
21. Kuman K. The archaeology of Sterkfontein - Past and present. J Hum Evol. 1994;27:471-495. http://dx.doi.org/10.1006/jhev.1994.1065 [ Links ]
22. Kuman K, Clarke RJ. Stratigraphy, artefact industries and hominid associations for Sterkfontein, Member 5. J Hum Evol. 2000;38:827-847. http://dx.doi.org/10.1006/jhev.1999.0392 [ Links ]
23. Mason RJ. The prehistory of the Transvaal. Johannesburg: Witwatersrand University Press; 1962. [ Links ]
24. Mason RJ. Cave of Hearths, Makapansgat, Transvaal. Johannesburg: Archaeological Research Unit, University of the Witwatersrand; 1983. [ Links ]
25. Clarke RJ. First ever discovery of a well-preserved skull and associated skeleton of Australopithecus. S Afr J Sci. 1998;94:460-463. [ Links ]
26. Latham AG, Herries A, Quinney PS, Sinclair A, Kuykendall K. The Makapansgat australopithecine site from a speleological perspective. In: Pollard AM, editor. Geoarchaeology: Exploration, environments, resources. London: Geological Society; 1999. p. 61-77. http://dx.doi.org/10.1144/GSL.SP.1999.165.01.05 [ Links ]
27. McNabb J, Sinclair A, Quinney PS. Recent investigations into the Later Acheulean of Makapansgat Region, Northern Province, South Africa. In: Moloney N, Shott MJ, editors. Lithic analysis at the millennium. London: Institute of Archaeology, UCL; 2003. p. 1-16. [ Links ]
28. Lacruz RS, Brink JS, Hancox PJ, Skinner AR, Herries A, Schmid P, et al. Palaeontology and geological context of a Middle Pleistocene faunal assemblage from the Gladysvale Cave, South Africa. Palaeontol Afr. 2002;38:99-114. [ Links ]
29. Stratford D. Cave excavation: Some methodological and interpretive considerations. Cave Karst Sci. 2011;38(3):111-116. [ Links ]
30. Stratford D, Grab S, Pickering TR. The stratigraphy and formation history of fossil- and artefact-bearing sediments in the Milner Hall, Sterkfontein Cave, South Africa: New interpretations and implications for palaeoanthropology and archaeology. J Afr Earth Sci. 2014;96:155-167. http://dx.doi.org/10.1016/j.jafrearsci.2014.04.002 [ Links ]
31. Subsol G, Moreno B, Jessel J, Braga J, Bruxelles L, Thackeray F, et al. In situ 3D digitization of the 'Little Foot' Australopithecus skeleton from Sterkfontein. Paleoanthropology. 2015:44-53. [ Links ]
32. Birkenfeld M, Avery MD, Horwitz LK. GIS virtual reconstructions of the temporal and spatial relations of fossil deposits at Wonderwerk Cave (South Africa). Afr Archaeol Rev. 2015;32(4):857-876. http://dx.doi.org/10.1007/s10437-015-9209-4 [ Links ]
33. Berger LR, Hawks J, De Ruiter DJ, Churchill SE, Schmid P, Delezene LK, et al. Homo naledi, a new species of the genus Homo from the Dinaledi Chamber South Africa. eLife. 2015;4, e09560, 35 pages. http://dx.doi.org/10.7554/eLife.09560 [ Links ]
34. Dirks PHGM, Berger LR, Roberts EM, Kramers JD, Hawks J, Randolph-Quinney PS, et al. Geological and taphonomic context for the new hominin species Homo naledi from the Dinaledi Chamber, South Africa. eLife. 2015;4, e09561, 37 pages. http://dx.doi.org/10.7554/eLife.09561 [ Links ]
35. Randolph-Quinney PS. A new star rising: Biology and mortuary behaviour of Homo naledi. S Afr J Sci. 2015;111(9/10), Art. #a0122, 4 pages. http://dx.doi.org/10.17159/sajs.2015/a0122 [ Links ]
36. Randolph-Quinney PS. The mournful ape: Conflating expression and meaning in the mortuary behaviour of Homo naledi. S Afr J Sci. 2015;111(11/12), Art. #a0131, 5 pages. http://dx.doi.org/10.17159/sajs.2015/a0131 [ Links ]
37. Dirks P, Berger L. Hominin-bearing caves and landscape dynamics in the Cradle of Humankind, South Africa. J Afr Earth Sci. 2012;78:109-131. http://dx.doi.org/10.1016/j.jafrearsci.2012.09.012 [ Links ]
38. Huber D. The ASTM E57 file format for 3D imaging data exchange. In: Beraldin JA, Cheok GS, McCarthy MB, Neuschaefer-Rube U, Baskurt AM, McDowall IE, et al., editors. Proceedings of SPIE 7864: Three-Dimensional Imaging, Interaction, and Measurement; 2011 January 24-27; San Francisco, CA, UsA. Bellingham, WA and Springfield, VA: SPIE and IS&T-The Society for Imaging Science and Technology; 2011. http://dx.doi.org/10.1117/12.876555 [ Links ]
39. Kivell TL, Deane AS, Tocheri MW, Orr CM, Schmid P Hawks J, et al. The hand of Homo naledi. Nature Commun. 2015;6, Art. #8431, 9 pages. http://dx.doi.org/10.1038/ncomms9431 [ Links ]
 Correspondence:
Ashley Kruger
Evolutionary Studies Institute, School of Geosciences
University of the Witwatersrand
Private Bag 3, Wits 2050
South Africa
Email: ashleykruger@gmail.com
Received: 29 Jan. 2016
Revised: 18 Mar. 2016
Accepted: 09 Apr. 2016
* Current address: School of Forensic and Applied Sciences, University of Central Lancashire, Preston, Lancashire, United Kingdom

