


Servicios Personalizados
Articulo
 Inglés (pdf)
 Articulo en XML
 Referencias del artículo
Indicadores

Links relacionados
-
 Citado por Google
 -
 Similares en Google
Compartir

 Permalink
South African Journal of Science
versión On-line ISSN 1996-7489
versión impresa ISSN 0038-2353
S. Afr. j. sci. vol.112 no.5-6 Pretoria may./jun. 2016
http://dx.doi.org/10.17159/sajs.2016/20150119
RESEARCH ARTICLE
Two-dimensional mapping of scientific production of nations in the fields of physics and astronomy
Seyyed Mehdi Hosseini Jenab
Centre for Space Research, Faculty of Natural Sciences, North-West University, Potchefstroom, South Africa
ABSTRACT
The quantity and quality of scientific production in the fields of physics and astronomy over a period of 16 years (1996-2012) was studied. The level of analysis was national, with the scientific output of 108 countries being analysed. The measurement unit was the number of papers published in peer-reviewed journals, as listed on the Scopus database. Modified versions of the number of publications (Pm) and citations (Cm) were employed as indicators of quantity and quality, respectively. A two-dimensional method, the Pm-Cm diagram, was adopted to provide a coherent and simultaneous approach to study the positions, rankings, and temporal evolution of countries in the global context. A static approach to studying the Pm-Cm diagram resulted in countries being grouped into five main categories based on average positions. A dynamic approach to analysing the Pm-Cm diagram also resulted in five groups (i.e. when considering the temporal evolution patterns of the countries during the studied years). The rank and temporal-evolution group associated with each country are listed in two tables in this paper. These tables, together with the Pm-Cm diagrams (showing different scales) present a general view of the scientific activity in the field of physics and astronomy for each country. This methodology allows each country's output to be compared with that of other countries or the world average.
Keywords: national-level analysis; quality; quantity; ranking; scientometrics
Introduction
Scientometrics is the systematic measurement of science, or more precisely, a method of objectively measuring scientific activity. This approach was pioneered by the American psychologist James McKeen Cattell in 1906, when the first edition of the American Men of Science was published. Cattell stated that 'There is here given for the first time a fairly complete survey of the scientific activity of a country at a given period'.1 In scientometrics, contemporary researchers in North America are ranked and their output is statistically analysed based on productivity and merit.2,3
After the Second World War, two main organisations began to analyse and measure the scientific activity of the industrial world. These were the US National Science Foundation (NSF) in the 1950s, and intergovernmental organisations such as the Organization for Economic Co-operation and Development (OECD) in the 1960s. Their analyses were important for countries to show their development.4 This concern was expressed in the OECD report of 1963 as follows:
... the strength, progress and prestige of countries are today measured in part by their achievements in S&T [science and technology], scientific excellence is more and more becoming an important national goal. National resources are therefore increasingly devoted in research and development.5
In 1960, Eugene Garfield started a systematic archive of scientific activity. He founded the well-known Institute for Scientific Information (ISI), which specialised in indexing scientific papers and their citations in peer-reviewed journals. Since then, enormous effort has been dedicated to developing methods for ranking and analysing scientific activity at various levels, namely the individual, group, university, and national levels. Much of this effort, especially recently - owing to easier access to bibliometric data - has been focused on introducing indicators for measuring various aspects of scientific activity. Such measures include excellence, impact, quality, quantity, effectiveness of the process, and even economical value ('return on investment' or ROI). Rostaing states that 'The goal in our days is to create indicators that assess research activity, measure research actors' productivity and their strategic position'.6
The definitions and measuring techniques for assessing various aspects of scientific activity remain a challenge. Nonetheless, the most important and common aspects of scientific activity, which have been widely studied, include the quality and quantity of scientific production. The most typical and tangible measure of scientific production refers to outputs such as papers, patents, or offshoot technologies. These measures are especially pertinent when considering science and technology (S&T) activity at the national level.7
The number of publications, as an index of quantity, was one the early indicators introduced in scientometrics. Modified adaptations of this measure have been presented for the different levels.8 However, considering the number of publications individually means assessing only one aspect of scientific activity, which results in a relatively simplistic understanding. Hence a few techniques have been introduced and developed to present a broader view of scientific production, by combining or adding other aspects - especially quality - to the indicator. Vinkler has discussed some of these modifications as 'composite indicators'.9
A well-known index of this kind on the individual level was introduced by J.E. Hirsch.10 Hirsch combined both quantity and quality indicators, namely the number of papers and number of citations respectively, for a single researcher The resulting score was termed the 'H-index'. The two main aspects are often shown in a two-dimensional diagram called the H-index diagram. Although the H-index is relatively new, it has been so successful that nowadays it is used officially in assessing individual researchers in some countries. Databases such as Scopus and ISI provide it as the main index for authors of scientific papers. Since its introduction, a prolific sequence of customised versions of the H-index have also been introduced, such as the G-index11 and the 'H-index for journals'12. Variations of the H-index have been compared by Bornmann et al.13 In defiance of its initial definition, the H-index has been employed in studying and ranking other levels of scientific activity, such as countries.7
By its nature, the H-index is a static indicator that ignores the temporal evolution of scientific activity, and the H-index associated with a researcher or country cannot be reduced. In other words, an H-index value will stay the same even if the researcher's career or the country's scientific activity declines or stops altogether.14
The time evolution of scientific activity should be considered. As the work of Radicchi15 on individual physicists showed, rankings that take account of time evolution differ from those that are obtained from the H-index alone.
Two-dimensional diagrams have been employed in various fields, for example the well-known Carnot cycle in thermodynamics, as proposed by Sadi Carnot in 1824. This kind of diagram provides an inclusive understanding of two aspects of a specific topic, while preserving the chronological order of events. In the case of the Carnot cycle, volume and pressure are presented in a PV diagram.
We studied the further development of H-index diagrams to represent the national level, based on a two-dimensional method. The resulting diagrams showed the coherent and simultaneous temporal evolution of two aspects of the work of a country, namely the quantity and quality of its science.16 We chose to consider scientific production at the national level in fundamental areas of science - physics and astronomy - because of the role these fields play as a driving force of scientific activity. In the modern era of big science, physics and astronomy receive large amounts of funding and hence acquire large numbers of researchers. This range of activity renders these fields a good example for our study because statistical data are available for many countries. Furthermore, physics and astronomy, as two main fields in science, may reflect the overall scientific activity of the studied countries in general. However, the results of our study should be cautiously interpreted and are not necessarily generalizable to other scientific activity.
The quality of scientific activity is regarded as a complex and to some extent ambiguous concept to define. The most common measure is that of the number of citations. This measure is widely accepted as an indicator of the quality of scientific production, that is, the 'quality' criterion for scientific activity.17-19 In the period we studied, 1996-2012, papers had been published in the fields of physics and astronomy in peer-reviewed journals by 108 countries worldwide. The peer-reviewed journals were indexed in Scopus. Hence, although only 108 counties are considered here, the data represent the entire world's scientific activity in physics and astronomy during the studied period.
According to Macilwain20, 'Science has been invested even during the last economic recession as part of stimulus packages designed to aid troubled economies around the globe'. Understanding patterns of quality and quantity in scientific activity at the national level plays an important role in countries' investment in science. The struggle to maintain a balance between these two aspects has been a great issue for policy-makers and scientific advisors around the world. Most countries, especially in the early stage of scientific development, focus their resources on increasing the quantity of scientific activity, which leads to an unbalanced pattern of quantity versus quality. These countries emphasise an increase in quality indicators, which is coined 'poor Scientometrics' by Van Raan21. A two-dimensional approach contributes a more comprehensive perspective on countries' patterns of scientific activity in terms of the balance between quality and quantity. This can also help in understanding their relative positions compared to each other and to the world as a whole.
Method
We selected as the 'quantity' indicator the number of publications in peer-reviewed journals, represented here as P(yj: cj). In this term, y and cjstand for year and country respectively. Index i for yi (year) runs from 1 to 16, presuming y1 = 1996 and y16=2012 . Index j in cj(country) varies from 1 to 108, as 108 countries featured in our study. We ordered them alphabetically, hence c1=Albania and c108=Yemen . For example, in 2010, China published P(2010,China)=P(y14,c18)=27700 papers.
The number of citations is considered the 'quality' indicator, and is represented by C(yj-y16,ci). Note that a citation window spans from the year of publication until the final year of our study period, that is y16=2012. For instance, publications by China in 2010 received C(2010-2012,China)=C(y14-y16,c18)=116143 citations.
The global growth in the number of publications during the studied period makes a comparison of publication numbers misleading, especially considering the ranking of countries. However, we can also compare the number of publications of a country to the world average by introducing a modified formula, as follows:
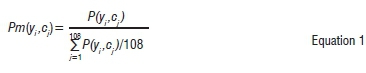
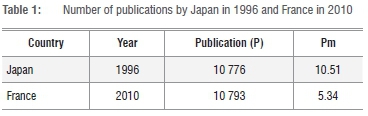
The numbers belonging to different years will have the same meaning, and can have the same value as they refer to the world average. For instance, comparing the number of publications of Japan in 1996, that is P(y1,c47)=10776, with the number of publications of France in 2010, that is P(y14,c32)=10793, one might conclude that both these countries attained the same level for quantity in scientific activity. But the global intensity of scientific activity in the fields of physics and astronomy differed considerably between 1996 and 2010. In other words, these two numbers belong to different contexts. Scaled to the world average of the respective years, France in 2010 produced Pm(y14,c32)=5.34 times the world average, whereas Japan in 1996 published Pm(y1,c47)=10.51 times the world average. Consequently, using the Pm measure, the quantity of scientific activity of Japan in 1996 was twice that of France in 2010 (see Table 1 below).
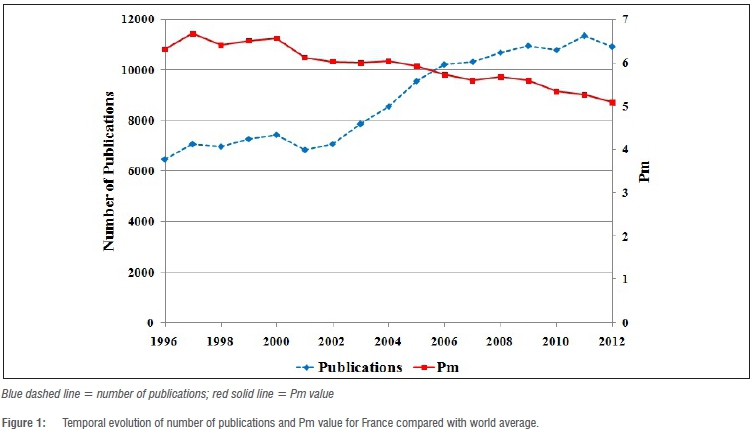
Temporal evolution should be placed in the context of the world average, even if only one country is analysed. For instance, France increased its number of annual publications during the study period, almost doubling its output from 6475 to 10924. However, when these numbers are compared with the world average, the position of France has actually declined, with its Pm dropping from Pm(y1,c32)=6.32 to Pm(y16,c32)=5.08 (see Figure 1).
The same logic justifies the application of a modified number of citations, as defined below.
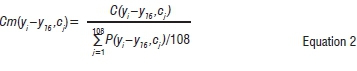
There is a gap between the year of publication of a paper and the point at which it has been cited enough times to achieve statistical saturation for citations. This lag period lasts roughly 3 to 5 years.22 There is also a downward trend, over time, for the number of citations of a published study. These two patterns distort the temporal evolution lines of countries. The number that results from a comparison with the world average (Cm) can remove these effects, which is another reason to use Cm instead of the number of citations.22
To produce the diagram, each country's pair number (Pm,Cm) for every year is shown by a dot on the diagram. The Pm and Cm values are represented on the vertical and horizontal axes respectively. By connecting these dots based on chronological order, the temporal evolution line of a country can be drawn. The data needed for this study were obtained from the SCImago Journal & Country Rank portal,23 which provides Scopus data arranged according to country, branch of science, and year.
Results and discussion
Logarithmic scale diagram
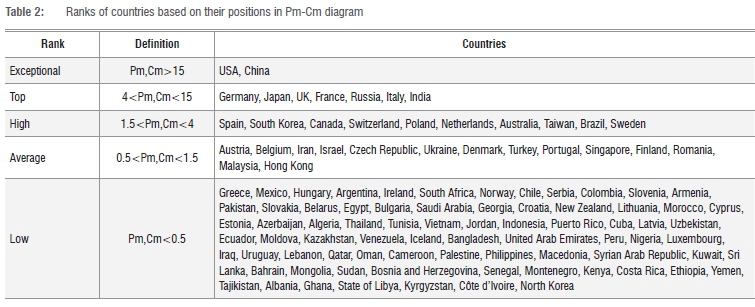
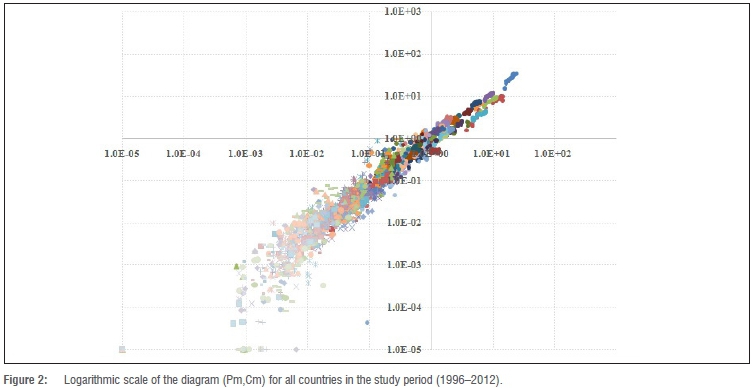
Figure 2 shows a two-dimensional diagram of all countries in logarithmic scale, to provide a holistic and integrated view of the world's scientific activity pattern in the fields of physics and astronomy. A striking difference among countries with regard to scientific activity is evident. The figure shows that countries do not cluster around the average value of Pm=Cm=1, but rather a few countries cluster around the average points and most countries fall in the low-rank area of (Pm,Cm)<0.5 (see Table 2).
Activity
Three main areas can be distinguished in the Pm-Cm diagram:
• lower than average: Pm,Cm<0.5
• average: 0.5<Pm,Cm<1.5
• higher than average: 1.5<Pm,Cm
In the last area, three subgroups can be detected based on clusters they have formed, by considering their average position. The definition and borders of these above-average subgroups are to some extent arbitrary, because by changing the time-span of the study the clusters might be altered. Consequently, countries are divided into five ranks of activity level. Table 2 below presents the results of this categorising, with the names of countries written in order based on their average positions. Countries at the bottom or top of a ranking list should be seen as falling between two ranks (i.e. borderline). In the case of countries that have shown a pattern of either great decline or great progress, the last three years of their temporal evolution was considered when ranking them.
In the following section, each category is discussed and analysed, and diagrams (drawn to appropriate scale) are presented in Figures 3 to 7.
Exceptional activity: USA and China
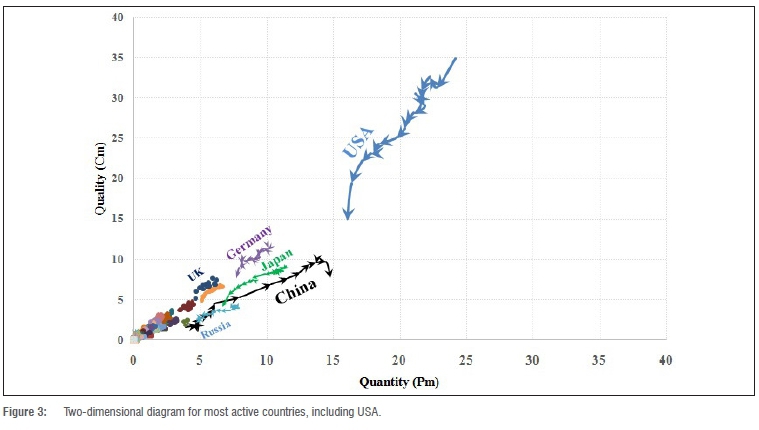
For years, USA has held the position of being by far the most active nation in physics and astronomy. However, the picture is changing, and because of the recent growth in scientific activity across the world, the output of USA now shows a rapid decline. By contrast, China is showing rapid progress and a high level of activity, and seems likely to catch up with USA in the next five years. The USA has been warned about this by senior scientists from US National Academies.24 These two countries currently stand out from other nations because of their exceptional level of activity - almost 15 times more than the global average (see Figure 3).
Top active countries
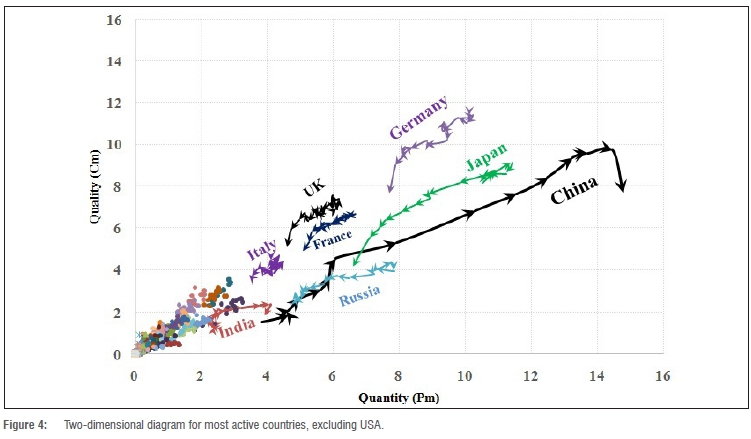
Figure 4 shows the rankings of the seven most active countries, defined as 4<(Pm,Cm)<15. All except India show a decline pattern as a result of the global growth in scientific activity. China is shown in the figure for the sake of comparison. The second fastest decline after USA is noted for Japan, which clearly has lost its position in comparison with China and even Germany.
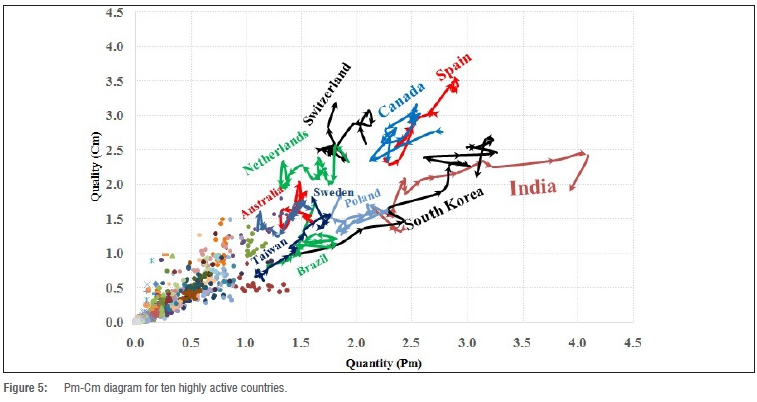
Countries with high activity
The third category consisted of ten countries labelled as having a 'high' activity level. These countries are shown in Figure 5, with India (a 'top' country) included for the sake of comparison. Four countries, mostly new-emerging economies, show a growth pattern - that is, Korea, Spain, Taiwan, and Brazil.
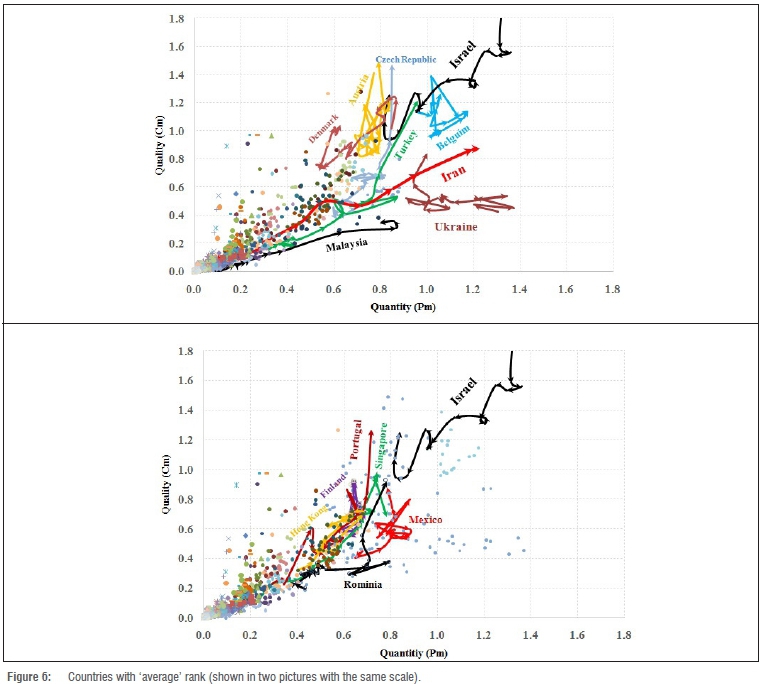
Countries with average activity
Twelve counties with 'average' activity are shown in Figure 6. Two separate figures are presented to minimise the complexity and confusion that arises from temporal evolution lines crossing each other. The rapid growth of Iran, Turkey, and Malaysia are clearly visible, as well as a steep decline for Israel.
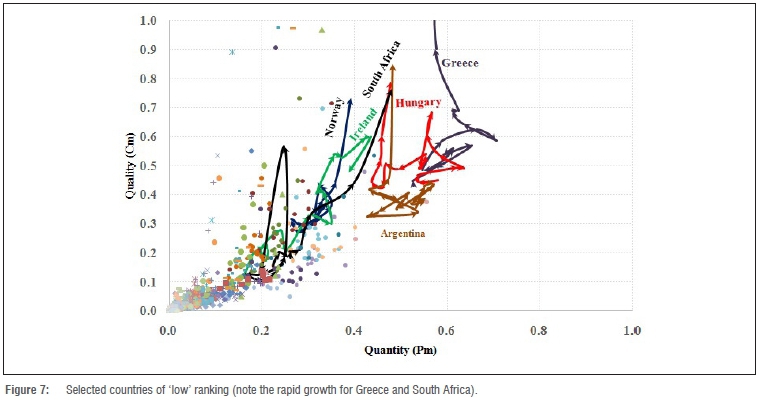
Countries with low activity
Most of the countries in this study, namely 74 countries (representing 68% of the included countries) were categorised as having a 'low' level of activity. This means their activity fell below half of the world average for the studied period. However, certain countries in this group have shown great improvement and fall on the border between 'low' and 'average' rankings.
South Africa and Greece, for example, are catching up with the 'average' countries in physics and astronomy (see Figure 7 and Table 2).
Temporal evolution
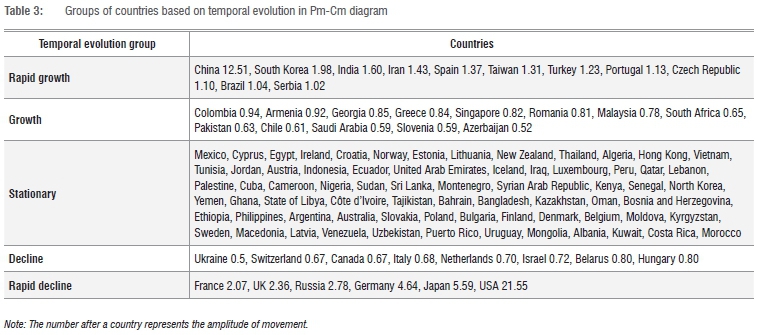
Categories of temporal evolution
With regard to temporal evolution, countries usually show one of three main patterns: growth, decline, or stasis (stationary). Countries showing a decline or growth pattern are divided into two subgroups each, based on the amplitude of their movement in the Pm-Cm diagram, which is basically defined as the distance between a country's averaged initial and final positions. Hence in temporal terms, countries are divided into five groups as shown in Table 3. Many countries are labelled as stationary because they have negligible movement (i.e. the distance between their averaged initial and final positions is less than 0.5).
China possesses the largest amplitude, and is by far the fastest-growing country in the fields of physics and astronomy. But although China shows the most rapid growth in the studied period (see Table 3), the Pm-Cm diagram reveals a deviation toward quantity when China is compared with other countries in the 'top' category. The same bias is evident when China's pattern is compared with the line that represents the world's average temporal evolution line - which runs at a 45° angle (see Figure 2). The other rapidly-growing countries are represented by amplitude in Table 3, with their temporal evolution shown in Figures 3 to 6.
The USA and most other developed countries fall into the groups labeled 'decline' or 'rapid decline'. The USA possesses the largest amplitude, and stands out as by far the fastest-declining country in the fields of physics and astronomy. However, considering Figure 1, it remains ahead of all other nations.
Changing rankings
A few countries having growth patterns have managed to change their ranks in the diagram. This can be clearly witnessed by analysing their positions in the early years versus recent years of the studied period. The countries that have managed to improve their rankings are as follow:
1. From high to exceptional: China
2. From high to top: India
3. From average to high: Brazil, Taiwan
4. From low to average: Turkey, Iran, and Malaysia
No country dropped in ranking during the studied years, although a few countries moved from the upper area of a category to the lower area. In the coming years, such countries might drop down to a lower category.
Conclusion
Pm-Cm diagrams were produced by employing a two-dimensional method. The results were analysed based on two approaches, namely static and dynamic analyses. Countries were divided into five ranks according to their positions, using the static approach. They were also divided into five groups based on their temporal evolution patterns, using the dynamic approach. For each country, the rank and temporal group (see Tables 2 and 3) allowed a comparison of that country's scientific activity in the fields of physics and astronomy with that of the world - or with any other country or group of countries.
A discussion about the scientific activity of a few countries with notable temporal evolution was presented together with the Pm-Cm diagrams (Figures 3 to 7) drawn to appropriate scale. Countries with patterns of fast decline or growth were mentioned, such as the USA - which remains the most active country but shows the fastest decline evolution among all the studied nations. China achieved the fastest-growing evolution; however, it shows considerable deviation from the balanced line where quantity and quality are roughly equal.
The diagrams were produced by focusing on published papers as a main form of scientific production. However, the results shown in the diagrams, in terms of both ranking and temporal evolution, are a fair reflection of the overall scientific activity of countries (in the fields of physics and astronomy). Scientific activity is a complex process that is not easily measured, especially at national level. Many factors ranging from social phenomena to economic trends affect scientific production. Nonetheless, the Pm-Cm diagrams provide a general view of the quality and the quantity of scientific activity in the fields of physics and astronomy for each country.
The findings of this study are likely to interest science policy-makers. The study provides a global context for scientific activity in the fields of physics and astronomy for countries of interest, and the quality and quantity of scientific output are considered simultaneously. The two-dimensional approach thus also provides insight on the balance between quality and quantity for science policy advisors at the national level.27
This study might also inspire other researchers to pay attention to the potential of a two-dimensional approach in scientometrics. The two-dimensional approach is an easy and effective method of analysing scientific activity at different levels, while preserving the chronological order of a country's progress. This study focused only on the national level, whereas the H-index diagram has focused on individual researchers. Future studies could consider other levels of analysis such as groups, journals, and universities.
Finally, the results of this study are of interest to a broader audience as they provide an understanding of the position of countries in comparison to each other and to the world average. The paper presents these results both visually (Figures 3 to 7) and as data categories (shown in Tables 2 and 3).
References
1. Cattell J. American men of science. New York: Science Press; 1906. [ Links ]
2. Godin B. On origins of bibliometrics. Scientometrics. 2006;68:109-133. http://dx.doi.org/10.1007/s11192-006-0086-0 [ Links ]
3. Godin B. From eugenics to scientometrics: Galton, Cattell, and men of science. Soc Stud Sci. 2007;37:691-728. http://dx.doi.org/10.1177/0306312706075338 [ Links ]
4. Godin B. Measurement and statistics on science and technology. London: Routledge; 2005. [ Links ]
5. Organization for Economic Co-operation and Development (OECD). Science and the policies of government. Paris: OECD; 1963. [ Links ]
6. Rostaing H. La bibliométrie et ses techniques [Bibliometrics and its techniques]. Paris: Centre Scientifique de Saint Jérôme; 1996. French. [ Links ]
7. Godin B. The value of science: Changing conceptions of scientific productivity, 1869-circa 1970. Soc Sci Inform. 2009;48:547-586. http://dx.doi.org/10.1177/0539018409344475 [ Links ]
8. Vinkler P The evaluation of research by scientometric indicators. London: Chandos; 2010. [ Links ]
9. Vinkler P. Composite scientometric indicators for evaluating publications of research institutes. Scientometrics. 2006;68:629-642. http://dx.doi.org/10.1007/s11192-006-0123-z [ Links ]
10. Hirsch JE. An index to quantify an individual's scientific output. Proc Natl Acad Sci USA. 2005;102:16569-16572. http://dx.doi.org/10.1073/pnas.0507655102 [ Links ]
11. Egghe L. Theory and practise of the g-index. Scientometrics. 2006;69:131-152. http://dx.doi.org/10.1007%2Fs11192-006-0144-7 [ Links ]
12. Braun T, Glänzel W, Schubert A. A Hirsch-type index for journals. Scientometrics. 2006;69:169-173. http://dx.doi.org/10.1007/s11192-006-0147-4 [ Links ]
13. Bornmann L, Mutz R, Daniel HD. Are there better indices for evaluation purposes than the h index? A comparison of nine different variants of the h-index using data from biomedicine. J Assoc Inf Sci Technol. 2008;59:830-837. http://dx.doi.org/10.1002/asi.20806 [ Links ]
14. Van Noorde R. A profusion of measures. Nature. 2010;465:864. http://dx.doi.org/10.1038/465864a [ Links ]
15. Radicchi F, Fortunato S, Markines B, Vespignani A. Diffusion of scientific credits and the ranking of scientists. Phys Rev E Stat Nonlin Soft Matter Phys. 2009;80:056103. http://dx.doi.org/10.1103/PhysRevE.80.056103 [ Links ]
16. Nejati A, Hosseini Jenab SM. A two-dimensional approach to evaluate the scientific production of countries (case study: the basic sciences). Scientometrics. 2010;84:357-364. http://dx.doi.org/10.1007/s11192-009-0103-1 [ Links ]
17. Harvey L, Green D. Defining quality. Assess Eval High Educ. 1993;18:9-35. http://dx.doi.org/10.1080/0260293930180102 [ Links ]
18. Lamont M. How professors think: Inside the curious world of academic judgment. Cambridge, MA: Harvard University Press; 2009. [ Links ]
19. Czellar J, Lanarès J. Quality of research: Which underlying values? Scientometrics. 2013;95:1003-1021. http://dx.doi.org/10.1007/s11192-012-0928-x [ Links ]
20. Macilwain C. What science is really worth. Nature. 2010;465:682. http://dx.doi.org/10.1038/465682a [ Links ]
21. Adam D. The counting house. Nature. 2002;415:726-729. http://dx.doi.org/10.1038/415726a [ Links ]
22. Hosseini Jenab SM. Temporal study of countries' scientific evolution based on two-dimensional approach. J Sci Res. 2013;2:169-172. http://dx.doi.org/10.4103/2320-0057.135406 [ Links ]
23. SCImago Journal and Country Rank [homepage on the Internet]. No date [cited 2014 Sep 10]. Available from: http://www.scimagojr.com [ Links ]
24. Committee on Prospering in the Global Economy of the 21st Century. Rising above the gathering storm. Washington DC: The National Academies Press; 2007. [ Links ]
25. Kahn M. A bibliometric analysis of South Africa's scientific outputs - some trends and implications. S Afr J Sci. 2011;107(1/2), Art. #406, 6 pages. http://dx.doi.org/10.4102/sajs.v107i1/2.406 [ Links ]
26. Sooryamoorthy R. Scientific research in the natural sciences in South Africa: A scientometric study. S Afr J Sci. 2013;109(7/8), Art. #0001, 11 pages. http://dx.doi.org/10.1590/sajs.2013/20120001 [ Links ]
27. Kumar A, Prakasan ER, Mohan L, Kademani BS, Kumar V. Bibliometric and scientometric studies in physics and engineering: Recent ten years analysis. Paper presented at: National Conference on Putting knowledge to work: Best practices in librarianship; 2009 May 1-2; Mumbai, India. http://eprints.rclis.org/14829/1/bibliometric_and_scientometric_bosla-cdac_conf_2009-2.pdf [ Links ]
 Correspondence:
Mehdi Jenab
Centre for Space Research, Faculty of Natural Sciences, North-West University
Hoffman Street, Potchefstroom 2520
South Africa
Email: mehdi.jenab@yahoo.com
Received: 22 Mar. 2015
Revised: 20 July 2015
Accepted: 20 Jan. 2016

