


Services on Demand
Article
 English (pdf)
 Article in xml format
 Article references
Indicators

Related links
-
 Cited by Google
 -
 Similars in Google
Share

 Permalink
South African Journal of Science
On-line version ISSN 1996-7489
Print version ISSN 0038-2353
S. Afr. j. sci. vol.112 n.5-6 Pretoria May./Jun. 2016
http://dx.doi.org/10.17159/sajs.2016/20150444
REVIEW ARTICLE
DNA-based identification of aquatic invertebrates - useful in the South African context?
Hermoine J. Venter; Cornelius C. Bezuidenhout
Unit for Environmental Sciences and Management, School of Biological Sciences, North-West University, Potchefstroom, South Africa
ABSTRACT
The concept of using specific regions of DNA to identify organisms - processes such as DNA barcoding - is not new to South African biologists. The African Centre for DNA Barcoding reports that 12 548 plant species and 1493 animal species had been barcoded in South Africa by July 2013, while the Barcode of Life Database (BOLD) contains 62 926 records for South Africa, 11 392 of which had species names (representing 4541 species). In light of this, it is surprising that aquatic macroinvertebrates of South Africa have not received much attention as potential barcoding projects thus far - barcoding of aquatic species has tended to focus on invasive species and fishes. Perusal of the BOLD records for South Africa indicates a noticeable absence of aquatic macroinvertebrates, including families used for biomonitoring strategies such as the South African Scoring System. Meanwhile, the approach of collecting specimens and isolating their DNA individually in order to identify them (as in the case of DNA barcoding), has been shifting towards making use of the DNA which organisms naturally shed into their environments (eDNA). Coupling environmental and bulk sample DNA with high-throughput sequencing technology has given rise to metabarcoding, which has the potential to characterise the whole community of organisms present in an environment. Harnessing barcoding and metabarcoding approaches with environmental DNA (eDNA) potentially offers a non-invasive means of measuring the biodiversity in an environment and has great potential for biomonitoring. Aquatic ecosystems are well suited to these approaches - but could they be useful in a South African context?
Keywords: aquatic macroinvertebrates; DNA barcoding; eDNA; metabarcoding; biomonitoring
The rise of DNA-based identification for biomonitoring
Several authors have pointed out that conservation of natural resources and ecosystems hinges on the provision of data regarding the presence and distribution of species within an environment1-3 - data which usually are supplied through biomonitoring initiatives. This principle is at the core of monitoring programmes, including the South African Scoring System or SASS (one of the programmes that forms part of the current National Aquatic Ecosystem Health Monitoring Programme: River Health Programme4), which analyses macroinvertebrate communities as a measure of stream ecosystem health. SASS, like similar indices, uses morphology to make identifications, which are then assigned weight and values which are then used to gauge the relative well-being of the system.4
The limitations of morphology-based indices for the identification of macroinvertebrates are discussed at length in other publications,5,6 so will only be mentioned briefly here. DNA-based identification methods provide an alternative to morphological identifications, and have been useful in addressing several of these problems. For example, in morphology-based identification of macroinvertebrates it often is difficult to differentiate between cryptic (morphologically indistinguishable) species, several of which have come to light after DNA-based approaches were used.7,8 Larval stages of aquatic insects are often extremely difficult to identify morphologically, even for experts. In addition, morphological identification keys for aquatic macroinvertebrates tend to focus on adult stages, compounding the difficulties of juvenile identification. Furthermore, linking of life stages (especially juveniles) and female and phenotypically variant individuals to identified representative/voucher specimens is incomplete for many macroinvertebrate species. DNA-based methods have proven useful in resolving such issues, because they rely on genetic loci which are applicable regardless of sex, life stage or appearence.6,9,10
Morphological identification is time-consuming and requires a great deal of taxonomic knowledge and skill to be successful. However, once the initial effort has been made to identify a species using DNA, the expertise needed to identify subsequent specimens of the same species is drastically reduced.5 Another advantage of using DNA-based approaches is the potential for identification of specimens to species level, in contrast to many morphological indices which often stop at family level. Identification to species level can bring a sensitivity and depth of knowledge to biomonitoring that coarser identifications are not able to.3
The standardisation of DNA-based identification methods gave rise to the Consortium for the Barcode of Life. This initiative was set up with the goal of promoting the use of specific regions of DNA (in the COI gene for animals, rbcl and matK for plants) to determine the sequence of those regions which was particular to each species, for use in identification. The Barcode of Life Database (BOLD) is a centralised database in which such barcode sequences, as well as specimen collection and species distribution details, are available to any interested person. The database contains over 3.7 million entries from all over the world - including 62 926 from South Africa, 11 392 of which have species names (representing 4541 species).11
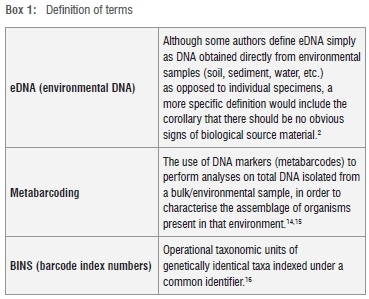
However, despite the optimism and success stories associated with this approach, there are a number of limitations attached to using the COI region as a marker, not least of which is that this method relies on a DNA sequence which is about 650 base pairs long. This effectively eliminates the possibility of using this approach on a large body of damaged DNA fragments as they are too short - including many museum voucher specimens (potentially a source of reference material12), as well as most environmental DNA (eDNA - see Box 1), which is typically damaged. And so the method has continued to evolve, with the advent of the 'mini-barcode'13, as well as several suggestions for alternative DNA regions to be used.
Being able to work with eDNA precipitated from samples from aquatic ecosystems opens up a range of monitoring and research opportu-nities.17,18 Thus other primers and markers have been developed for eDNA, which are often species-specific (in contrast to the broad range of COI), and which have been applied to the detection of indicator species as well as rare, invasive or pathogenic species.17 Mächler et al.18 demonstrated the potential of using eDNA and specific primers to detect macroinvertebrate species in both river and lake systems. Using standard polymerase chain reaction or PCR (which is cheaper than next generation sequencing), they were able to detect both indicator and non-native species using their own primer design. Specially designed primers and probes used in conjunction with qPCR were successfully used to survey the population of European weather loach in Denmark. During this study, this near-extinct fish was detected at sites where its presence had been observed recently, as well as one location where it had not been observed since 1995. In addition to successful detection, the authors report that this approach is less costly, both economically and in terms of effort (person-hours).19
DNA metabarcoding is an approach which uses bulk DNA collections (such as faeces20, sediment meiofaunal communities21 and eDNA2) coupled with next generation sequencing to obtain an overview of the organisms which are present in an environment as a whole. Instead of targeting one or a few species, this approach aims to give a more holistic view of ecosystem composition.4,22 The reads which result from such high throughput sequencing are clustered into operational taxonomic units (OTUs). Depending on the genetic loci used, OTUs can be used to match to sequences in databases such as BOLD (if COI was used) or GenBank, in order to identify the organisms whose DNA was in the sample.14,22,23 In other cases, in which primer sets other than COI are used or when no reference sequences are available for the OTUs produced, taxonomic assignation is not possible. However, that does not mean the data are not useful. Molecular taxonomic units (MOTUs) refer to representative sequence clusters which have been grouped together using particular algorithms. MOTU data can be utilised in lieu of 'true' species data, by comparing MOTU profiles of different environments or time periods.24 Although the metabarcoding approach (see Box 1) still is being refined, it potentially allows monitoring of community-level responses to change, including responses to remediation strategies and climate change.14,15
eDNA in aquatic ecosystems
The fact that DNA has a relatively short turnover time in aquatic systems means that aqueous eDNA is likely to represent a 'real-time' view of species present within a relatively small window of time.25 Strickler et al.26 investigated the effects of temperature, pH and UVB radiation on eDNA in water and found that it degraded faster in warmer water, with a neutral pH and a moderate UVB level. Because these conditions are also amenable to microbial growth, the authors speculated that eDNA breakdown was at least partially facilitated by microbial action. During investigations into DNA persistence in both laboratory and field conditions (ponds), species could be detected using eDNA for 25 days and 21 days after removal of the organisms, respectively.27 However, the fact that DNA may be concentrated and survive much longer in sediments may be a complicating factor.25
DNA dispersal in flowing streams and rivers is also a concern, as it may give false positive results downstream where the organism in question is not found. DNA dispersal was investigated by Laramie et al.28 who traced eDNA of Chinook salmon (Oncorhynchus tshawytscha), and Deiner et al.29 who studied eDNA of a daphnid (Daphnia longispina) and swollen river mussel (Unio tumidus). Both studies found that eDNA signals tend to decrease as distance from the source increases.28,29 In Deiner et al.'s study, DNA from lake-dwelling invertebrates was detected 12 km downstream from the lake inhabited by the target organisms. The authors suggest that when using eDNA to estimate biodiversity in such ecosystems, sample sites should be 5-10 km apart, and follow the stream hierarchy.29
Other challenges
Just as a person cannot be identified by their fingerprints unless a record of their fingerprints exists as a reference, if the barcode databases do not contain a matching record of barcoded specimens of a species with which to compare a query sequence, DNA cannot be used to make species level identifications (although specimens may still be placed within families or genera). We encountered this problem when attempts were made to use macroinvertebrate COI sequences to provide further resolution to morphological identifications. Only weak matches could be found with sequences in the GenBank database. These matches often did not agree with the morphological identifications, or corresponded to species found in countries in the northern hemisphere or in Australia. In addition, as mentioned earlier, BOLD Systems Database records for South Africa indicate a noticeable dearth of aquatic macroinvertebrates (with greater focus on fish and invasive species30). For example, there are zero entries referring to families such as Baetidae and Ephemeridae, and only 43 records for the order Ephemeroptera. Similarly, Plecoptera had only 13 entries, while Odonata had 66 and Trichoptera 138. When compared to the 3621 records for Coleoptera and 3150 for Hemiptera,16,31 it is clear that there is considerable room for improvement for aquatic organisms.
This challenge can be overcome by building up sequence libraries. A possible starting point may be natural history museums. The addition of sequence data to curated specimen records could be invaluable. The Fresh Water Invertebrates collection of the Albany Museum was reported to contain 67 000 specimens in 2009.32 Although it would be a boon if this collection could act as a starting point for aquatic invertebrate barcoding initiatives, the storage conditions and age of museum specimens tend to lead to DNA degradation, and have been known to impede barcoding efforts.12 Thus, although some success has been achieved using such specimens, it is not possible to escape collection and identification of fresh specimens entirely.
Because better quality DNA may be obtained from fresh specimens, or those which have been stored correctly (in 95% ethanol and then at -10 °C)12, this practice should be encouraged among those who sample and collect aquatic invertebrates. Although they may not be familiar with the techniques necessary to isolate and process the DNA for barcoding, if the experts who are able to identify aquatic invertebrates do so and then store the specimens correctly, the molecular work can be done at a later stage. Alternatively, specimens can be barcoded first and clustered into barcode index numbers or BINs16 (see Box 1) according to barcode similarity. Representative specimens from such BINs can be selected for morphological identification and description, especially if potential cryptic species come to light. Building up a library of aquatic invertebrate DNA may thus lead to interdisciplinary cooperation and collaboration. Establishing an identifying sequence for a species is not the limit of information which can be gained from DNA. Additionally, if other DNA regions need to be selected in future applications (such as metabarcoding and genome skimming), then the DNA which has already been isolated can be used to characterise the organism from a different perspective.33,34
A challenge which is less of a problem during traditional barcoding -in which organisms are identified one specimen at a time - but is an obstacle for bulk samples, is PCR bias. During the initial enrichment steps, PCR bias can create a number of problems for metabarcoding and eDNA analyses. For example, COI primers used in DNA barcoding have been found not to operate with the same efficiency for all organisms' DNA. In a mixed sample, bias towards certain organisms may cause their presence to be overstated, while others are underrepresented or missed entirely.35 To overcome this bias, Taberlet et al.33 suggest that metabarcodes and primers be tailored to the needs of each project. In order to do this, they propose that the DNA and barcodes collected and placed in curated collections during barcoding efforts could be used to develop this technique further. Although there are advantages to designing metabarcodes from within the COI barcoding region - such as access to the vast amounts of already identified sequences - these advantages must be weighed against potential biases.14,22,36
Competence in bioinformatics and molecular biology techniques, particularly those involving high-throughput sequencing, will have to be developed and encouraged in order to take full advantage of the huge data sets which such techniques generate. So too, expertise in traditional taxonomy and morphological identification - far from rendering such skills obsolete, as some fear37, these initiatives cannot be accomplished without robust morphological identifications. Utilising the three approaches of taxonomy, barcoding and metabarcoding in tandem will allow researchers to link nearly three centuries of taxonomic research to modern data sets and community structures.
Conclusion
By understanding the biodiversity of South Africa better, we may be better able to protect it. By learning more about biota and their interaction with the environment, predictions can be made regarding how ecosystems will respond to change, and what can be done to preserve them. The recent report by Dallas and Rivers-Moores1 both highlights the possible changes which may be wrought by climate change, and calls for more proactive monitoring. Clearly, barcoding and metabarcoding could be advantageous for biologists working with aquatic macroinvertebrates and aquatic ecosystem monitoring, particularly for those who do not have a background in taxonomy. However, in order to harness the usefulness of these techniques, an effort has to be made to collect the necessary data. For this reason, we advocate the establishment of regional collections which link identified aquatic species with their DNA sequences, which can be used to develop primer sets and standard methods for the use of eDNA in biomonitoring. Furthermore, we recommend that the establishment of collections be done in conjunction with a SASS approach, so that DNA-based approaches can be made relatable to previous work.
Acknowledgements
We gratefully acknowledge Biosafety South Africa as well the National Research Foundation of South Africa for funding. Views expressed are those of the authors and not of the funding entities. We also thank the anonymous reviewers for their helpful comments and suggestions which improved the manuscript, particularly one reviewer for practical suggestions regarding the binning of specimens.
Authors' contributions
C.C.B. supervised and made conceptual contributions; H.J.V. wrote the manuscript and made conceptual contributions.
References
1. Dallas HF, Rivers-Moore N. Ecological consequences of global climate change for freshwater ecosystems in South Africa. S Afr J Sci. 2014;110(5-6), Art. #2013-0274, 11 pages. http://dx.doi.org/10.1590/sajs.2014/20130274 [ Links ]
2. Thomsen PF, Willerslev E. Environmental DNA - An emerging tool in conservation for monitoring past and present biodiversity. Biol Conserv. 2015;183:4-18. http://dx.doi.org/10.1016/j.biocon.2014.11.019 [ Links ]
3. Baird DJ, Hajibabaei M. Biomonitoring 2.0: A new paradigm in ecosystem assessment made possible by next-generation DNA sequencing. Mol Ecol. 2012;21(8):2039-2044. http://dx.doi.org/10.1111/j.1365-294X.2012.05519.x [ Links ]
4. South African Department of Water Affairs and Forestry. National Aquatic Ecosystem Health Monitoring Programme (NAEHMP): River Health Programme (RHP) Implementation Manual. Pretoria: Department of Water Affairs and Forestry; 2008. [ Links ]
5. Savolainen V Cowan RS, Vogler AP Roderick GK, Lane R. Towards writing the encyclopaedia of life: An introduction to DNA barcoding. Philos T Roy Soc B. 2005;360(1462):1805-1811. http://dx.doi.org/10.1098/rstb.2005.1730 [ Links ]
6. Hebert PD, Cywinska A, Ball SL. Biological identifications through DNA barcodes. P Roy Soc Lond B Bio. 2003;270(1512):313-321. [ Links ]
7. Janion C, Bedos A, Bengtsson J, Deharveng L, Jansen van Vuuren B, Leinaas HP et al. Springtail diversity in South Africa. S Afr J Sci. 2011;107(11-12), Art. #582, 7 pages. http://dx.doi.org/10.4102/sajs.v107i11/12.582 [ Links ]
8. Nadel RL, Slippers B, Scholes M, Lawson S, Noack A, Wilcken C, et al. DNA bar-coding reveals source and patterns of Thaumastocoris peregrinus invasions in South Africa and South America. Biol Invasions. 2010;12(5):1067-1077. http://dx.doi.org/10.1007/s10530-009-9524-2 [ Links ]
9. Park D, Foottit R, Maw E, Hebert PD. Barcoding bugs: DNA-based identification of the true bugs (Insecta: Hemiptera: Heteroptera). PLoS ONE. 2011;6(4):e18749, 9 pages. http://dx.doi.org/10.1371/journal.pone.0018749 [ Links ]
10. Ekrem T, Stur E, Hebert PD. Females do count: Documenting Chironomidae (Diptera) species diversity using DNA barcoding. Org Divers Evol. 2010;10(5):397-408. http://dx.doi.org/10.1007/s13127-010-0034-y [ Links ]
11. Ratnasingham S, Hebert PD. BOLD: The Barcode of Life Data System (http://www.barcodinglife.org). Mol Ecol Notes. 2007;7(3):355-364. http://dx.doi.org/10.1111/j.1471-8286.2007.01678.x [ Links ]
12. Baird DJ, Pascoe TJ, Zhou X, Hajibabaei M. Building freshwater macroinvertebrate DNA-barcode libraries from reference collection material: Formalin preservation vs specimen age. Freshwater Sci. 2011;30(1):125-130. http://dx.doi.org/10.1899/10-013.1 [ Links ]
13. Hajibabaei M, Smith M, Janzen DH, Rodriguez JJ, Whitfield JB, Hebert PD. A minimalist barcode can identify a specimen whose DNA is degraded. Mol Ecol Notes. 2006;6(4):959-964. http://dx.doi.org/10.1111/j.1471-8286.2006.01470.x [ Links ]
14. Ji Y Ashton L, Pedley SM, Edwards DP Tang Y Nakamura A, et al. Reliable, verifiable and efficient monitoring of biodiversity via metabarcoding. Ecol Lett. 2013;16(10):1245-1257. http://dx.doi.org/10.1111/ele.12162 [ Links ]
15. Epp LS, Boessenkool S, Bellemain EP Haile J, Esposito A, Riaz T, et al. New environmental metabarcodes for analysing soil DNA: Potential for studying past and present ecosystems. Mol Ecol. 2012;21(8):1821-1833. http://dx.doi.org/10.1111/j.1365-294X.2012.05537.x [ Links ]
16. BOLD Systems. BOLD Systems Databases. c2014 [cited 2015 Jun 20]. Available from: http://www.boldsystems.org/index.php/databases [ Links ]
17. Bohmann K, Evans A, Gilbert MTP, Carvalho GR, Creer S, Knapp M, et al. Environmental DNA for wildlife biology and biodiversity monitoring. Trends Ecol Evol. 2014;29(6):358-367. http://dx.doi.org/10.1016/j.tree.2014.04.003 [ Links ]
18. Mächler E, Deiner K, Steinmann P Altermatt F. Utility of environmental DNA for monitoring rare and indicator macroinvertebrate species. Freshwater Sci. 2014;33(4):1174-1183. http://dx.doi.org/10.1086/678128 [ Links ]
19. Sigsgaard EE, Carl H, M0ller PR, Thomsen PF. Monitoring the near-extinct European weather loach in Denmark based on environmental DNA from water samples. Biol Conserv. 2015;183:46-52. http://dx.doi.org/10.1016/j.biocon.2014.11.023 [ Links ]
20. De Barba M, Miquel C, Boyer F, Mercier C, Rioux D, Coissac E, et al. DNA metabarcoding multiplexing and validation of data accuracy for diet assessment: Application to omnivorous diet. Mol Ecol Resour. 2014;14(2):306-323. http://dx.doi.org/10.1111/1755-0998.12188 [ Links ]
21. Lallias D, Hiddink JG, Fonseca VG, Gaspar JM, Sung W, Neill SP et al. Environmental metabarcoding reveals heterogeneous drivers of microbial eukaryote diversity in contrasting estuarine ecosystems. ISME J. 2015;9(5):1208-1221. http://dx.doi.org/10.1038/ismej.2014.213 [ Links ]
22. Cristescu ME. From barcoding single individuals to metabarcoding biological communities: Towards an integrative approach to the study of global biodiversity. Trends Ecol Evol. 2014;29(10):566-571. http://dx.doi.org/10.1016/j.tree.2014.08.001 [ Links ]
23. Leray M, Knowlton N. DNA barcoding and metabarcoding of standardized samples reveal patterns of marine benthic diversity. Proc Natl Acad Sci USA. 2015;112(7):2076-2081. http://dx.doi.org/10.1073/pnas.1424997112 [ Links ]
24. Jones M, Ghoorah A, Blaxter M. jMOTU and Taxonerator: Turning DNA barcode sequences into annotated operational taxonomic units. PLoS ONE. 2011;6(4):e19259, 10 pages. http://dx.doi.org/10.1371/journal.pone.0019259 [ Links ]
25. Turner CR, Uy KL, Everhart RC. Fish environmental DNA is more concentrated in aquatic sediments than surface water. Biol Conserv. 2015;183:93-102. http://dx.doi.org/10.1016/j.biocon.2014.11.017 [ Links ]
26. Strickler KM, Fremier AK, Goldberg CS. Quantifying effects of UV-B, temperature, and pH on eDNA degradation in aquatic microcosms. Biol Conserv. 2015;183:85-92. http://dx.doi.org/10.1016/j.biocon.2014.11.038 [ Links ]
27. Dejean T, Valentini A, Duparc A, Pellier-Cuit S, Pompanon F, Taberlet P, et al. Persistence of environmental DNA in freshwater ecosystems. PLoS ONE. 2011;6(8):e23398, 4 pages. http://dx.doi.org/10.1371/journal.pone.0023398 [ Links ]
28. Laramie MB, Pilliod DS, Goldberg CS. Characterizing the distribution of an endangered salmonid using environmental DNA analysis. Biol Conserv. 2015;183:29-37. http://dx.doi.org/10.1016/j.biocon.2014.11.025 [ Links ]
29. Deiner K, Altermatt F. Transport distance of invertebrate environmental DNA in a natural river. PLoS ONE. 2014;9(2):e88786, 8 pages. http://dx.doi.org/10.1371/journal.pone.0088786 [ Links ]
30. Swartz ER, Mwale M, Hanner R. A role for barcoding in the study of African fish diversity and conservation. S Afr J Sci. 2008;104(7-8):293-298. [ Links ]
31. African Centre for DNA Barcoding [homepage on the Internet]. c2013 [cited 2016 Jan 14]. Available from: http://www.acdb.co.za/ [ Links ]
32. Coetzer W. A new era for specimen databases and biodiversity information management in South Africa. Biodivers Inform. 2012;8(1), Art. #4263, 11 pages. http://dx.doi.org/10.17161/bi.v8i1.4263 [ Links ]
33. Taberlet P, Coissac E, Pompanon F, Brochmann C, Willerslev E. Towards next-generation biodiversity assessment using DNA metabarcoding. Mol Ecol. 2012;21(8):2045-2050. http://dx.doi.org/10.1111/j.1365-294X.2012.05470.x [ Links ]
34. Coissac E, Hollingsworth PM, Lavergne S, Taberlet P. From barcodes to genomes: Extending the concept of DNA barcoding. Mol Ecol. 2016;25(7):1423-1428. http://dx.doi.org/10.1111/mec.13549 [ Links ]
35. Pauls SU, Alp M, Bálint M, Bernabò P, Čiampor F, Čiamporová-Zat'ovičová Z, et al. Integrating molecular tools into freshwater ecology: Developments and opportunities. Freshwater Biol. 2014;59(8):1559-1576. http://dx.doi.org/10.1111/fwb.12381 [ Links ]
36. Deagle BE, Jarman SN, Coissac E, Pompanon F, Taberlet P. DNA metabarcoding and the cytochrome c oxidase subunit I marker: Not a perfect match. Biol Lett. 2014;10(9), Art. #20140562, 4 pages. http://dx.doi.org/10.1098/rsbl.2014.0562 [ Links ]
37. Hebert PDN, Gregory TR. The promise of DNA barcoding for taxonomy. Syst Biol. 2005;54(5):852-859. http://dx.doi.org/10.1080/10635150500354886 [ Links ]
 Correspondence:
Hermoine Venter
Unit for Environmental Sciences and Management, School of Biological Sciences
North-West University, Private Bag X6001, Potchefstroom 2520
South Africa
Email:hermoine.venter@outlook.com
Received: 27 Nov. 2015
Revised: 15 Jan. 2016
Accepted: 18 Jan. 2016

