


Servicios Personalizados
Articulo
 Inglés (pdf)
 Articulo en XML
 Referencias del artículo
Indicadores

Links relacionados
-
 Citado por Google
 -
 Similares en Google
Compartir

 Permalink
South African Journal of Science
versión On-line ISSN 1996-7489
versión impresa ISSN 0038-2353
S. Afr. j. sci. vol.112 no.3-4 Pretoria mar./abr. 2016
http://dx.doi.org/10.17159/sajs.2016/20150217
RESEARCH ARTICLE
Recent trends in the climate of Namaqualand, a megadiverse arid region of South Africa
Claire L. DavisI; M. Timm HoffmanII; Wesley RobertsIII
INatural Resources and the Environment, Council for Scientific and Industrial Research, Stellenbosch, South Africa
IIDepartment of Biological Sciences, University of Cape Town, Cape Town, South Africa
IIIBioCarbon Partners, Lusaka, Zambia
ABSTRACT
Namaqualand is especially vulnerable to future climate change impacts. Using a high-resolution (0.5°x0.5°) gridded data set (CRU TS 3.1) and individual weather station data, we demonstrated that temperatures as well as frequency of hot extremes have increased across this region. Specifically, minimum temperatures have increased by 1.4 °C and maximum temperatures by 1.1 °C over the last century. Of the five weather stations analysed, two showed evidence of a significant increase in the duration of warm spells of up to 5 days per decade and a reduction in the number of cool days (TX10P) by up to 3 days per decade. In terms of rainfall, we found no clear evidence for a significant change in annual totals or the frequency or intensity of rainfall events. Seasonal trends in rainfall did, however, demonstrate some spatial variability across the region. Spatial trends in evapotranspiration obtained from the 8-day MOD16 ET product were characterised by a steepening inland-coastal gradient where areas along the coastline showed a significant increase in evapotranspiration of up to 30 mm per decade, most notably in spring and summer. The increase in temperature linked with the increases in evapotranspiration pose significant challenges for water availability in the region, but further research into changes in coastal fog is required in order for a more reliable assessment to be made. Overall, the results presented in this study provide evidence-based information for the management of climate change impacts as well as the development of appropriate adaptation responses at a local scale.
Keywords: climate extreme; trend analysis; temperature; rainfall; evapotranspiration
Introduction
There is strong scientific evidence that recent changes in climate are probably attributable to human activities and have resulted in increased annual global temperatures, as well as associated increases in temperature extremes.1,2 There have been a number of studies across South Africa that have demonstrated similar trends in temperature.1,3-9 Where records are of sufficient length, there have been detectable increases in extreme rainfall events1,4,9 and evidence that droughts have become more intense and widespread.6 The latest climate change projections for South Africa indicate that temperatures are likely to increase into the 21st century and that rainfall in the south western Cape is expected to decrease in the future as a result of a poleward retreat of rain-bearing mid latitude cyclones.9 These projected changes in climate are likely to have significant implications for the region's biodiversity.10
The Succulent Karoo biome, including the Namaqualand region, is globally recognised as a biodiversity hotpot that is particularly vulnerable to climate change,11 not only because of the high levels of biodiversity but also because of a high dependence of the region's population on natural resources, livestock production, and dryland agriculture.12,13 Modelling studies have indicated that the Succulent Karoo may suffer a reduction in spatial extent of up to 40% as well as consequent reductions in the abundance and diversity of endemic species as a result of changes in temperature and rainfall.14,15 In terms of individual species' responses to climate change, a study by Broennimann et al.16 found that geophytes and succulents, which make up over half of plant species in Namaqualand, were particularly vulnerable to climate change. They predicted a minimum decline in species richness of 41% for the Succulent Karoo biome.
To date, only three studies have investigated the historical climate of the Namaqualand,17-19 all of which focused specifically on changes in rainfall. Various palaeoclimate studies in the winter rainfall zone of South Africa20-23 have also contributed to the understanding of the long-term changes in climate in Namaqualand. Distinguishing local climate trends is essential as climate may not change uniformly across large areas. Furthermore, there is a clear demand for reliable climate information by both local authorities and land managers in order to ensure that climate risk management and assessments of climate change are locally relevant.24,25
We present an assessment of the trends in key climatic variables as well as climate extremes for Namaqualand that provide an updated analysis, add value and complement previous studies. A better understanding of local changes and inter-annual variability assist in the interpretation of future climate change projections and provide evidence-based research to guide management actions in the region.
Detecting changes in climate at the local scale is considerably more difficult than doing so for regional climate because of the lack of an accurate, long-term, well-maintained and dense spatial network of observational stations to detect regional climate signals. This is particularly evident in Namaqualand where weather stations are sparsely distributed. Gridded climate data sets developed by interpolating weather station records help overcome this by approximating the true spatial and temporal variability of key climate variables.26-29 The analysis presented in this paper is based on temperature and rainfall data from the high-resolution gridded data set (1901-2009) provided by the Climatic Research Unit of the University of East Anglia (CRU TS 3.1) as well as daily climate data obtained from five weather stations in Namaqualand and evapotranspiration data obtained from the 8 day MOD16 product. Multiple data sets were used in order to explore the full range of climate signals and to provide a complete characterisation of the confidence in the changes observed.
Study Area
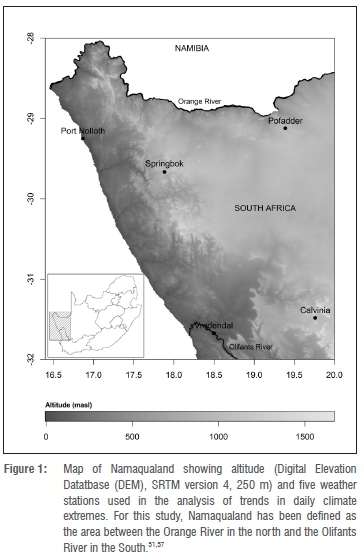
Namaqualand is located in the north-west corner of South Africa and extends from the Orange River in the north to Vanrhynsdorp and the Olifants River in the south.30,31 It covers a region of approximately 50 000 km2 and is located west and south of the escarpment, 200-300 km inland of the west coast32 (Figure 1).
Namaqualand hosts approximately 3500 plant species with about 25% of this flora being endemic to the region31 and is well known for its flower displays in spring. Agriculture, mainly livestock production, is the primary land use in Namaqualand and is practised on both commercial and communal farmlands.33 The communal areas account for more than 25% of the region and support 45% of its population.34
The climate of the region is determined primarily by the southern subtropical high pressure system and the circumpolar westerly airstream.35 Geographic features, such as the mountains of the escarpment and the cold Benguela current, influence local scale climate. Namaqualand is classed as a semi-arid winter rainfall region with mean annual precipitation ranging from 50 mm in the north-west to 400 mm per annum in the Kamiesberg. Peak rainfall amounts occur over the Kamiesberg Mountains as a result of the orographic effect.17 More than 60% of the rainfall occurs during the winter months between May and September as a result of the cold, westerly fronts from the southern oceans.35 Coastal lows are also common in winter. Rainfall is supplemented by heavy dewfalls experienced during mid-winter (July-August) and advective coastal fog experienced during the summer months. Fog is generated by the cold Benguela current of the Atlantic Ocean and occurs primarily along the coastal region for about 75 days of the year.36 Namaqualand is prone to droughts, which usually span a few successive years.17,19
Annual average temperatures for the study area are relatively mild throughout the year and range from 13 °C to 21 °C, owing to the cold Benguela Current off the west coast of Namaqualand.31 Mean annual temperatures are highest inland of the west coast increasing northwards, while the escarpment and high lying areas experience cooler temperatures. Maximum temperatures only exceed 30 °C when Berg winds35 are blowing off the plateau to the west. There is a relatively high evaporative demand in Namaqualand, particularly during these hot berg-wind events.36 With the exception of the coastal belt, the region experiences a large annual and diurnal range in temperatures.17 Occasional frosts occur in the high lying areas of the escarpment and central plateau.32
Methodology
Observed changes in climate
A high-resolution (0.5°x0.5°) gridded monthly data set provided by the CRU TS 3.129 was used to analyse the spatial trends in temperature and rainfall for the period 1901-2009. Acknowledging the limitations of weather station interpolation, a gridded climate data set was used in this study as the weather stations are sparsely distributed in Namaqualand and are thus not fully representative of the full range of temperature and rainfall values experienced over the region. The CRU TS 3.1 data set has been validated,28 and was used previously to study trends in African climate.5 It is important to note that gridded climate data is not suitable to provide time series analysis at the scale of the individual pixel and thus the results presented here provide an indication of the spatial patterns on change in temperature and rainfall over the entire region. A time series of temperature and rainfall data was extracted from the CRU TS 3.1 data set and a linear regression was performed to detect changes at an annual time step for the region. To describe inter-annual variability, temperature and rainfall anomalies were computed by subtracting the 1960-1990 mean value38,39 from each annual value in the time series.
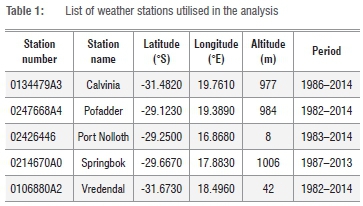
In order to ensure that the CRU TS 3.1 data set depicts the correct distribution and amounts of monthly temperature and rainfall for the studied region, the gridded data set was compared to the weather station data (Table 1) for the period 1982-2009 by calculating the correlation coefficients (r-value). With the exception of minimum temperature obtained from the Springbok and Port Nolloth stations, the weather station data and the gridded CRU TS 3.1 were significantly and positivity correlated (Supplementary Table 1). The correlation coefficients (>0.5) confirm the similarity of the two data sets, thus lending confidence in using the interpolated data set for the spatial analysis of trends.
In order to provide a more detailed understanding of changes in water availability for Namaqualand, trends in evapotranspiration were also assessed. A direct measurement of evapotranspiration was not carried out in this study, but was derived from the Moderate Resolution Imaging Spectroradiometer (MODIS) on-board NASA's Terra and Aqua satellites. The 8-day MOD16 Global Terrestrial Evapotranspiration data set (MOD 16 ET available from http://www.ntsg.umt.edu/project/mod16), has a 1 km2 spatial resolution and covers the time period 2000-2010. The MOD16 Evapotranspiration data sets are estimated using the improved evapotranspiration algorithm outlined in Mu et al.40 which is based on the Penman-Monteith equation.41
Trend Analysis
Spatial trends in temperature derived from the CRU TS 3.1 data set (1901-2009) and evapotranspiration derived from the MODIS MOD16 ET (2000-2010) data set were examined by applying the Theil-Sen (TS) median slope estimator.42,43 This is a robust non-parametric trend operator which is unaffected by the presence of outliers.44 The Theil-Sen operator is determined by calculating the slope between every pair-wise combination and then assessing the median slope value. The result is a spatially-explicit expression of the rate of change per year in each of the climate variables, where pixels with negative (positive) slopes indicate areas that have experienced a decline (increase). The trend analysis was calculated for seasonal means. The four major seasons are December-January-February (DJF), March-April-May (MAM), June-July-August (JJA), and September-October-November (SON). For comparison, trends in annual temperature and rainfall for each of the weather stations were computed.
To assess changes in rainfall the rank-based, non-parametric Mann-Kendall method45 was applied. This is a non-linear trend indicator that measures the degree to which a trend is consistently increasing or decreasing. The Kendall's correlation coefficient ranges from -1 to +1, where a value of +1 indicates a trend that consistently increases and never decreases with the opposite being true for a value of -1. A value of 0 indicates no consistent trend.
Observed changes in climate extremes
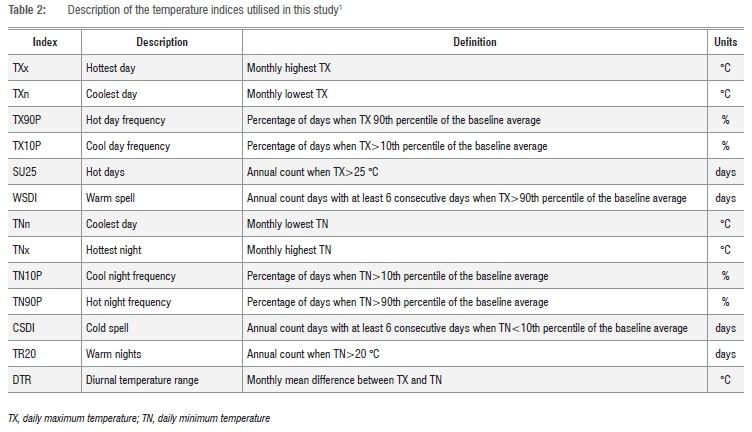
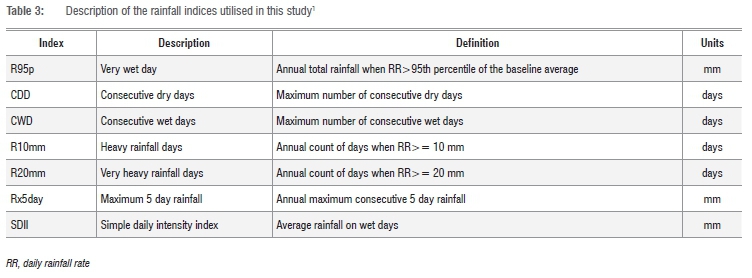
Daily weather data provided by the South African Weather Service for five stations in Namaqualand were used to analyse trends in temperature and rainfall extremes (Table 1). The weather station data were subjected to quality control to remove any erroneous values. The analysis was conducted using the RClimdex package (Version 1.1). This software package (available for download from http://etccdi.pacificclimate.org/software.shtml) has been used in a number of regional1 and national studies46,47 to detect changes in climate extremes. The software is capable of computing 27 core indices,48 but only those temperature and rainfall indices relevant to Namaqualand were selected for this study (Tables 2 and 3). The base period used in the analysis is normally 1971-20001,46 but because the weather station data for Namaqualand only begans in the 1980s, the base period of 1980-2000 was used in the analysis. Linear trends were calculated using the least-squares method for each temperature and rainfall index. The trends were tested for significance at the 95% confidence level.
Results
Observed changes in climate
Temperature
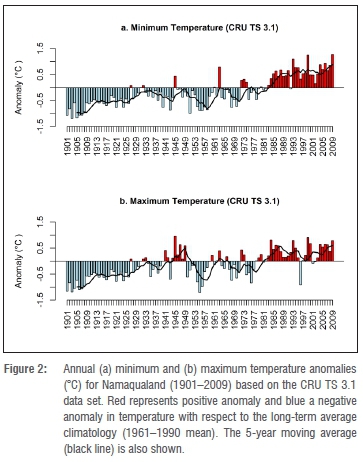
Linear trend analysis of the CRU TS 3.1 data set for Namaqualand revealed that annual minimum and maximum temperature have increased at a rate of 0.14 °C per decade (p<0.0001) and 0.11 °C per decade (p<0.0001) respectively between 1901 and 2009. It is clear from this data set that minimum temperatures are increasing at a faster rate than maximum temperatures and that the rate of warming has increased over the last two decades (Figure 2). Minimum temperatures for the period 1970-2009 were 0.36 °C warmer than the 1961-1990 mean whereas maximum temperatures for the same period were only 0.16 °C warmer than the 1961-1990 mean. The highest annual minimum temperature of the series was in 2009, with a temperature of 1.27 °C above the 1961-1990 mean. The highest annual maximum temperature of the series was for 1945, with a temperature of 0.96 °C above the 1961-1990 mean. The second highest annual maximum temperature was for 1999, with a temperature of 0.9 °C above the 1961-1990 mean.
A spatial pattern in temperature trends is evident (Figure 3 and Figure 4), with the greatest warming in minimum temperature being observed in the north-eastern parts of Namaqualand and the greatest warming in maximum temperature being observed in the south-eastern parts of Namaqualand towards the interior of the country. Trends in annual maximum temperature derived from the weather station data indicate a significant increase at the Port Nolloth and Vredendal stations of 0.3 °C and 0.1 °C per decade respectively (Supplementary Figure 1). Trends in minimum temperature were less consistent, with a significantly increasing trend observed for Pofadder, but a significantly decreasing trend observed for Springbok (Supplementary figure 2).
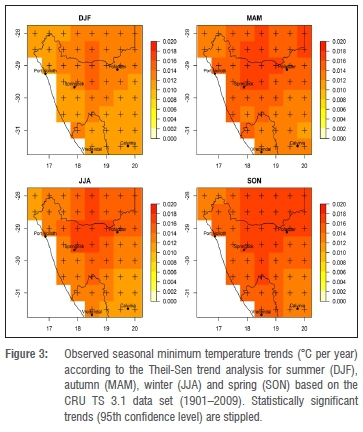
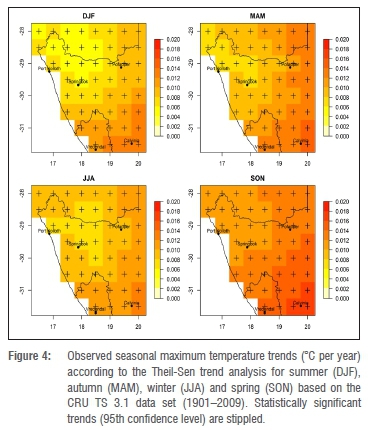
Temperature trends across seasons are inconsistent with slightly larger warming in spring (SON) and autumn (MAM) compared with the other seasons (Figures 3 and 4). Overall, areas further inland have experienced a higher rate of change than those areas along the coastline. As with the annual trends, the rate of increase in seasonal minimum temperatures is greater than that of maximum temperatures.
Rainfall
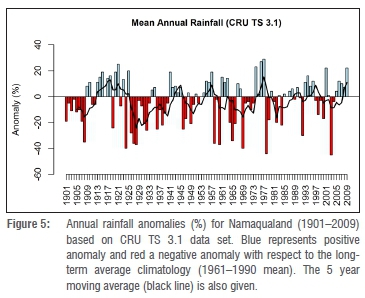
Based on the linear trend of mean annual rainfall derived CRU TS 3.1 data set from 1901 to 2009, there is no clear evidence for a significant change in rainfall over Namaqualand. Furthermore, the annual rainfall time series for each the weather stations demonstrates no significant change in rainfall over the last 30 years (Supplementary figure 3). The rainfall time series (Figure 5) is characterised by strong inter-annual variability with periods of above and below average rainfall, for example 1973-1976 and 2002-2004 respectively. There was no significant trend in the coefficient of variation (Supplementary figure 4), suggesting that the inter-annual rainfall variability has remained relatively constant throughout the period of analysis.
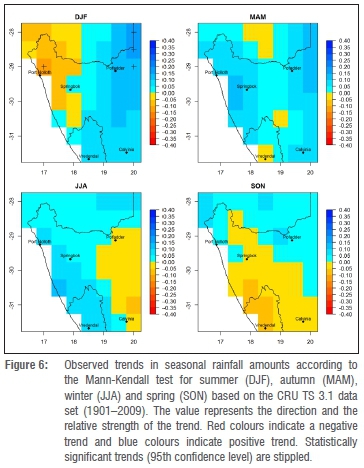
Seasonal trends in rainfall (Figure 6) do demonstrate some spatial patterns of change over Namaqualand. Rainfall during the main rainfall season (JJA) decreased over the eastern parts of Namaqualand and during spring (SON), rainfall decreased over the central and southern parts. These patterns may however be considered negligible because of the insignificance of the trends. The only statistically significant trends were observed in summer (DJF) over Port Nolloth, which has experienced a decrease, and over the Pofadder region which experienced an increase in rainfall. Additional analysis of the CRU TS 3.1 rainfall data set indicated that there was no significant trend in the rainfall totals over the main vegetation growing season (June-Oct)49, (Supplementary Figure 5) and there was no evidence for shift in the seasonality or month of peak rainfall.
Evapotranspiration
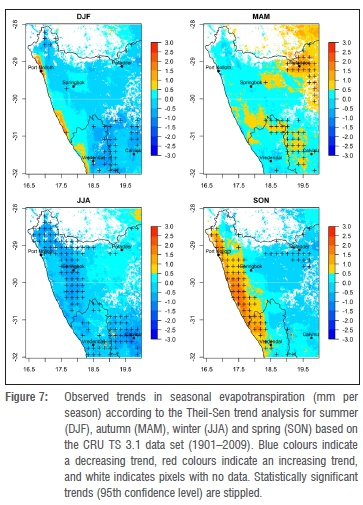
Evidence from the analysis of MOD16 ET from 2000 to 2010 indicates that changes in evapotranspiration have not been uniform across Namaqualand. During spring (SON) and summer (DJF), the trend in evapotranspiration was characterised by a steepening inland-coastal gradient while areas along the coastline experienced an increase in evapotranspiration of up to 30 mm per decade over the period (Figure 7). This trend is most pronounced and statistically significant during spring along the coastline. During autumn (MAM), areas to the north of Namaqualand around Pofadder experienced a significant increase in evapotranspiration. During winter (JJA) there was a reduction in evapotranspiration over the entire region with significant trends observed over the escarpment and higher altitude regions of Springbok and Calvinia.
Observed changes in climate extremes
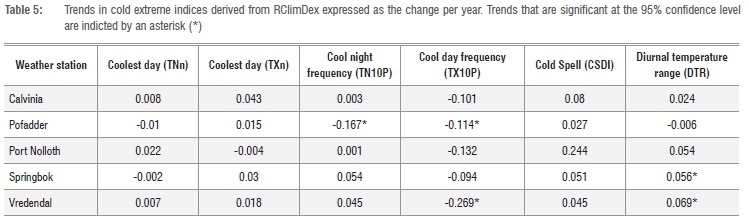
The analysis of the weather station data indicate that the occurrence of warm extremes (Table 4) has increased and that the occurrence of cold extremes (Table 5) has decreased over Namaqualand. This is clearly demonstrated by the observed increase in the number of hot days (TX90P) and the corresponding decrease in the number of cool days (TX10P) for each weather station. Furthermore, all five of the weather stations demonstrated an increase in warm spell duration (WSDI), with those for Pofadder and Springbok being statistically significant. The duration of warm spells increased by 2 and 5 days per decade (p<0.05) at the Pofadder and Springbok stations respectively.
For the Vredendal weather station, the monthly highest maximum temperature, the frequency of hot days as well as the number of days above 25 °C all increased significantly. The number of hot days increased by 2.5 days (p<0.05) and the number of hot days above 25 °C by 12 days per decade (p<0.05) at this station.
For Pofadder, the frequency of hot nights (TN90P) increased by 1.1 days per decade (p<0.05) and the frequency of warm nights (TR20) by 0.7 days (p<0.05), corresponding with a decrease in the frequency of cool nights (TN10P) of 1.7 days (p<0.05). This resulted in a reduction in the diurnal temperature range (DTR) at this station. For the other weather stations, the occurrence of hot nights (TN90P) decreased, resulting in an increase in the DTR most notably for the Springbok and Vredendal weather stations.
In terms of rainfall extremes (Table 6), the only significant trend observed was for Port Nolloth, that experienced a decline in the maximum consecutive 5 day rainfall (Rx5day), (p<0.05). The trends for the other weather stations were weaker and differed considerably in both magnitude and direction thus providing little evidence for a change in rainfall extremes.
Discussion
Using a high-resolution (0.5°x0.5°) gridded data set (CRU TS 3.1), weather station data and MOD16 evapotranspiration data, an updated analysis of changes in climate for the Namaqualand region of South Africa was provided. There is strong evidence from the CRU TS 3.1 high-resolution gridded data set to suggest that temperatures in Namaqualand have been increasing over the last century, and that the rate of warming has been increasing - most notably in the last two decades. The trends presented are consistent with detected increases in global regional temperatures.2,3,5,9,50 Projections of future temperature change for South Africa9 indicate that temperatures are expected to continue to increase.
According to the analysis of CRU TS 3.1 data set, minimum temperatures are increasing at a faster rate than maximum temperatures. As demonstrated in other studies,50-52 this has resulted in a decrease in the DTR for many parts of the globe. The results from the analysis of the weather station data on the other hand, demonstrated inconsistent trends in minimum temperature with DTR decreasing at Pofadder but increasing at the other 4 stations. The difference between the two data sets could be attributed to weak correlations, especially for the measurement of minimum temperature, at the Springbok and Port Nolloth stations. However, two recent studies in South Africa8,46 found no clear consistent pattern with regards to changes in DTR and suggested that this topic requires further exploration and research.
Data from the five weather stations studied suggest that the occurrence of hot extremes has increased over Namaqualand, most notably for the Pofadder weather station, which is located more towards the interior of the country. There has been a clear increase in the frequency of hot days and a corresponding decrease in the frequency of cool days at each weather station which could indicate a shift in the statistical distribution of maximum temperatures in the region. The lack of statistically significant trends for the weather stations could be a result of the relatively short time series analysed (1982-2014). Noting this limitation, the direction of the trends presented here are in line with regional studies.1,8,9,46
Changes in rainfall are typically harder to detect because rainfall varies depending on location and from year to year.6,53 From the results presented here, no clear evidence exists for a significant change in mean annual rainfall, and the rainfall time series remains dominated by oscillating wet and dry conditions. This is consistent with previous studies19,54 which found no evidence for a significant change in mean annual rainfall over the Succulent Karoo. More recent studies for South Africa have detected decreases in rainfall and the number of rainfall days over parts of the country8 but overall, the trends are weak and non-significant.9
We did however demonstrate that rainfall has increased in summer (DJF) over the north-eastern region of Namaqualand. This could be attributed to either more favourable synoptic scale dynamics or local-scale land surface processes during these months.18 The reduction in winter rainfall (JJA), the main rainfall season in Namaqualand, was also noted by MacKellar et al.18 but the trend presented here is insignificant, thus the change could be considered negligible. An increase in summer rainfall could promote the development of more favourable conditions for C4 grasses which could threaten the persistence of endemic species.14
The strong inter-annual variability in rainfall in Namaqualand has been noted in previous studies19,54 but no trend in the frequency of drought and wet periods has been observed.17 Recent evidence suggests that El Nino Southern Oscillation (ENSO) modulates rainfall in the region with El Nino (La Nina) years being associated with higher (lower) than normal rainfall amounts in May, June and July.55 During ENSO events, the rain-bearing systems are larger in extent and are located further north, while during La Nina Southern Oscillation (LNSO), events are smaller and located further south.55
The latest projections from downscaled climate models indicate that rainfall is expected to decrease over Namaqualand in the future.9,56 Although these downscaled models are becoming increasingly sophisticated, there is still some uncertainty in rainfall projections at local scale.2,57 This mismatch between observed and predicted changes for Namaqualand has important implications for how changes in rainfall are perceived by on-the-ground managers as well as the kinds of management actions and adaptation response measures that are prioritised.
In Namaqualand, dewfalls and coastal fog are significant sources of moisture for the region and have been shown at times to exceed the amount rainfall during the wet season.58 Assessments of changes in these two key variables are required in order to have an improved understanding of future changes in water availability for the region. Very little is known about the variability and long term changes in coastal fog off the west coast of southern Africa but efforts are currently underway through a long term research programme, FogLife59, to address this gap.
As data on dewfalls and coastal fog are limited, we extended our analysis to include an assessment of trends in evapotranspiration. There were some clear spatial patterns in the trends in evapotranspiration over Namaqualand which appear to be influenced primarily by topography. Areas along the coastline and areas in the north-east of Namaqualand experienced the greatest increase in evapotranspiration, most notably during spring (SON) and autumn (MAM) respectively. The strongest warming was noted during spring and autumn and consequently, this observed increase in evapotranspiration is likely to be a direct result of an increase in temperature. The marked increase over the coastline in spring could however be indicative of a change in fog along the coast, but this finding requires more detailed analysis and monitoring of data on coastal fog. The higher altitude regions, on the other hand, have experienced a reduction in evapotranspiration, most notably in winter (JJA). A decrease over these areas could be explained by decreased wind speed and/or decreased solar radiation receipt as a result of increased cloud cover and atmospheric aerosol content.60 There are no previous studies on the trends in evapotranspiration for the Succulent Karoo or the Namaqualand region. In one of the only related studies, Hoffman et al.61 found that pan evaporation declined significantly at an average rate of 9.1 mm per annum at 16 weather stations located in the Cape Floristic Region of South Africa to the south of Namaqualand as a result of a decline in wind run.
The exceptional diversity of the Namaqualand has been attributed to firstly, the low but relatively predictable annual rainfall amounts and secondly, the moderate temperature regime throughout the year.32,36 The increase in temperature combined with the observed increases in evapotranspiration is of significant concern for Namaqualand especially as scenarios of future climate change project even stronger changes in the next decade. The succulent flora of Namaqualand evolved during a period when it was cooler and probably also wetter14,62 and thus higher temperatures are not likely to have been previously experienced in the region and could create conditions unsuitable for many species. Even if annual rainfall totals and coastal fog remain unchanged, future temperature increase will exert water stress on the plants in the region.58,62 Furthermore, the continued increase in temperature for the region has considerable implications for livestock heat stress as well as for other agricultural sectors, including the viability of certain pests and pathogens.63
Studies, mostly in the northern hemisphere, have shown that temperature changes have had a large impact on the timing of phenological events.64 The onset of flowering in Namaqualand generally occurs in spring and is triggered by a change in temperature,65 while the amount of rainfall during winter is usually responsible for numbers of flowers and duration of flowering.66 Persistent high temperatures, particularly towards the end of the growing season have shown to have a negative effect on plants in Namaqualand.66 The combined effects of increased water stress and high temperatures may pose significant challenges for Namaqualand.
Continued long-term monitoring of both changes in climate and vegetation in Namaqualand is essential in order to fully understand the extent of the impacts of increased temperature and changing patterns of water availability. The results presented in this paper provide a foundation for more detailed climate change assessments for the region as well as motivation for the development of adaptation responses and the continued investment in existing regional programmes. The gaps in weather information identified here, such as the lack coastal fog and dewfall data, need to be urgently addressed through a better network of weather stations as well as improved coordination across monitoring systems. Other key priorities for future research include detailed studies of the changes in diurnal temperature ranges on a broader regional scale and the continued monitoring of both climate observations and species-level changes in Namaqualand in order to test and refine climate change projections.
Authors' contributions
This paper is based on the work conducted by C.L.D as part of her MSc thesis at the University of Cape Town. M.T.H was the primary supervisor and W.R, the secondary supervisor.
References
1. New M, Hewitson B, Stephenson DB, Tsiga A, Kruger A, Manhique A, et al. Evidence of trends in daily climate extremes over southern and west Africa. J Geophys Res. 2006;111(7):D14102. http://dx.doi.org/10.1029/2005JD006289 [ Links ]
2. Stocker T, Qin D, Platner G. Climate Change 2013: The Physical Science Basis. Working Group I. Contribution to the Fifth Assessment Report of the Intergovernmental Panel on Climate Change. Summary for Policymakers. Cambridge: Cambridge University Press; 2013. [ Links ]
3. Mason S, Jury M. Climatic variability and change over southern Africa: A reflection on underlying processes. Prog Phys Geogr. 1997;21(1):23-50. http://dx.doi.org/10.1177/030913339702100103 [ Links ]
4. Mason SJ, Waylen PR, Mimmack GM, Rajaratnam B, Harrison JM. Changes in extreme rainfall events in South Africa. Clim Change. 1999;41(2):249-257. http://dx.doi.org/10.1023/A:1005450924499 [ Links ]
5. Hulme M, Doherty R, Ngara T, New M, Lister D. African climate change: 1900-2100. Clim Res. 2001;17(2):145-168. http://dx.doi.org/10.3354/cr017145 [ Links ]
6. Fauchereau N, Trzaska S, Rouault M, Richard Y Rainfall variability and changes in southern Africa during the 20th century in the global warming context. Nat Hazards. 2003;29(2):139-154. http://dx.doi.org/10.1023/A:1023630924100 [ Links ]
7. Kruger A, Shongwe S. Temperature trends in South Africa: 1960-2003. Int J Climatol. 2004;24(15):1929-1945. http://dx.doi.org/10.1002/joc.1096 [ Links ]
8. MacKellar N, New M, Jack C. Observed and modelled trends in rainfall and temperature for South Africa: 1960-2010. S Afr J Sci. 2014;110(7/8): Art. #2013-0353, 13 pages. http://dx.doi.org/10.1590/sajs.2014/20130353 [ Links ]
9. Department of Environmental Affairs. Long-Term Adaptation Scenarios Flagship Research Programme (LTAS) for South Africa: Climate trends and scenarios for South Africa. Pretoria: Department of Environmental Affairs; 2013. Available from: http://www.sanbi.org/sites/default/files/documents/documents/ltassummary-policy-makers2013high-res.pdf [ Links ]
10. Scholes RJ, Biggs RA. Ecosystem services in southern Africa: A region assessment. The regional-scale component of the southern African millennium ecosystem assessment. Pretoria: Council for Scientific and Industrial Research; 2004. [ Links ]
11. Gitay H, Suárez A, Watson RT, Dokken DJ. Climate change and biodiversity: Intergovernmental panel on climate change (IPCC) technical paper V. Geneva: IPCC; 2002. [ Links ]
12. Benjaminsen TA, Rohde R, Sjaastad E, Wisborg P, Lebert T. Land reform, range ecology, and carrying capacities in Namaqualand, South Africa. Ann Assoc Am Geogr. 2006;96(3):524-540. http://dx.doi.org/10.1111/j.1467-8306.2006.00704.x [ Links ]
13. Cousins B, Hoffman M, Allsopp N, Rohde R. A synthesis of sociological and biological perspectives on sustainable land use in Namaqualand. J Arid Environ. 2007;70(4):834-846. http://dx.doi.org/10.1016/j.jaridenv.2007.04.002 [ Links ]
14. Midgley G, Thuiller W. Potential vulnerability of Namaqualand plant diversity to anthropogenic climate change. J Arid Environ. 2007;70(4):615-628. http://dx.doi.org/10.1016/j.jaridenv.2006.11.020 [ Links ]
15. Rutherford MC, Midgley GF, Bond WJ, Powrie LW, Roberts R, Allsopp J. Plant biodiversity: Vulnerability and adaptation assessment. In: Kiker G, editor. Climate change impacts in southern Africa. Report to the National Climate Change Committee. Pretoria: Department of Environment Affairs and Tourism; 2000. [ Links ]
16. Broennimann O, Thuiller W, Hughes G, Midgley GF, Alkemade JR, Guisan A. Do geographic distribution, niche property and life form explain plants' vulnerability to global change? Global Change Biol. 2006;12(6):1079-1093. http://dx.doi.org/10.1111/j.1365-2486.2006.01157.x [ Links ]
17. Kelso C, Vogel C. The climate of Namaqualand in the nineteenth century. Clim Change. 2007;83(3):357-380. http://dx.doi.org/10.1007/s10584-007-9264-1 [ Links ]
18. MacKellar N, Hewitson B, Tadross M. Namaqualand's climate: Recent historical changes and future scenarios. J Arid Environ. 2007;70(4):604-614. http://dx.doi.org/10.1016/j.jaridenv.2006.03.024 [ Links ]
19. Hoffman M, Carrick P Gillson L, West A. Drought, climate change and vegetation response in the Succulent Karoo, South Africa. S Afr J Sci. 2009;105(1/2):54-60. http://dx.doi.org/10.1590/S0038-23532009000100021 [ Links ]
20. Chase BM, Meadows ME. Late Quaternary dynamics of southern Africa's winter rainfall zone. Earth-Sci Rev. 2007;84(3):103-138. http://dx.doi.org/10.1016/j.earscirev.2007.06.002 [ Links ]
21. Benito G, Thorndycraft V Rico M, Sánchez-Moya Y Sopena A, Botero B, et al. Hydrological response of a dryland ephemeral river to southern African climatic variability during the last millennium. Quatern Res. 2011;75(3):471-482. http://dx.doi.org/10.1016/j.yqres.2011.01.004 [ Links ]
22. Benito G, Botero BA, Thorndycraft VR, Rico M, Sánchez-Moya Y Sopena A, et al. Rainfall-runoff modelling and palaeoflood hydrology applied to reconstruct centennial scale records of flooding and aquifer recharge in ungauged ephemeral rivers. Hydrol Earth Syst Sci. 2010;7(6):9631-9660. [ Links ]
23. Weldeab S, Stuut J, Schneider R, Siebel W. Holocene climate variability in the winter rainfall zone of South Africa. Clim Past. 2013;9:2309-2356. http://dx.doi.org/10.5194/cpd-9-2309-2013 [ Links ]
24. Bourne A, Donatti C, Holness S, Midgley G. Climate change vulnerability assessment for the Namakwa District Municipality. Cape Town: Conservation South Africa; 2012. [ Links ]
25. Namakwa District Municipality. Integrated development plan 2012-2016. Springbok: Namakwa District Municipality; 2012. [ Links ]
26. New M, Lister D, Hulme M, Makin I. A high-resolution data set of surface climate over global land areas. Clim Res. 2002;21(1):1-25. http://dx.doi.org/10.3354/cr021001 [ Links ]
27. Hewitson BC, Crane RG. Gridded area-averaged daily precipitation via conditional interpolation. J Clim. 2005;18(1):41-57. http://dx.doi.org/10.1175/JCLI3246.1 [ Links ]
28. Mitchell TD, Jones PD. An improved method of constructing a database of monthly climate observations and associated high-resolution grids. Int J Climatol. 2005;25(6):693-712. http://dx.doi.org/10.1002/joc.1181 [ Links ]
29. Harris I, Jones P Osborn T, Lister D. Updated high-resolution grids of monthly climatic observations - the CRU TS3. 10 Dataset. Int J Climatol. 2013;34:623-642. http://dx.doi.org/10.1002/joc.3711 [ Links ]
30. Cowling R, Hilton-Taylor C. Plant biogeography, endemism and diversity. In: Dean WRJ, Milton SJ, editors. The Karoo: Ecological patterns and processes. Cambridge: University Press; 1999. p. 42-56. http://dx.doi.org/10.1017/CBO9780511541988.007 [ Links ]
31. Desmet P Namaqualand: A brief overview of the physical and floristic environment. J Arid Environ. 2007;70(4):570-587. http://dx.doi.org/10.1016/j.jaridenv.2006.11.019 [ Links ]
32. Cowling R, Esler K, Rundel P. Namaqualand, South Africa - an overview of a unique winter-rainfall desert ecosystem. Plant Ecol. 1999;142(1):3-21. http://dx.doi.org/10.1023/A:1009831308074 [ Links ]
33. Rohde RF, Benjaminsen TA, Hoffman M. Land reform in Namaqualand: -Poverty alleviation, stepping stones and 'economic units'. Land reform and agrarian change in southern Africa series; no. 16. Bellville: Programme for Land and Agrarian Studies; 2001. [ Links ]
34. Hoffman MT, Cousins C, Meyer T, Petersen A, Hendriks H. Historical and contemporary agricultural land use and the desertification of the Karoo. In: Dean WRJ, Milton S, editors. The Karoo: Ecological patterns and processes. Cambridge: Cambridge University Press; 1999. http://dx.doi.org/10.1017/CBO9780511541988.022 [ Links ]
35. Tyson PD, Preston-Whyte RA. The weather and climate of southern Africa. Cape Town: Oxford University Press; 2000. [ Links ]
36. Desmet P Cowling R. The climate of the Karoo - a functional approach. In: Dean WRJ, Milton S, editors. The Karoo: Ecological patterns and processes. Cambridge: University press; 1999. p. 3-16. http://dx.doi.org/10.1017/CBO9780511541988.004 [ Links ]
37. Driver A, Maze K. The Succulent Karoo ecosystem plan (SKEP): An introduction to SKEP Veld Flora 2002; 88(1):12-13. [ Links ]
38. Hulme M. A 1951-1980 global land precipitation climatology for the evaluation of general circulation models. Clim Dyn. 1992;7(2):57-72. http://dx.doi.org/10.1007/BF00209609 [ Links ]
39. Houghton JT, Ding Y Griggs DJ, Noguer M, Van der Linden PJ, Dai X, et al. Clim Change. 2001: The Scientific Basis. Cambridge: Cambridge University Press; 2001. [ Links ]
40. Mu Q, Zhao M, Running SW. Improvements to a MODIS global terrestrial evapotranspiration algorithm. Remote Sens Environ. 2011;115(8):1781-1800. http://dx.doi.org/10.1016/j.rse.2011.02.019 [ Links ]
41. Monteith J. Evaporation and environment. Sym Soc Exp Biol. 1965;19:205-223. [ Links ]
42. A rank-invariant method of linear and polynomial regression analysis, Part 3. P K Ned Akad A Math; 1950. [ Links ]
43. Sen PK. Estimates of the regression coefficient based on Kendall's tau. J Am Stat Assoc. 1968;63(324):1379-1389. http://dx.doi.org/10.1080/01621459.1968.10480934 [ Links ]
44. Neeti N, Eastman JR. A contextual Mann-Kendall approach for the assessment of trend significance in image time series. Transac GIS. 2011;15(5):599-611. http://dx.doi.org/10.1111/j.1467-9671.2011.01280.x [ Links ]
45. Kendall MG. A new measure of rank correlation. Biometrika. 1938;30(1/2):81-93. http://dx.doi.org/10.1093/biomet/30.1-2.81 [ Links ]
46. Kruger A, Sekele S. Trends in extreme temperature indices in South Africa: 1962-2009. Int J Climatol. 2013;33(3):661-676. http://dx.doi.org/10.1002/joc.3455 [ Links ]
47. Kruger A. Observed trends in daily precipitation indices in South Africa: 1910-2004. Int J Climatol. 2006;26(15):2275-2285. http://dx.doi.org/10.1002/joc.1368 [ Links ]
48. Zhang X, Yang F. RClimDex (1.0) User Guide. Downsview: Environment Canada, Climate Research Branch; 2004. [ Links ]
49. Fox S, Hoffman M, Hoare D. The phenological pattern of vegetation in Namaqualand, South Africa and its climatic correlates using NoAa-AVHRR NDVI data. S Afr Geogr J. 2005;87(2):85-94. http://dx.doi.org/10.1080/03736245.2005.9713831 [ Links ]
50. Easterling DR, Horton B, Jones PD, Peterson TC, Karl TR, Parker DE, et al. Maximum and minimum temperature trends for the globe. Science. 1997;277(5324):364-367. http://dx.doi.org/10.1126/science.277.5324.364 [ Links ]
51. Karl TR, Jones PD, Knight RW, Kukla G, Plummer N, Razuvayev V, et al. A new perspective on recent global warming: Asymmetric trends of daily maximum and minimum temperature. Bull Amer Meteor Soc. 1993;74:1007-1023. http://dx.doi.org/10.1175/1520-0477(1993)074<1007:ANPORG>2.0.CO;2 [ Links ]
52. Blunden J, Arndt DS. State of the Climate in 2011. Bull Amer Meteor Soc. 2012;93:S1-S282. http://dx.doi.org/10.1175/2012BAMSStateoftheClimate.1 [ Links ]
53. Hoffman T, Vogel C. Climate change impacts on African rangelands. Rangelands. 2008;30(3):12-17. http;//dx.doi.org/10.2111/1551-501X(2008)30[12:CCIOAR]2D.CO;2 [ Links ]
54. Haensler A, Hagemann S, Jacob D. Climate history of Namibia and western South Africa. In: Jürgens N, Schmiedel U, Hoffman MT, editors. Biodiversity in southern Africa: Patterns and Processes at Regional Scale Vol 2. Göttingen & Windhoek: Klaus Hess Publishers; 2010. p. 2. [ Links ]
55. Philippon N, Rouault M, Richard Y Favre A. The influence of ENSO on winter rainfall in South Africa. Int J Climatol. 2011;32(15):2333-2347. http://dx.doi.org/10.1002/joc.3403 [ Links ]
56. Engelbrecht F, McGregor J, Engelbrecht C. Dynamics of the Conformal-Cubic Atmospheric Model projected climate-change signal over southern Africa. Int J Climatol. 2009;29(7):1013-1033. http://dx.doi.org/10.1002/joc.1742 [ Links ]
57. Knutti R, Sedlácek J. Robustness and uncertainties in the new CMIP5 climate model projections. Nature Clim Change. 2013;3(4):369-373. http://dx.doi.org/10.1038/nclimate1716 [ Links ]
58. Schmiedel U, Dengler J, Etzold S. Vegetation dynamics of endemic-rich quartz fields in the Succulent Karoo, South Africa, in response to recent climatic trends. J Veg Sci. 2012;23(2):292-303. http://dx.doi.org/10.1111/j.1654-1103.2011.01346.x [ Links ]
59. FogLife Colloquium. FogLife Colloquium Proceedings, 2014 Nov 11-13; Gobabeb, Namibia. Available from: http://www.gobabebtrc.org/images/2014_FogLife_Colloquium_Proceedings.pdf; [ Links ]
60. Eamus D, Palmer AR. Is climate change a possible explanation for woody thickening in arid and semi-arid regions? Int J Ecol. 2008;2007:1-5. http://dx.doi.org/10.1155/2007/37364 [ Links ]
61. Hoffman MT, Cramer MD, Gillson L, Wallace M. Pan evaporation and wind run decline in the Cape Floristic Region of South Africa (1974-2005): Implications for vegetation responses to climate change. Clim Change. 2011;109(3):437-452. http://dx.doi.org/10.1007/s10584-011-0030-z [ Links ]
62. Musil C, Van Heerden P Cilliers C, Schmiedel U. Mild experimental climate warming induces metabolic impairment and massive mortalities in southern African quartz field succulents. Environ Exp Bot. 2009;66(1):79-87. http://dx.doi.org/10.1016/j.envexpbot.2008.11.008 [ Links ]
63. Archer E, Oettlé N, Louw R, Tadross M. 'Farming on the edge' in arid western South Africa: Climate change and agriculture in marginal environments. Geography. 2008;93:98-107. [ Links ]
64. Walther G, Post E, Convey P Menzel A, Parmesan C, Beebee TJ, et al. Ecological responses to recent climate change. Nature. 2002;416(6879):389-395. http://dx.doi.org/10.1038/416389a [ Links ]
65. Van Rooyen M, Theron G, Grobbelaar N. Phenology of the vegetation in the Hester Malan Nature Reserve in the Namaqualand Broken Veld: 2. The therophyte population. J S Afr Botany. 1979;45:433-452. [ Links ]
66. Steyn H, Van Rooyen N, Van Rooyen M, Theron G. The phenology of Namaqualand ephemeral species. The effect of water stress. J Arid Environ. 1996;33(1):49-62. http://dx.doi.org/10.1006/jare.1996.0045 [ Links ]
 Correspondence:
Claire Davis
Natural Resources and the Environment, Council for Scientific and Industrial Research
PO Box 320, Stellenbosch 7599, South Africa. cdavis@csir.co.za
Received: 05 June 2015
Revised: 05 Aug. 2015
Accepted: 23 Aug. 2015

