


Serviços Personalizados
Artigo
 Inglês (pdf)
 Artigo em XML
 Referências do artigo
Indicadores

Links relacionados
-
 Citado por Google
 -
 Similares em Google
Compartilhar

 Permalink
South African Journal of Science
versão On-line ISSN 1996-7489
versão impressa ISSN 0038-2353
S. Afr. j. sci. vol.112 no.3-4 Pretoria Mar./Abr. 2016
http://dx.doi.org/10.17159/sajs.2016/20150249
REVIEW ARTICLE
Use and usefulness of measures of marine endemicity in South Africa
Charles L. GriffithsI; Tamara B. RobinsonII
IDepartment of Biological Sciences and Marine Research Institute, University of Cape Town, Cape Town, South Africa
IIDepartment of Botany and Zoology, Stellenbosch University, Stellenbosch, South Africa
ABSTRACT
Numerous authors have cited numbers, or proportions, of endemic species within South(ern) African marine taxa, but comparisons between these statistics are confounded by differing definitions of regional boundaries and differences among data sets analysed. These have resulted in considerable variations in published endemicity data, even within the same taxonomic group. We tabulated and compared key endemicity statistics for regional marine taxa and explained biases in the data sets. The most comprehensive data sets available give overall marine endemicity within the national boundaries of South Africa as 28-33%, but estimates within individual taxa making up these totals vary enormously, from 0% (Aves, Mammalia) to over 90% (Polyplacophora). We also examined published data documenting localised endemicity patterns around the coastline. These consistently show the highest numbers of endemics occurring along the South Coast. There are logical biogeographical reasons to expect this trend, but endemicity rates are also inherently biased by distance from defined political boundaries and by differing sampling effort locally and in neighbouring countries. Range restriction is considered a better measure of conservation status than endemicity, although it is far less often used and yields very different patterns. Properly and consistently calculated measures of national endemicity do, however, retain significant conservation value, and the rates for South African marine biota are high relative to other regions globally, being exceeded only by New Zealand and Antarctica. It is important that when citing endemicity statistics, researchers and conservation managers understand the definitions used and the many constraints under which these measures are derived.
Keywords: Endemic species; range restriction; biodiversity; marine conservation; taxonomy
Introduction
Endemicity is a widely employed concept, used both as a proxy for range restriction, and as an indicator of the uniqueness and conservation value of the fauna and/or flora within a particular geographical (usually politically defined) region. For example, high proportions of endemicity within various South African taxa have been cited in support of the region being recognised as a 'biodiversity hotspot of international importance'.1 Despite its wide use, endemicity is, however, a loosely defined concept - the usual dictionary definition being some variation of 'native or limited to a certain region'.
In practice, the most commonly used boundaries for 'the region' are national political borders, hence the most common regional usage is 'endemic to South Africa'. However, because authors are free to define their own boundaries, these can extend to incorporate wider politically defined regions ('southern Africa'), or a region defined by latitudinal boundaries ('Africa South of 20S') - see marine examples below. Many authors also report rates of endemism for sub-regions within the country, both for biomes, such as the 'thicket biome'2, 'succulent karoo' or 'fynbos'3, or for narrower regions, such as 'north-eastern Transvaal Escarpment'4, 'southern Langeberg Mountains'5, or 'the Cape Peninsula'6. In these cases, the numbers reported are of species globally unique to that biome or site (i.e. endemic to the defined region).
Another group of authors divides the region into grid squares7,8, or the coastline into 50 km or 100 km units9,10, then report on the numbers of endemic species present in each square or unit. It is important to note that what is then reported is numbers of species endemic to South Africa that are found in each square/unit (i.e. the same endemic species are reported for multiple squares or units). A few marine authors10,11 do subsequently plot numbers of species unique or endemic to only one to three coastal units ('range restricted endemics'). These two methods, of course, yield very different numbers of endemics and geographical patterns of endemicity.
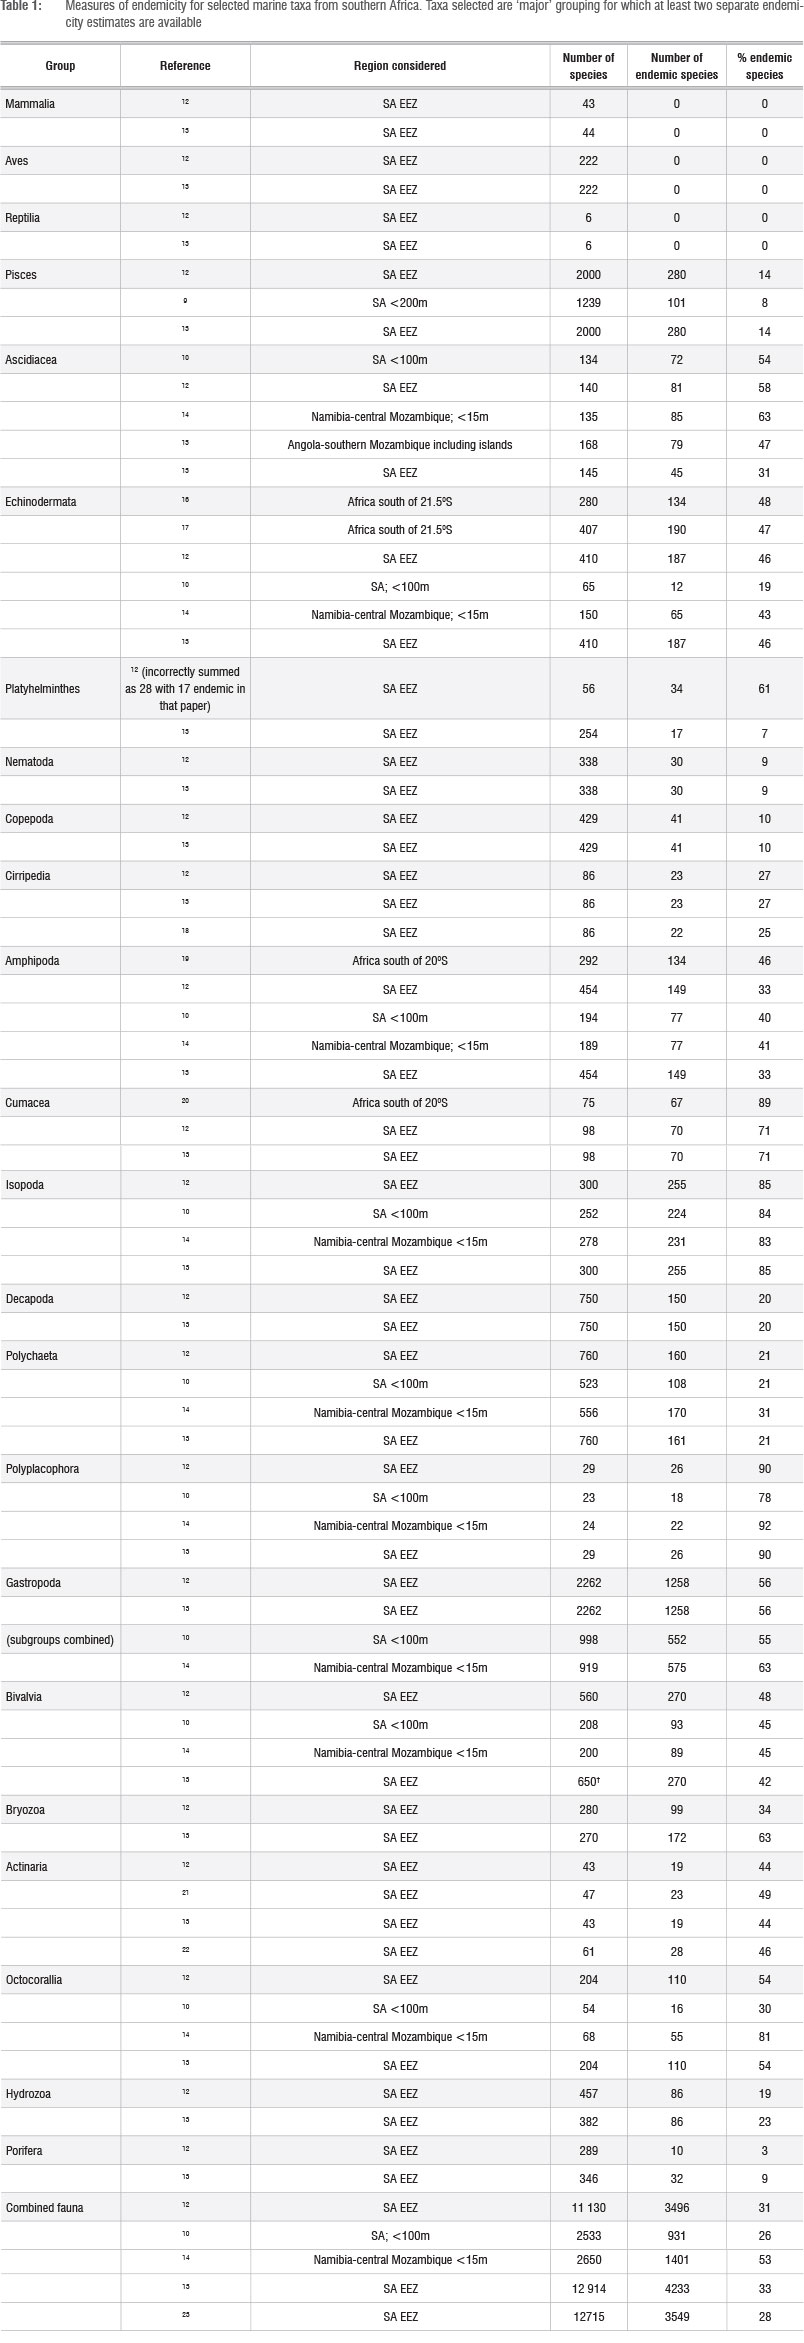
The marine fauna of South Africa is no exception with regard to these confusions, and many authors have published endemicity data for various taxa in the region (see Table 1), but have used a variety of definitions of endemicity, greatly complicating the interpretation of these data. The most commonly used definition, and that most comparable to data from other countries, is that of species restricted to the exclusive economic zone (EEZ) of continental South Africa. However, given the continuity of the South African EEZ with those of adjacent countries, the important role South African researchers have historically played in taxonomic research in the wider region, and other political considerations (e.g. Namibia having long been a protectorate of South Africa), several other definitions have been used. These include latitudinal definitions ('Africa south of 20S' or 'Africa south of the Tropic of Capricorn'), or wider definitions of a 'southern African' region - most often including the whole of Namibia, but only parts of Mozambique. Some studies also restricted their analyses to some maximum depth, while others included the entire EEZ. Clearly, each of these definitions results in different numerical measures of endemicity, even when based on the same data sets.
Actual levels of endemicity are also subject to constant change over time in response to developments in taxonomic knowledge, both within and outside of the region under consideration. Simply put, new taxonomic data from within the study region will increase endemicity when new species are described from within the study area, but will reduce endemicity when species already known elsewhere are newly reported there. Conversely, studies done outside of the study area will depress endemicity levels if they record species previously thought to be endemic to South(ern) Africa. Keeping track of these changes requires a high level of taxonomic expertise and many regional publications have in fact based their analysis on historical data, derived from dated taxonomic monographs or museum catalogues, without correcting these to take account of more recent taxonomic revisions and discoveries, particularly those carried out outside of the study region. Such estimates must thus be treated with caution.
Another group of studies have analysed how the numbers, or proportions, of endemic marine species vary around a series of equal 50 km or 100 km units distributed around the length of the South(ern) African coastline. Such studies include those on fish4 and on various invertebrate taxa.10,11,13. In addition to the biases and constraints already mentioned, there is also an inherent bias in such 'within region' analyses, in that such levels of endemicity are partially determined by distance away from the defined boundary. In other words, if all species had randomly-centred 500 km ranges, all species from sites more than 500 km from the defined boundary would by necessity be considered endemic. In this context, measures of range-restriction may be more indicative of rarity or conservation status than the far more commonly-used endemicity, although they too suffer from biases related to sampling effort, as discussed below.
However flawed they are in biological terms, endemicity statistics do still have conservation value, as they do give an indication of the number (or proportion) of described species that fall under the responsibility of a particular national government or conservation agency, or of the proportions that are conserved within existing protected areas10. Thus a critical appraisal of the use of endemicity statistics is necessary if we are to ensure that prioritisation of conservation goals is underpinned by sound scientific inputs, of which endemicity is an important example.
The South African marine environment provides a particularly good, and unusual, model system to undertake such an analysis. Firstly, a large number of regional endemicity measures have been published and (unusually in the global context) a variety of definitions have been applied to delimit the region under consideration. The South(ern) African marine environment is also a good model to analyse in that the coastline in almost linear, with very few inlets, bays or islands, plus almost all samples have been collected within a fairly narrow band adjacent to that coastline.13 This means that it is easy to re-analyse the data in terms of linear distance from the boundary, or in terms of linear measures of range-restriction.
In this paper we aim to explore the use and usefulness of the concept of endemicity, as applied to the marine fauna of South(ern) Africa. We do this in several ways: firstly, by reviewing previous studies that have calculated endemicity and comparing the data so obtained in the light of the definitions and data sources used and, secondly by discussing factors that affect reported levels of endemicity. Lastly, we compare measured marine endemicity statistics in South Africa with those from other comparable regions and debate the usefulness of alternative measures.
Existing measures of endemicity
Endemicity measures have been published for a large variety of South(ern) African marine taxa, of which we have reproduced only a selected subset of 'major' groups, especially focussing on those for which multiple estimates are available (Table 1). The tremendous variation in absolute measures of endemicity (from zero in several vertebrate taxa, to over 80% in Cumacea, Isopoda and Polyplacophora) is notable. There is also considerable variability between estimates made for the same taxonomic group, but by different authors. These may have resulted from inclusion of different data sets, but most obviously vary with the definition of the study area, with larger study areas generally resulting in the inclusion of the ranges of more species and thus in higher endemicity levels. For some taxa the various estimates are identical, as either the exact same data set has been analysed, or because later authors have cited figures directly from earlier ones, without any new analyses. In both cases, inaccuracies are likely to result, as in reality, new research both inside and outside the study area will have resulted in changing proportions of endemics, as discussed above.
Comparing groups, one would expect pelagic taxa to have much lower endemicity levels that benthic ones, as pelagic taxa are far more mobile. This certainly applies to some taxa, for example, the Copepoda, the majority of which are pelagic, have much lower endemicity figures than most benthic invertebrate groups. Indeed, if pelagic taxa within the Copepoda are separated from benthic ones, this trend becomes dramatic - pelagic copepods being only 1% endemic and benthic ones 49% endemic.12 The same is true within the Amphipoda, which also contain both pelagic taxa (Hyperiidea), which are only 1% endemic, and benthic taxa (Gammaridea and Caprellidea), which together show 45% endemicity.12 One might also expect that broadcast spawning taxa might have lower endemicity levels that brooding ones, but clear distinctions among benthic taxa, based on life history, are not apparent within these data sets. For example, while endemicity levels among some brooding taxa, such as Cumacea (71-89%) and Isopoda (83-85%) are, as expected, exceptionally high, equally high figures are evident among (mainly) broadcast spawning groups, such as Polyplacophora (78-92%) (Table 1). Conversely, Echinodermata (generally broadcast spawners) have lower endemicity ratios (19-48%), similar to the brooding Amphipoda (33-46%).
The states of taxonomic knowledge, both within the region of study and in adjoining areas, have major impacts on reported levels of endemicity. Clearly, if few species have been described from within a study region, there can be few endemic species reported from that region. Thus one would expect taxa that have been poorly studied within South(ern) Africa to have artificially depressed levels of reported endemicity. This is true, for example, for Nematoda at 9%. Conversely, for well-studied taxa, most of the actual endemic species present would have been discovered and described and hence endemicity ratios should be higher (and more realistic). These expectations are validated when plotting the relationship between numbers of endemic species and the state of knowledge of various marine taxa for South Africa (Figure 1). Note that this relationship breaks down for the few taxa in the highest state of knowledge category, simply because these include only vertebrate groups and mangroves, which comprise large, highly mobile species with large ranges, and brown algae, for which no endemicity data are available.13 While large size seems to equate with low endemicity in those taxa, as is also reported by Costello et al.24, only a very weak positive correlation between size and range was observed among South African invertebrate taxa.14

Additional biases in reported levels of endemicity are also created by state of knowledge in adjoining regions. Thus if the fauna, or a particular taxonomic group, is well known within the study area, but poorly know in adjoining regions, this artificially inflates the reported endemicity ratio, because species whose real ranges extend into adjoining regions are unlikely to have been detected there. Conversely, if the fauna in adjoining regions is well known, then species with broad ranges will most likely have been detected there, and endemicity within the study area will be lower (and more realistic).
An interesting example of this is the comparison between the biologically similar and closely related Amphipoda and Isopoda (Table 1). The former are well studied in Madagascar25,26 and have a relatively low endemicity ratio, while the Isopoda, which are well known in South Africa,27 but poorly studied elsewhere in Africa, have a much higher apparent proportion of 'endemic' species.
The effects of increased study area on the overall endemicity ratio of the fauna as a whole is particularly clear, with Gibbons et al.12, Awad et al.10, Costello et al.23 and Griffiths et al.13 giving similar overall marine endemicity estimates for South Africa (31%, 26%, 28% and 33% respectively), while Scott14 gives a much higher estimate of 53% for the inclusive southern African region (Namibia to central Mozambique). Note, however, that even this comparison is not based on identical data sets, as each of these studies included a somewhat different number and mix of taxa, and both Awad et al.10 and Scott14 considered only coastal fauna, whereas Gibbons et al.12, Costello et al.23 and Griffiths et al.13 examined the entire EEZ (and derived much of their data from the same sources). When we look at individual taxa, the trend remains for higher endemicity whenever a wider area is examined. For example, 55-56% endemicity for South African Gastropoda vs 63% for the wider southern African region; 21% of South African Polychaeta vs 31-36% for the wider region; 71% vs 89% for Cumacea, etc. There are, however, exceptions, such as Primo & Vazque15, who give a lower endemicity estimate of 47% for the Ascideacea of the wider Angola-Mozambique region than either Gibbons et al.12 or Awad et al.10 (but not Griffiths et al.)13 provide for South Africa alone (58%, 54% and 31% respectively). This can only be the result of different data sets being used in these analyses.
Several studies have reported on geographical patterns of endemicity within the region,9,10,11 plotting patterns of both species richness and endemicity within particular taxa as one moves around the coastline of South(ern) Africa (Figure 2). The usual findings are that numbers (and proportions) of endemic species peak along the South Coast. There are good biological reasons to expect this trend, in that the warm temperate South Coast is both situated exclusively within the political boundaries of South Africa and is geographically isolated from other warm temperate regions (both features which promote high endemicity). By contrast, the cool temperate west coast and more tropical east coast bioregions are contiguous with similar climatic regions in adjacent countries, meaning that species living in those habitats are likely to range across political borders and hence not be endemic.

It is important to note here, though, that endemicity is strongly influenced simply by distance from the political borders of South Africa and is not a good indicator of either range restriction or rarity. For example, a species with a short range that happens to straddle a political border will not be endemic to either country, but may have a very restricted range and hence require conservation attention. Conversely, one that is endemic can have a much larger range (of up to 3000 km in this case) and hence be of less conservation concern. Endemicity along the South Coast of South Africa is thus inflated simply because this region is furthest from the political borders used to define endemicity in this region.
Marine endemicity rates in South Africa in the global context
Table 2 shows known rates of marine endemicity in a variety of global regions, as summarised by Costello et al.23 It is notable that South Africa supports the third highest proportion of endemic species among listed regions, despite having one of the smaller seabed areas and supporting comparatively few described species, relative to some other listed regions. The reasons for these pattern are complex and involve not only 'real' factors, such as the size, isolation and taxonomic uniqueness of the fauna of regions under consideration, but artefacts associated with sampling and taxonomic effort, both in the region in question and in neighbouring areas.
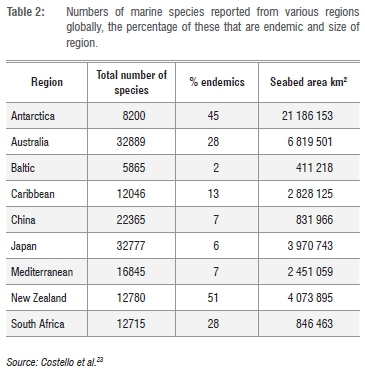
Regions that are large and/or isolated (Australia, New Zealand, Antarctica) would be expected to, and do, have high levels of endemicity. Conversely, those with relatively small areas and/or which lie adjacent to other well-studied areas (China, Japan, Baltic, Mediterranean, Caribbean) have relatively low endemicity. South Africa might appear to be an outlier here, as it has a relatively small sea area, but a high endemicity ratio. However, it does incorporate an 'island' of warm temperate water that is very isolated geographically, from other warm temperate regions, and which hosts the majority of the endemic species. It is also something of an 'island of taxonomic expertise' in a much wider African region, within which marine biodiversity is poorly documented, and this tends to (artificially) elevate rates of endemicity.
Is range restriction a better measure than endemicity?
The problems outlined above, with respect to accurate determination of endemicity rates, beg the question whether endemicity is a useful concept for managers. Clearly, it does have political importance in that the conservation of endemic species falls exclusively under the jurisdiction of a particular nation's conservation authorities. It is also a term the public associate with and which has implications for funding of conservation efforts through eco-tourism, etc.
On the other hand, range restriction and population size or rarity (which are not dealt with here, are more difficult to measure and more rarely reported in marine taxa) are much more important concepts in terms of viability and vulnerability of the population of a given species. Studies by Awad et al.10 and Scott et al.11 have plotted the geographic distributions of range-restricted species along the South Africa coast, showing range-restricted forms to be strongly localised relative to endemic ones. Specifically, range-restricted marine species tend to be strongly concentrated at focal sites in the vicinities of Cape Point, Port Elizabeth and to a lesser extent, Durban (Figure 2a). Scott et al.11 suggest that, as these sites tend to correspond with biogeographic breaks, these peaks may represent species living at the ecotone between biogeographic provinces. However, these specific locations coincidentally also fall at the locations of the three major coastal centres of marine research in the country and are, therefore, also sites of enhanced sampling effort and species discovery. As these well-sampled areas thus contain 'extra' species not reported in adjacent sectors of coast (Figure 2), it is it thus inevitable that these 'extra' species will appear to be range-restricted to those sites. Moreover, while the intensely-sampled area around Cape Point does indeed coincide exactly with the boundary between the Southern Benguela and Agulhas ecoregions,28 the peaks around Port Elizabeth and Durban are offset from biogeographic breaks by at least 300 km. This strongly suggests that at least these peaks in locally endemic species are largely a function of differences in sampling effort, rather than true range restriction. The larger peak around Cape Point may be more 'real' as it is situated in a region with unique ecotonal characteristics, but the greatly enhanced sampling effort at this site is certainly responsible for at least some of these apparently 'localised' species.
Acknowledgements
Financial support for this research was provided by a National Research Foundation grant to CLG, though the SeaKeys programme.
Authors' Contributions
The paper was a joint effort by C.L.G. and T.B.R. C.L.G. conceived the idea for the paper and wrote the original draft. T.B.R. edited and added to the draft and drew the figures. Being a review, there were no original experiments, only data extraction and interpretation which we did together.
References
1. Endangered Wildlife Trust. The Biodiversity of South Africa 2002: Indicators, trends and human impacts. Cape Town: Struik Publishers; 2002. [ Links ]
2. Vlok JHJ, Euston-Brown DIW, Cowling RM. Acocks' Valley bushveld 50 years on: New perspectives on the delimitation, characterisation and origin of subtropical thicket vegetation. S Afr J Bot. 2003;69:27-51. http://dx.doi.org/10.1016/S0254-6299(15)30358-6 [ Links ]
3. Verboom GA, Archibald JK, Bakker FT, Bellstedt DU, Conrad F, Dreyer LL, et al. Origin and diversification of the Greater Cape flora: Ancient species repository, hot-bed of recent radiation, or both? Molec Phylogenetics Evol. 2009;51:144-53. http://dx.doi.org/10.1016/j.ympev.2008.01.037 [ Links ]
4. Matthews WS, Van Wyk AE, Bredenkamp GJ. Endemic flora of the northeastern Transvaal escarpment, South Africa. Biol Conserv. 1993;63:83-94. http://dx.doi.org/10.1016/0006-3207(93)90077-E [ Links ]
5. McDonald DJ, Cowling RM. Towards a profile of an endemic mountain fynbos flora: Implications for conservation. Biol Conserv. 1995;72:1-12. http://dx.doi.org/10.1016/0006-3207(94)00030-T [ Links ]
6. Picker, MD, Samways MJ. Faunal diversity and endemicity of the Cape Peninsula, South Africa - a first assessment. Biodiver Conserv. 1996;5:591-606. http://dx.doi.org/10.1007/BF00137611 [ Links ]
7. Skelton PH, Cambray JA, Lombard AT, Benn GA. Patterns of distribution and conservation of freshwater fishes in South Africa. S Afr J Zool. 1995;30:71-81. http://dx.doi.org/10.1080/02541858.1995.11448375 [ Links ]
8. Drinkrow DR, Cherry MI. Anuran distribution, diversity and conservation in South Africa, Lesotho and Swaziland. S Afr J Zoo. 1995;30:82-90. http://dx.doi.org/10.1080/02541858.1995.11448376 [ Links ]
9. Turpie JK, Beckley LE, Katua SM. Biogeography and the selection of priority areas for conservation of South African coastal fish. Biol Conserv. 2000;92:59-72. http://dx.doi.org/10.1016/S0006-3207(99)00063-4 [ Links ]
10. Awad AA, Griffiths CL, Turpie JK. Distribution of South African marine invertebrates applied to the selection of priority conservation areas. Divers Distrib. 2002;8:129-145. http://dx.doi.org/10.1046/j.1472-4642.2002.00132.x [ Links ]
11. Scott RJ, Griffiths CL, Robinson TB. Patterns of endemicity and range-restriction among southern African coastal marine invertebrates. Afr J Mar Sci. 2012;34:341-348. http://dx.doi.org/10.2989/1814232X.2012.725284 [ Links ]
12. Gibbons MJ. The taxonomic richness of South Africa's marine fauna - a crisis at hand. S Afr J Sci. 1999;95:8-12. [ Links ]
13. Griffiths CL, Robinson TB, Lange L, Mead A. Marine biodiversity in South Africa - state of knowledge, spatial patterns and threats. PloS ONE 2010;5(8):e123008. http://dx.doi.org/10.1371/journal.pone.0012008 [ Links ]
14. Scott R. 2009. Biogeographical patterns in southern African marine invertebrates [MSc dissertation]. Cape Town: University of Cape Town; 2009. [ Links ]
15. Primo C, Vázquez E. Zoogeography of the southern African ascidian fauna. J Biogeogr. 2004;31:1987-2009. http://dx.doi.org/10.1111/j.1365-2699.2004.01144.x [ Links ]
16. Clark AM, Courtman-Stock J. The Echinoderms of Southern Africa. London: British Museum (Natural History); 1976. [ Links ]
17. Thander AS. Zoogeography of the southern African echinoderm fauna. S Afr J Zoo. 1989;24:311-318. [ Links ]
18. Biccard A. Taxonomy, systematics and biogeography of South African Cirrepedia (Thoracica) [MSc dissertation]. Cape Town: University of Cape Town; 2012. [ Links ]
19. Griffiths CL. The gammaridean and caprellid Amphipoda of southern Africa [PhD thesis]. Cape Town: University of Cape Town; 1974. [ Links ]
20. Day JA. Southern African Cumacea [PhD thesis]. Cape Town: University of Cape Town; 1978. [ Links ]
21. Acuna FH, Griffiths CL. Species richness, endemicity and distribution patterns of South African sea anemones (Cnidaria: Actiniaria & Corallimorpharia). Afr Zool. 2004;39(2):193-200. [ Links ]
22. Laird CM. Taxonomy, systematics and biogeography of South African Actiniaria and Corallimorpharia [PhD thesis]. Cape Town: University of Cape Town; 2013. [ Links ]
23. Costello MJ, Coll M, Danovaro R, Halpin P Ojaveer H, Miloslavich P. A census of marine biodiversity knowledge, resources and future challenges. PLoS ONE 2010;5(8):e12110. http://dx.doi.org/10.1371/journal.pone.0012110 [ Links ]
24. Costello MJ, May RM, Stork NE. Can we name Earth's species before they go extinct? Science. 2013;339(6118):413-416. http://dx.doi.org/10.1126/science.1230318 [ Links ]
25. Ledoyer M. Crustacés amphipodes gammariens. Familles des Acanthonoto-zomatidae à Gammaridae [Gammaridean amphipod crustaceans. Families Acanthonotozomatidae to Gammaridae]. Faune de Madagascar. 1982;59:1-598. French. [ Links ]
26. Ledoyer M. Crustacés amphipodes gammariens. Familles des Haustoriidae à Vitjazianidae [Gammaridean amphipod crustaceans. Families Haustoriidae to Vitjazianidae]. Faune de Madagascar. 1986;59:599-1112. French. [ Links ]
27. Kensley B. Guide to the marine isopods of Southern Africa. Cape Town: Trustees of the South African Museum; 1978. [ Links ]
28. Sink K, Holness S, Harris L, Majiedt P Atkinson L, Robinson T, et al. National Biodiversity Assessment 2011: Technical Report. Volume 4: Marine and Coastal Component. Pretoria: South African National Biodiversity Institute; 2012. [ Links ]
 Correspondence:
Charles Griffiths
Department of Biological Sciences and Marine Research Institute
University of Cape Town
Private Bag X3, Rondebosch 7701, Cape Town. South Africa
Charles.Griffiths@uct.ac.za
Received: 07 July 2015
Revised: 02 Oct. 2015
Accepted:08 Oct. 2015

