


Servicios Personalizados
Articulo
 Inglés (pdf)
 Articulo en XML
 Referencias del artículo
Indicadores

Links relacionados
-
 Citado por Google
 -
 Similares en Google
Compartir

 Permalink
South African Journal of Science
versión On-line ISSN 1996-7489
versión impresa ISSN 0038-2353
S. Afr. j. sci. vol.112 no.1-2 Pretoria ene./feb. 2016
http://dx.doi.org/10.17159/sajs.2016/20150094
RESEARCH ARTICLE
Indicative hazard profile for strong winds in South Africa
Andries C. KrugerI; Dechlan L. PillayII; Mark van StadenII
ISouth African Weather Service, Pretoria, South Africa
IIEarly Warnings and Capability Management Systems, National Disaster Management Centre, Centurion, South Africa
ABSTRACT
While various extreme wind studies have been undertaken for South Africa for the purpose of, amongst others, developing strong wind statistics, disaster models for the built environment and estimations of tornado risk, a general analysis of the strong wind hazard in South Africa according to the requirements of the National Disaster Management Centre is needed. The purpose of the research was to develop a national profile of the wind hazard in the country for eventual input into a national indicative risk and vulnerability profile. An analysis was undertaken with data from the South African Weather Service's long-term weather stations to quantify the wind hazard on a municipal scale, taking into account that there are more than 220 municipalities in South Africa. South Africa is influenced by various strong wind mechanisms occurring at various spatial and temporal scales. This influence is reflected in the results of the analyses which indicated that the wind hazard across South Africa is highly variable, spatially and seasonally. A general result was that the strong wind hazard is highest from the southwestern Cape towards the central and eastern parts of the Northern Cape Province, and the southeastern parts of the coast as well as the eastern interior of the Eastern Cape Province. On a seasonal basis, the southern parts of the country showed similar magnitudes of relative wind hazard throughout the year. However, further north, a strong seasonal component was evident, with lowest risk of strong winds during autumn and winter, and highest risk in spring and summer when convective activity is strongest.
Keywords: wind hazard; disaster management; strong wind mechanisms; seasonal winds
Introduction
While various extreme wind studies have been undertaken for South Africa for the purpose of, amongst others, developing statistics and disaster models for the built environment and estimation of tornado risk,1-10 a general analysis of the strong wind hazard in South Africa according to the requirements of the National Disaster Management Centre (NDMC) is needed.
In South Africa, the NDMC is mandated to oversee the implementation of the Disaster Management Act, 200211 and the National Disaster Management Framework 200512 with the objective of inter alia preventing or reducing the risk of disasters, emergency preparedness, rapid and effective response to disasters and post disaster recovery.
The identification of risk related to various hazards provides the foundation for Disaster Risk Reduction activities aimed at both the prevention and mitigation of disasters and the loss of human lives. The indicative risk profile platform of the NDMC aims to provide inputs into the establishment of a national standard and subsequent guidelines in disaster risk assessments.
The NDMC approached the South African Weather Service (SAWS) to quantify a relative windstorm hazard component to form one of three components that would comprise the national indicative risk and vulnerability profile for wind storms in South Africa, in compliance with legislative requirements relating to generating indicative risk and vulnerability profiles (the other components were vulnerability and capacity). The appropriate quantification of a properly defined hazard is determined by the fact that this quantification will eventually be used in the relative assessment of risk, quantitatively defined as:
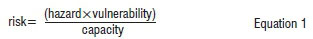
The above equation provides a tool or measurement of relative risk, which is defined by the Disaster Risk Institute as the combination of the probability of an event and its negative consequences.13
The requirements of the project were firstly to define a windstorm hazard and retrospectively assess the conditions that meet these requirements from a historical perspective. Based on these findings, the outputs would encompass a spatial output of windstorm risk in South Africa. In addition, the seasonal quantification of the wind hazard should include the risks associated with likelihood, frequency, magnitude and predictability, as defined by the NDMC. Following the analyses of the four factors, an overall relative risk should be determined, which incorporates or considers the mentioned factors. According to the definitions of the factors, all factors can be estimated with the application of an appropriate extreme value distribution, and are therefore interlinked.
A further requirement was that the wind hazard be quantified on at least a resolution at local municipal scale. There are in excess of 200 local municipalities, and the project should allocate a relative wind hazard quantity to each of these geographical areas. While the strong wind climate would exhibit significant variability at denser spatial scales than some local municipal areas, in most cases wind measurements, on which the analyses would be based, were close to the most populated areas in the municipalities. Therefore, it was considered that the analyses of the measured data would in most cases reflect the risk to the largest part of the population (i.e. in the more urbanised areas) residing in a particular local municipality.
From the outset of the project it was agreed that the quantification of the wind hazard would be based on the statistical analyses of measured data, of which SAWS is the official custodian in South Africa. Such an approach was also taken in the update of the extreme wind statistics of the South Africa Loading Code.8,9
Definitions of wind hazard factors considered
The NDMC requires that 4 factors be considered in the quantification of wind hazard in South Africa. In addition, these factors, and the overall risk, should be estimated on a seasonal basis. Below are the quantifications of the factors, discussed in terms of their definitions, as agreed between SAWS and the NDMC. It should be noted that not all the definitions strictly conform to those generally found in the literature.
The likelihood of a wind hazard occurring can be determined by calculating the number of independent occurrences, divided by the period over which measurements were made, in years:
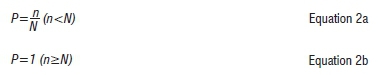
where P is the likelihood, n is the number of occurrences and N is the number of periods, e.g. years or seasons. P is limited to 1 or 100% if there is on average one wind hazard per year or season. However, it should be noted that because of the short period of data for a large fraction of utilised weather stations, as well as the high wind speeds for which the likelihood should be determined, it was advisable that the likelihoods be estimated from the application of appropriate theoretical extreme value distributions of the data.
The frequency of occurrence is defined as the estimated average number of days per time interval (e.g. a season or year) when the daily maximum wind gust is above the threshold which makes the occurrence of a wind hazard likely:
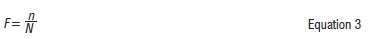
which is the same equation as for P, but not limited to 1 or 100% if n >= N.
Magnitude is defined as the highest wind gust expected within a given period, e.g. a decade:
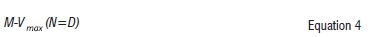
where M is the magnitude, Vmaxthe maximum wind speed, and D is a predetermined period, e.g. 10 years or seasons.
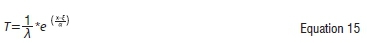
The NDMC links predictability to return periods. Predictability is measured on the number of occurrences over a given timeframe of analysis for each unit of analysis, from which the relative risk can be deduced. It runs very close to frequency; however, frequency is more focused on the number of seasonal occurrences in totality. With predictability, we would like to know that, for example, in 10 autumn seasons it was observed that in 30% of the seasons, strong wind events occurred. This is the same as the estimation of likelihood, where a percentage of the likelihood of occurrence is given:

where T is the return period, the reciprocal of the frequency.
Determination of thresholds of hazardous wind speeds
Definition of a wind hazard
Hazard can be defined as 'the potential occurrence of a natural or human-induced physical event that may cause loss of life, injury, or other health impacts, as well as damage and loss to property, infrastructure, livelihoods, service provision, and environmental resources'.14 Wind hazards can be defined in terms of the wind speed or the origin of the strong wind, e.g. tornadoes, tropical cyclones and thunderstorms. In terms of wind speed, the definition or threshold of a wind hazard is dependent on the socio-economic sector it relates to.
In addition to the above, the Disaster Risk Institute defines a hazard as 'a dangerous phenomenon, substance, human activity, or condition that may cause loss of life, injury, or other health impacts, property damage, loss of livelihoods and services, social and economic disruption, or environmental damage'.13
In the literature, wind hazards are most often described in terms of their origin or cause, or the danger that wind stronger than a specific threshold value might pose to a specific sector. For example, in forestry, a wind hazard is usually defined in terms of the wind speed capable of windthrow, which refers to trees uprooted or broken by wind. For the built environment, a wind hazard can be described as a wind phenomenon that exhibits wind speeds greater than the design wind speed values, or wind speeds which are in general capable of inflicting damage to structures. For the health sector, the adverse effects of strong winds on the human body are important. This has usually got to do with wind in conjunction with other factors, e.g. the potential of dust storms or the combination of strong winds and low humidity (e.g. bergwinds). For aviation, the strengths of gusts of convective origin (e.g. downburst or microbursts) are the most important. It is therefore clear that it is difficult, if not impossible, to describe or define a wind hazard holistically, as the adverse effects of strong winds are often exacerbated by the presence of other factors such as dust, low humidity and in strong or severe thunderstorms, heavy precipitation.
To complicate matters further, a wind hazard can be defined in terms of an average wind speed threshold (usually over 10 min), or gust value, which is usually assumed to be the wind speed over a period of 2-3 s, or the 'instantaneous' wind. This sometimes led to the erroneous interpretation or application of wind hazard guidelines or scales, for example in the application of the Beaufort wind scale, where wind categories are defined in terms of the average wind speed. However, examples exist where the application of the guidelines was in terms of gusts or averaged times much longer than the prescribed 10 min, e.g. 24 h.
To define a wind hazard in terms of thresholds, two options arguably exist: (1) defining a range of categories according to the most likely adverse effects it might have on a range of sectors, or (2) defining one threshold at which the wind speed will presumably have adverse effects on most of the identified sectors.
National wind hazard warnings
As a basis, the definitions of wind hazard warnings issued by various meteorological services were reviewed. Some of the most prominent are the National Weather Service of the United States, Environment Canada, MeteoAlarm (European warning system) and the Bureau of Meteorology of Australia. The purpose of most of the alerts is to inform the public of weather conditions which might damage infrastructure and endanger lives.
For the National Weather Service of the USA, alerts of general strong wind hazards are classified into groups of two numbers on the Beaufort Scale. Warnings are given in relation to maritime conditions, land and tropical cyclones, and watches or alerts are given for specific strong wind related meteorological phenomena. These are tornadoes, severe thunderstorms and particularly dangerous thunderstorms. Significant weather advisories are issued where thunderstorms can be expected with gusts in the range of 34-50 knots (17.5-25.7 m/s). Other alerts are given where high wind speeds in conjunction with snow (blizzards), low temperatures (wind chill) and dust storms can occur.
Alerts from the Meteorological Service of Canada, under the auspices of Environment Canada, are similar to that of the USA. Watches or warnings of severe thunderstorms are given when gusts are expected to be stronger than 50 knots (25.7m/s), as well as separate alerts for tornadoes, tropical cyclones and hurricanes. A general wind warning is issued for winds stronger than about 30 knots (15.5 m/s), gusting at 50 knots (25.7 m/s). In addition, marine warnings are issued with different thresholds.
A study was conducted for most of the European territory to present threshold values for the warning of strong wind gusts.15 This was based on the determination of return period values using validated wind gust data. Return periods indicate how extreme an event is compared to the local climate conditions and are used as a measure of the possible danger of the event and its impact on society. The choice of the new warning thresholds was based on the median of the return values for three different return periods: 1-year return periods for yellow warnings, 2-year periods for orange and five-year periods for red warnings. Modified thresholds for Norway, Ireland, the Netherlands, Germany and Spain were developed, where the need to distinguish between coastal, inland and mountainous regions was demonstrated.
In Australia, strong wind warnings are given in general, or specifically for the coastal areas, but also as part of warnings for severe thunderstorms. Threshold values for wind gusts are 90 km/h (25 m/s), and 63 km/h or 34 knots (17.5 m/s) for an average wind speed.
The South African Weather Service employs the following thresholds for its alert system: A mean wind speed of 34 knots (17.5 m/s), defined as 'gale force' according to the Beaufort scale, and a possible thunderstorm gust of 50 knots (25.7 m/s). In addition, warnings are also given for probable gusts stronger than 44 knots (22.6 m/s) along the coast. The values for mean wind speed and thunderstorm gusts correspond to the values that other meteorological services, e.g. USA National Weather Service, use for their warnings.
Likely impacts of wind speeds at which warnings are issued
The wind speed values for which official warnings are issued should be further investigated regarding their likely impact, particularly on infrastructure. However, as stated by Molarius et al.16, 'attempts to link an extreme weather event to physical consequences in a built environment using a concept of probability or likelihood are few'. Another avenue, apart from research that focuses on the likely damage to the built environment, is to use established wind scales. The most widely used is the Beaufort Wind Scale, where a mean wind speed value of 34 knots (17.5 m/s) is the lower bound of the 'gale force wind' category. This scale is used to estimate mean wind speeds according to conditions observed over land and sea. A gale force wind is described as a wind capable of breaking twigs from trees and causing cars to veer on the road. The category below gale force wind, 'near gale', is only described as being capable of inducing motion in whole trees, with effort needed to walk against the wind. From these descriptions, the gale force wind speed of 34 knots (17.5 m/s) seems to be the most appropriate lower bound for a dangerous wind warning, which is largely reflected in the warnings issued by many national meteorological services.
Regarding the warning of the likelihood of a gust speed of 5 knots (25.7 m/s), this wind speed was first used as a lower threshold in the USA for severe thunderstorm warnings. In the 1950s and 1960s, there were three types of convective watches that could be issued: tornado watches, public severe thunderstorm watches, and aviation severe thunderstorm watches. At first, for the public, the severe thunderstorm watch wind criterion was 75 mph (33.5 m/s), while the limit for aviation watches was 50 mph (22.4 m/s). Negotiations with the Air Force raised the minimum speed required for an aviation watch to 58 mph (25.9 m/s) in 1962. In 1970, the aviation severe thunderstorm and public severe thunderstorm watches were combined into a single severe thunderstorm watch, with a minimum wind gust criterion of 50 knots (25.7 m/s), to reduce confusion.17 According to the risk management group, Karen Clark and Co18, wind gusts of 58 mph (25.9 m/s) can induce localised damage, as shown in Table 1. This is described as patches of shingles missing, minor roof covering damaged, window and cladding damage to some wood frames, and some damage to unreinforced masonry and light metal structures. Significant signage damage is possible.
It is clear that the lower thresholds of mean wind speeds and gusts applied by most weather services for strong wind and severe thunderstorm alerts are appropriate in the sense that the wind speeds can be considered to be relevant to the possibility of some damage to formal infrastructure.
Relevant wind speed in South Africa
In summary, it is possible to objectively define a wind hazard as a mean wind with a strength of 34 knots (17.5 m/s) or gust of 50 knots (25.7 m/s), which with current knowledge, can be assumed to be the lower bounds of wind speeds capable of inflicting damage to infrastructure. However, in many countries, particular in developing countries like South Africa, informal settlements are still significantly contributing to the provision of shelter. These structures are of varying integrity, with the effect that it will be difficult, if not impossible, to assign a threshold wind speed at which damage is likely. A scientific investigation into the likely damage of winds of various strengths to informal settlements is needed (Goliger AM 2014, oral communication). Therefore, from the available wind damage scales, it is provisionally deduced that the lower wind speed threshold where damage to informal structures is likely, is a gust speed of about 20 m/s.
Overall wind hazard
The potential damage that wind can cause is non-linear, with the likely damage rising exponentially with wind speed, relative to the wind force, which is defined as the square of the wind speed. Therefore, it can be argued that for the overall wind hazard, the likelihood of higher wind speeds should carry progressively more weight than the lower wind speeds at which some damage to infrastructure is likely.
Table 2 summarises the Karen Clark and Co. and Beaufort wind scales, as well as meteorological warnings and the 1:50 year wind gust speed which should in most cases be used in the formal design and planning of infrastructure, according to the present South African wind loading code. It was possible to conveniently categorise wind gust speeds into five equally spaced intervals, from the lowest at 20 m/s where slight damage is likely, to 40 m/s, which is the wind speed at which extensive damage to formal infrastructure is possible. Subsequently, the overall wind hazard is defined as the sum of the likelihoods of wind speeds occurring for each of the five categories. As the likelihood is given in terms of a wind speed for a specific category or higher occurring, it follows that the likelihood of wind speeds at the higher categories carries much more weight. For example, the probability of a wind speed of 40 m/s or higher will have five times the weight of the likelihood of a wind speed of 20 m/s or higher in the overall measure for wind hazard.
Formally, we define the wind hazard as follows:
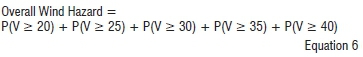
where V is the wind gust value in m/s.
Data
The quantification of wind hazards is based on the analysis of observed wind measurements from the SAWS network of automatic weather stations. Ten years is regarded as the minimum period from which meaningful statistical assumptions regarding the wind climate of a location can be made. The last comprehensive analysis of wind data, in 2008, utilised the data of 75 weather stations.8 While a potential 94 stations were available at the time of analysis, a significant fraction of the stations had to be discarded because of inadequate exposure of the anemometers and other problems.
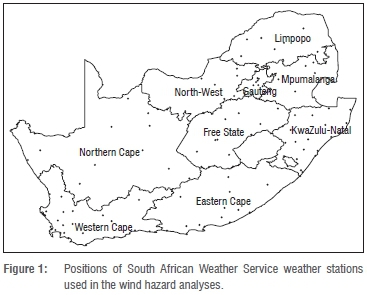
Currently SAWS operates 130 automatic weather stations which have been open since at least 2004, which means at least 10 years of data at the time of analysis. However, problems with data and the exposure of some stations led to the final analyses being based on the 124 weather stations presented in Figure 1.
All the stations were quality controlled according to the following procedure: All days with wind gusts stronger than 20 m/s were identified. For these days, the 5-min high resolution data of all measured weather parameters were plotted and visually inspected. This assisted in the decision to consider a wind gust as correct, or what is called a 'spike' in the data. Attention should inter alia be given to the difference between the mean wind speed and gust, where the ratios are generally smaller when the origin of the wind gust is at the synoptic scale compared to the mesoscale, i.e. thunderstorms. Subsequent identified erroneous wind gust values were discarded from the final data sets used for the analyses.
In the assessment by Kruger8,9 it was found that the wind data from a significant fraction of SAWS weather stations were compromised by inadequate exposure of anemometers. If there is, for example, significant obstacles or nearby complex topography, it will have an influence on the representivity of the wind measurements. This is especially the case for the mean wind speed, but to a lesser degree wind gusts produced by some mesoscale weather systems, e.g. thunderstorms, where the origin of the gust is at a relatively short distance from the place of measurement. Therefore, the representivity of the measurements had to be taken into account in the mapping of the results, especially for the regions and times of the year where wind gusts were mostly forthcoming from synoptic-scale systems. In places where the estimated wind statistics were markedly lower than for nearby stations, the exposures were investigated, e.g. by consulting photographic evidence of the surrounds and Google Earth. Where the exposures of the relevant stations were deemed to be non-standard and therefore not representative of the region, these were taken into consideration in the allocation of categories in the final mapping procedure. Eventually the aim was to produce statistics that were more or less considered to be applicable to standard conditions, which can be defined as level terrain with a roughness of approximately 0.03 m.
Methodology
Application of extreme value distribution
In the case of short time series, the estimation of the likelihood of strong winds should preferably be done with statistical methods particularly developed for this situation. It has been shown that the peak-over-threshold (POT) method with the fit of the exponential distribution to values above a specific threshold, produce acceptable results.13
With POT methods, all values exceeding a specific threshold are used for analysis. Usually, the generalised Pareto distribution is then fitted to the selected values and is given as:

where ξ is the selected threshold and κ is the shape parameter. It was shown that with data for limited periods, the safest estimation for the value of κ was 0.8 This is consistent with Brabson and Palutikof19 who, after analysing shorter and longer periods of data for the same location, came to the conclusion that the κ=0 versions of the models make more accurate predictions of extreme wind speeds, even when a shorter period of data is utilised (in their case 13 years). Abild20 came to a similar conclusion, namely that, while the generalised Pareto distribution and generalised extreme value distributions are powerful in detecting outliers, and a possible two-component population in exponential data, the tail behaviour is strongly influenced by the estimation of κ, and will therefore not provide reliable estimates of upper quantiles when fitted to a short record. In other words, the poor behaviour of κ is indicative of the data insufficiency of the short time series.
For k = 0, the generalised Pareto distribution simplifies to the exponential distribution:

The crossing rate of the threshold is defined as:

where n is the total number of exceedances, and M is the total number of years of the time series.
Quantiles for specific return periods (in years) can be calculated from Abild20:
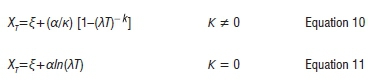
The distribution parameters α and k can be estimated with:
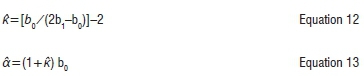
which are valid within the range -0.5 < k < 0.5.
As with the other methods, selected extreme values should be independent. To ensure independence, choices have to be made between the threshold value and the separation time between the selected values. The choices of the separation time vary between authors, with e.g. Cook21 and Gusella22 using 48 h for European wind climates and Walshaw23 using 60 h for Sheffield data. The same applies for the selection of the threshold, where Cook21 decided on a threshold of 15 m/s for hourly mean wind speeds and 30 m/s for wind gusts, while Brabson and Palutikof24 found that a threshold of 32-36 m/s is most suitable for Shetland in the north of the United Kingdom. It therefore becomes clear that the optimum choices of threshold and separation time depend on location and specifically the local wind climate. To aid in the threshold selection, various techniques exist, such as the conditional mean exceedance (CME) graphs, which is a plot of the mean excess over threshold as a function of the threshold value.24,25 Brabson and Palutikof19 defined an independent event index:

and calculated the value of ε for various combinations of threshold and 'dead time', i.e. the minimum period between selected values. An independent event can be defined as an event where the cause is different from other events before and after the particular event. The ideal is for e to be as close as possible to unity, but a value of ε=0.8 is sufficient to obtain accurate quantile estimates with the POT method.
Estimation of four factors using the peak-over-threshold method
All four factors discussed can be estimated with the application of the POT method. From Equations 4, 5 and 6:
where T is the return period.
The predictability is simply the application of Equation 9 with x=20 m/s.
The frequency, or estimated number of days per season with gusts higher than 20, is given by 1/T, if x=20 m/s.
For probability, if the days per season are equal to or greater than 1, then the probability is 100%, else the probability is given as the total number of days in a season multiplied by 1/T.
The magnitude is calculated directly from Equation 7, with T=10 years.
Relative categorisation of overall wind hazard
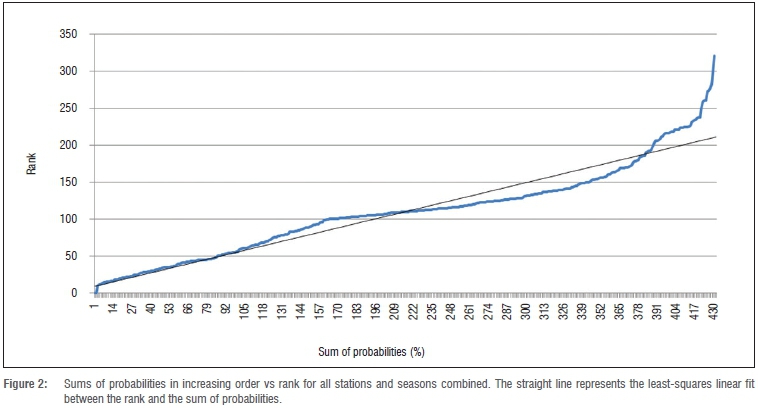
The wind hazard across South Africa should be relatively quantified on a scale with five categories. To achieve this, the probabilities of occurrence of wind gusts in the five categories presented in Table 2 were utilised on a linearly weighted scale. This was done by estimating, per season and per station, the probabilities of wind gusts stronger than the lower margins and calculating the sum of the five probabilities. The range of results was then divided into five equal categories, assuming that the sum of probabilities increased linearly. Figure 2 presents the sums of probabilities in increasing order, as well as the least-squares fitting of a straight line on the curve. One can see that the assumption of a linear increase in value vs rank can be accepted, with a statistically significant correlation factor of 0.96. It is only at the higher ranks that there is a very marked deviation from the straight line.
Results
The NDMC required results on a seasonal basis for the four factors as well as the relative overall wind hazard. In addition, an annual map of the relative wind hazard was required for eventual application to the estimation of the risk of a wind hazard.
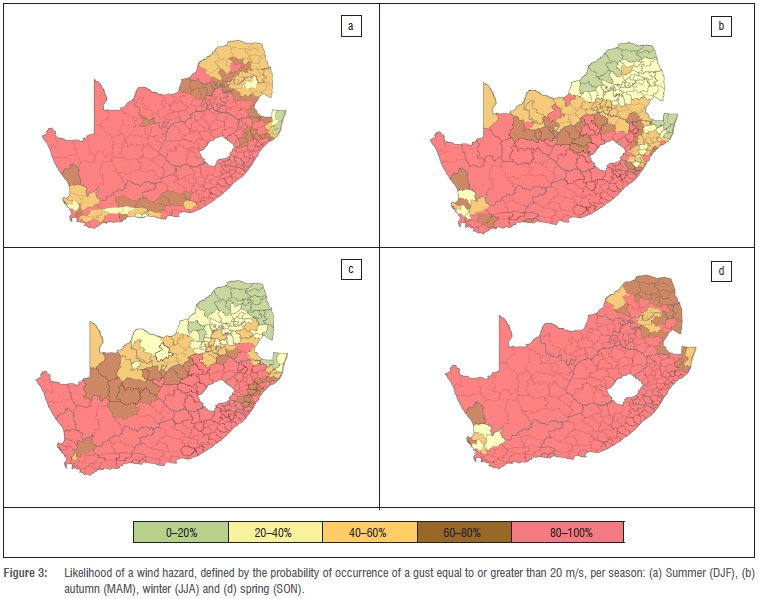
Likelihood
Figure 3 presents the likelihood of a wind hazard, defined by the occurrence of a gust equal or higher than 20 m/s per season. In general, most of South Africa exhibits a high probability of at least one incident of a wind gust of 20 m/s or higher, except for the northern and northeastern parts during autumn and winter. This is mostly because of the diminished probability of strong thunderstorms occurring in the summer rainfall regions during those seasons. In the central and southern parts of the country, there is a likelihood for strong thunderstorms during the summer months, as well as strong winds from cold fronts during winter, when strong northwesterly winds often occur before the passage of a cold front.6
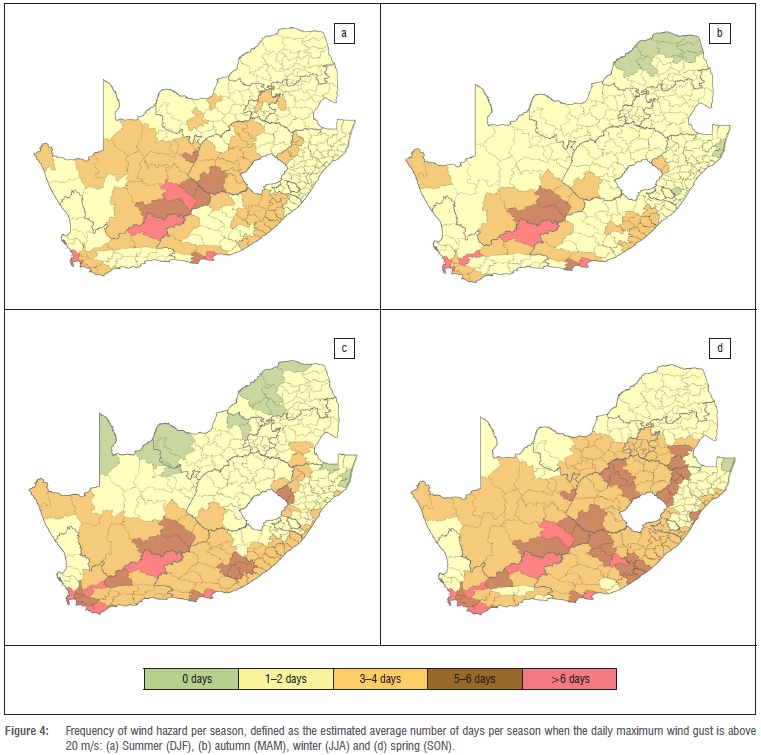
Frequency
Figure 4 presents the frequency, defined as the estimated average number of days per season when the daily maximum wind gust is above 20 m/s. During the summer months, the highest occurrences of strong wind gusts are estimated for the southwestern Cape, the Nelson Mandela metropole and the central Karoo, at 5 days or more per season. The northern and northeastern parts also show their highest frequency in summer because of strong thunderstorms, although only for about 1 or 2 days per season.
In autumn, the high frequencies in the southern and central regions are almost the same as in summer. However, in winter the Western Cape shows an increased frequency, resulting from the increased likelihood of strong frontal systems. This situation continues into spring, where the prevalence of strong southeasterlies increases over the southwestern parts. In the northern parts, the frequencies of strong wind gusts return to the summer situation.
Magnitude
Figure 5 presents the magnitude per season, which is defined as the highest wind gust expected in 10 years. In summer, the highest wind gusts probable over a decadal period are in the central interior, where De Aar and Kimberley can expect wind gusts in excess of 35 m/s. A wind gust of this magnitude equates to a storm where some structural damage to the built environment is highly likely.
The regional situation in summer continued into autumn, although with lower magnitude. In winter the magnitude increased over the south and southern interior, where Worcester and Beaufort West could expect wind gust magnitudes higher than 35 m/s per decade. The spring situation was similar to autumn.
In the northern and northeastern parts of the country, the seasonal magnitudes vary between 20 and 25 m/s in spring and summer, to lower than 20 m/s in many places in the far north during autumn and winter.
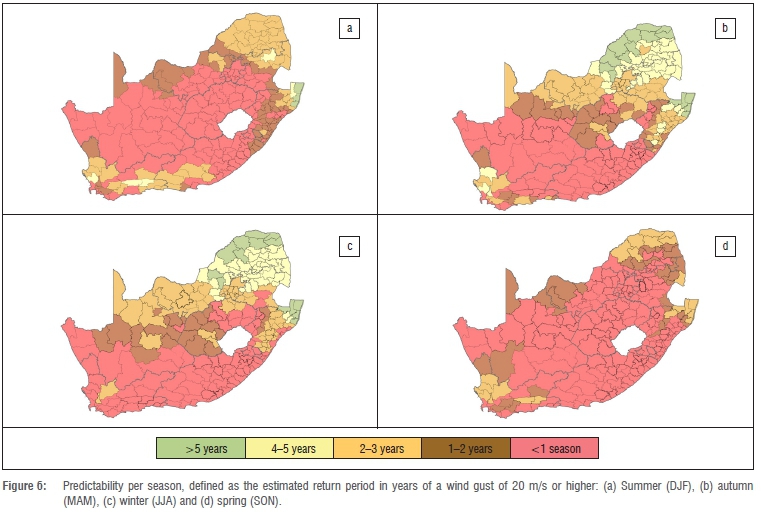
Predictability
Figure 6 presents the predictability per season, which is defined as the estimated return period of a wind gust of 20 m/s or higher. In summer, most of South Africa from Gauteng southwards can expect wind gusts higher than 20 m/s. This situation also applies to spring, where it can be expected that many places north of Gauteng will experience strong wind gusts at least once per season.
In the autumn and winter months, the expectations of strong wind gusts in the northeast diminish, with return periods of 2-3 years or longer expected for strong wind gusts to occur. However, in the southwestern Cape there is a marked increase in the expectation of strong wind gusts in winter, at least once per season.
Overall wind hazard
It was shown that all four factors could be estimated with the application of an appropriate extreme value distribution. It follows that the results of the determination of the factors are therefore strongly linked quantitatively. Similar regions and seasons should therefore indicate relatively high likelihoods and frequencies of strong wind gusts, as reflected in the maps for the four factors considered.
For the estimation of risk, a relative indicator of the wind hazard was required. The NDMC requires five relative wind hazard classes or categories, with more or less equal spatial extents over South Africa. The previous discussions of the results of the four factors provided further motivation that a measure of the overall wind hazard should be based on the probabilities of strong wind gusts.
In summary, the seasonal results of the overall relative wind hazard presented in Figure 7 show the following: A larger section of South Africa is subjected to very strong winds in summer and spring than during the other seasons of the year. In the south and southeast, the higher hazard categories are, as expected, more prevalent during winter and spring. The central parts, e.g. central and southern Free State and northeastern Karoo experience high wind hazards during summer and spring, when strong northeasterly winds associated with troughs over the interior are prevalent, together with the increased likelihood of strong thunderstorms.
The northern and northeastern parts of the country show the same tendency toward higher wind hazards in summer and spring as in the central parts. However, the wind hazard in this region remains relatively low, with a highest category of 3 attained in some places during spring.
The overall all-year relative wind hazard risk map, presented in Figure 8, provides a summary of the four seasons combined. The highest relative wind hazard is in:
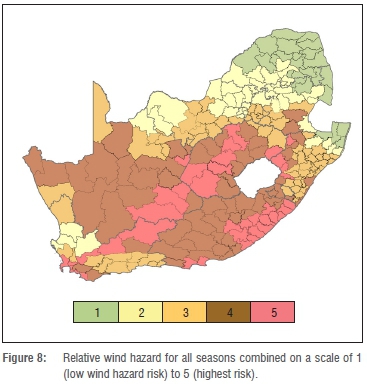
- Southwestern Cape, further northeastwards from Worcester, Beaufort West, De Aar, Kimberley/Bloemfontein and Welkom in the north, (mainly because of synoptic systems in the southwestern Cape, i.e. cold fronts and ridging of the Atlantic high pressure system, and central interior, i.e. deep troughs, and thunderstorms in the north).
- Nelson Mandela metropole and surrounds (because of synoptic scale systems, i.e. cold fronts)
- Parts of the escarpment in the northeast, e.g. Van Reenen to Ladysmith, Bergville and Newcastle (because of synoptic-scale systems, i.e. cold fronts).
- Eastern half of the Eastern Cape (former Transkei).
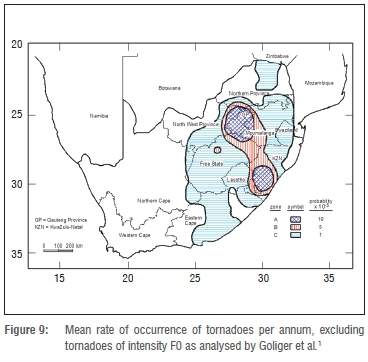
It should be noted that by far most of the disastrous implications of extreme wind events in South Africa (in terms of material and human loss) were as a consequence of tornadic events. Because of their limited spatial extent and low frequency of occurrence, these events do not get recorded by a measurement network such as that of SAWS, on which this research is based. The outputs of comprehensive research in this regard have been published by the Council of Industrial and Scientific Research (CSIR) and the then South African Weather Bureau.1 It is therefore important to compare the results of the tornado study with the all-year relative wind hazard risk map presented in Figure 8. Strong tornadoes which are capable of inflicting extensive damage most frequently occur in eastern half of South Africa, particularly over the southern part of the KwaZulu-Natal province interior and Gauteng province (Figure 9). In the overall wind hazard map in Figure 8, these regions are shown to be at moderate (3/5) to below-moderate risk (2-3/5) of strong winds. While the probability of occurrence for a tornado at a single point in these regions is extremely low (about 0.0001 occurrences per year), it is still important to note, especially in the case of designing extensive infrastructure, such as power lines, that extreme weather events with a very low probability of occurrence (e.g. tornadoes and tropical cyclones) are not fully reflected in the final results of this research. Here the probability of wind speeds higher than 20 m/s is reflected in the output, which is not of a similar order of magnitude to wind speeds from tornadoes.
Conclusions
From the literature and information of relevant built environment expertise, the definition of a windstorm hazard, in terms of magnitude, is sector dependent. Also, as is the case for the built environment, the definition of wind hazard can depend on the resilience of the socio-economic sector. Therefore, the determination of a specific lower wind speed threshold for the analysis required a measure of subjectivity regarding the approximate value at which damage to informal infrastructure is possible. More objectivity in the development of such a definition should be possible in developed countries, where the utilisation of informal structures for shelter is low. From available wind scales, the wind speed at which damage is likely was estimated at a wind gust of about 20 m/s. This threshold was therefore used in the overall definition of a wind hazard, and also in the definitions of the four parameters defined by the disaster management sector.
The seasonal quantification of the windstorm hazard in terms of the parameters likelihood, frequency, magnitude and predictability, showed clear seasonal variation in windstorm hazard. The relative hazard was for all parameters the highest in the southern parts of South Africa for the autumn and winter months, expanding northwards during spring and summer. The same shifting patterns were found for all of the mentioned parameters, as well as in the analysis of overall relative risk.
Ultimately, it could be shown that some regions in the country are, in general, more prone to wind hazards than others at the annual temporal scale, with the regions at highest risk being in the south and southeast and along parts of the escarpment. Strong wind events with very low probability, e.g. tornadoes and tropical cyclones, were not considered. It is impossible to consider these events in the forward planning to mitigate against strong wind disasters, because of the rarity of occurrence at specific point locations. In contrast, it could be possible for countries with regions prone to the occurrence of tornadoes and tropical cyclones, e.g. the United States midwest, to take these events into account in a quantification of strong wind hazard.
The outputs of the research will serve as essential input in the determination of wind hazard risk (with the additional two inputs, vulnerability and capacity) by the NDMC.
Authors' contributions
A.C.K. analysed the climate data, developed and performed relevant statistical analysis, developed the end products in GIS and authored most of the submitted manuscript. D.L.P initiated the research, contributed to the design of the parameters of risk included, and ensured that the end products of the research fulfilled the requirements from a disaster risk reduction perspective. He contributed to the manuscript by revision to ensure that the relevance of the work to the NDMC was well-communicated. M.v.S. provided technical perspective on the end product required by NDMC, provided background to the significance of the results, and played the main role in the development of the factors considered in the design of the hazard profile to fulfil the requirements for the use of the wind hazard profile in the development of the subsequent risk profile. He also contributed to the writing of the manuscript.
Acknowledgements
We acknowledge the NDMC for funding the project and two anonymous reviewers whose inputs and comments significantly improved the contents.
References
1. Goliger AM, Milford RV, Adam BF, Edwards M. Inkanyamba: Tornadoes in South Africa. Pretoria: CSIR and South African Weather Bureau; 1997. [ Links ]
2. Goliger AM. Development of a wind damage and disaster risk model for South Africa [PhD thesis]. [ Links ] Stellenbosch: Stellenbosch University; 2002.
3. Goliger AM, Retief JV, Niemannn H-J. Wind damage/disaster model. Part 1: Generic algorithm. In: Proceedings of the 11th International Conference on Wind Engineering (ICWE); 2003 June 2-5; Lubbock, TX, USA. Lubbock, TX: ICWE; 2003. p. 1023-1030. [ Links ]
4. Goliger AM, Retief JV, Niemannn H-J. Wind damage/disaster model. Part 1: Application. In: Proceedings of the 11th International Conference on Wind Engineering (ICWE); 2003 June 2-5; Lubbock, TX, USA. Lubbock, TX: ICWE; 2003. p. 1031-1038. [ Links ]
5. Goliger AM, Retief JV, Niemannn H-J. A development process of a wind disaster risk model for South Africa. In: Proceedings of the 2nd International Conference on Structural Engineering, Mechanics and Computation; 2004 July; Cape Town, South Africa. Cape Town: University of Cape Town; 2004 p. 843-848. [ Links ]
6. Goliger AM, Retief JV. Severe wind phenomena in southern Africa and the related damage. J Wind Eng Ind Aerod. 2007;95:1065-1078. http://dx.doi.org/10.1016//.jweia.2007.01.029 [ Links ]
7. Goliger AM, Mahachi J. Effects of severe windstorms on housing stock in South Africa - Adequate constructions vs extreme weather events. Paper presented at: 11th International Housing and Home Warranty Conference (IHHWC08); 2008 September 6-10; Edinburgh, UK. [ Links ]
8. Kruger AC, Retief JV, Goliger AM. Strong winds in South Africa: Part I -Application of estimation methods. J S Afr Inst Civ Eng. 2013;2:29-45. [ Links ]
9. Kruger AC, Retief JV, Goliger AM. Strong winds in South Africa: Part II -Mapping of updated statistics. J S Afr Inst Civ Eng. 2013;2:46-58. [ Links ]
10. Kruger AC, Goliger AM, Retief JV, Sekele SS. Clustering of extreme winds in the mixed climate of South Africa. Wind Struct. 2012;15(2):87-109. http://dx.doi.org/10.12989/was.2012.15.2.087 [ Links ]
11. Disaster Management Act, 2002 (Act 57 of 2002) [document on the Internet]. [ Links ] c2003 [cited 2014 December 11]. Available from: http://www.cogta.gov.za/sites/cogtapub/Acts/DISASTER%20MANAGEMENT%20ACT.pdf
12. National Disaster Management Framework. Government Notice 654 of April 2005 [document on the Internet]. [ Links ] c2005 [cited 2014 December 11]. Available from: http://www.ndmc.gov.za/portals/0/WebDocuments/Guidelines/DM/downloads/SJ%208%20NDMF%202005.pdf
13. The United Nations International strategy for disaster reduction (UNISDR). UNISDR terminology [document on the Internet]. [ Links ] c2009 [cited 2015 January 16]. Available from: http://www.unisdr.org/files/7817_UNISDRTerminologyEnglish.pdf
14. Intergovernmental Panel on Climate Change. Impacts, adaptation, and vulnerability: Summary for policymakers. Geneva: IPCC; 2014. Available from: https://ipcc-wg2.gov/AR5/images/uploads/IPCC_WG2AR5_SPM_Approved.pdf [ Links ]
15. Stepek A, Wijnant IL, Van der Schrier G, Van den Besselaar EJM, Klein Tank AMG. Severe wind gust thresholds for Meteoalarm derived from uniform return periods in ECA&D [document on the Internet]. [ Links ] c2010 [cited 2015 January 17]. Available from: http://eca.knmi.nl/documents/Natural_Hazards_versie6.pdf
16. Molarius R, Könönen V,Leviäkangas P Zulkarnain, Rönty J, Hietajärvi A-M, Oiva K. The extreme weather risk indicators (EWRI) for the European transport system. Nat Hazards. 2014;2:189-210. http://dx.doi.org/10.1007/s11069-013-0650-x [ Links ]
17. Severe Weather 101. Frequently asked questions about damaging winds [document on the Internet]. [ Links ] No date [cited 2015 January 18]. Available from: https://www.nssl.noaa.gov/education/svrwx101/wind/faq/
18. Karen Clark and Co [document on the Internet]. [ Links ] c2014 [cited 2015 January 17]. Available from: http://www.karenclarkandco.com
19. Brabson BB, Palutikof JP. Tests of the generalized Pareto distribution for predicting extreme wind speeds. J Appl Meteorol. 2000;39:1627-1640. http://dx.doi.org/10.1175/1520-0450(2000)039<1627:TOTGPD>2.0.CO;2 [ Links ]
20. Abild J. Application of the wind atlas method to extremes of wind climatology. Technical report Risoe-R-722 (EN). Roskilde, Denmark: Ris0 National Laboratory; 1994. [ Links ]
21. Cook NJ. Towards better estimation of wind speeds. J Wind Eng Ind Aerod. 1982;9:295-323. http://dx.doi.org/10.1016/0167-6105(82)90021-6 [ Links ]
22. Gusella V. Estimation of extreme winds from short-term records. J Struct Eng. 1991;117:375-390. http://dx.doi.org/10.1061/(ASCE)0733-9445(1991)117:2(375) [ Links ]
23. Walshaw D. Getting the most from your extreme wind data: A step by step guide. J Res Natl Inst Stand Technol. 1994;99:399-411. http://dx.doi.org/10.6028/jres.099.038 [ Links ]
24. Davison AC. Modelling excesses over high thresholds, with an application. In: Tiago de Oliveira J, editor. Statistical extremes and applications. Dordrecht: Springer; 1984. p. 461-482. http://dx.doi.org/10.1007/978-94-017-3069-3_34 [ Links ]
25. Ledermann W, Lloyd E, Vajda S, Alexander C, editors. Handbook of applicable mathematics volume 7: Supplement. Chichester: Wiley-Interscience; 1990. [ Links ]
 Correspondence:
Andries Kruger
South African Weather Service, Private Bag X097, Pretoria 0001, South Africa
Andries.Kruger@weathersa.co.za
Received: 09 Mar. 2015
Revised: 08 July 2015
Accepted: 20 July 2015

