


Servicios Personalizados
Articulo
 Inglés (pdf)
 Articulo en XML
 Referencias del artículo
Indicadores

Links relacionados
-
 Citado por Google
 -
 Similares en Google
Compartir

 Permalink
South African Journal of Science
versión On-line ISSN 1996-7489
versión impresa ISSN 0038-2353
S. Afr. j. sci. vol.112 no.1-2 Pretoria ene./feb. 2016
http://dx.doi.org/10.17159/sajs.2016/a0138
SCIENTIFIC CORRESPONDENCE
Safe spending rates for South African retirees
Eben Maré
Department of Mathematics and Applied Mathematics, University of Pretoria, Pretoria, South Africa
Keywords: retirement; asset allocation; withdrawal; spending; portfolio success rate
When a man retires and time is no longer a matter of urgent importance, his colleagues generally present him with a watch
R.C. Sherriff
Retirees face a difficult financial choice. They need to decide on an appropriate amount to withdraw from their retirement investment and they need to 'optimise' between outliving their money and living below their means. In the USA, financial advisors frequently advocate a 'safe' 4% withdrawal (or spending) rate. We examine spending rates for retirees in a South African setting.
'We want hope for riches and freedom from the fear of poverty' wrote Statman1(p.107). These words hold very true in retirement. Huxley and Burns2(p.203) note: 'Three goals: Don't go broke, preserve the Corpus, or preserve buying power.'
In an influential study, Cooley et al.3,4 investigated the impact of various withdrawal (or spending) rates from a retirement portfolio while keeping these goals in mind. They note3(p.16):
Most investors who plan for retirement eventually confront the question of how much money they should plan to withdraw from their investment portfolio. The dilemma is that if they withdraw too much, they prematurely exhaust the portfolio, but if they withdraw too little, they unnecessarily lower their standard of living.
As a rule of thumb their conclusions are often used by advisers as the so-called '4% safe withdrawal rate'.
In South Africa, retirees typically choose between so-called single life guaranteed annuities and living annuities with their retirement proceeds. A single life guaranteed annuity is an insurance contract which covers the insured pensioner for life and yields a defined income. So-called living annuities allow the pensioner freedom to invest in a wide spectrum of investment vehicles while drawing a monthly amount for pension - currently limited by law to be between 2.5% and 17.5% per annum.
In guaranteed annuity products the insurer bears the longevity and investment risks. In contrast, living annuities allow retirees to benefit fully from their investment asset allocation. Furthermore, the balance of assets accrues to dependants upon death.
The 4% annual safe withdrawal rate studies by Cooley et al.3,4 were performed for US retirees. The South African situation is different; typically as a result of different mortality rates, spending patterns as well as different asset class returns. South African inflation is structurally higher than inflation in the USA. Retirees in South Africa spend more aggressively than do those in the USA, typically drawing in excess of 6% of their portfolios annually as pension.
Here we examine withdrawal rates (i.e. spending rates) in living annuities for South African retirees.
Let's assume one retires at age 60. Based on 2012 South African life tables obtained from the World Health Organization, the conditional survival probability table shown as Table 1 can be calculated.

South African median life expectancy hovers around 64 years (for both sexes) - the conditional median life expectancy, given age 60, is 76 years for both sexes. It is clear from Table 1 that if pensioners reach their retirement years they may be facing 15-20 more years of life with substantial probability; note that conditional life expectancy increases with age.
The retiree faces this question: How much can I spend on a periodic basis, given a specific retirement investment portfolio, to avoid running out of money?
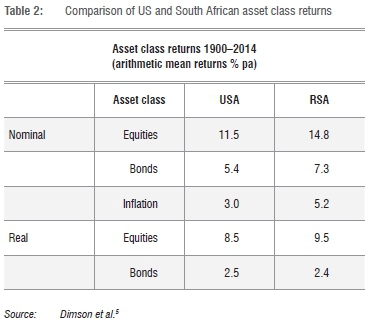
To align our analysis with the work by Cooley et al.3,4, we consider an asset allocation between bonds and equities. In Table 2 we highlight the long-term investment returns of these investment classes on a nominal and real (i.e. inflation-adjusted) basis.
We consider an investment portfolio with a fixed asset allocation between bonds and equities and draw an income from the portfolio on a monthly basis (income is adjusted for inflation, i.e. we look at real spending rates). Cooley et al.3,4 and Bengen6 use a methodology of overlapping periods (also referred to as rolling periods) to calculate end-of-period portfolio values from equities and bond returns. Cooley et al.7 also consider a Monte Carlo based simulation based on distributional characteristics of the asset classes.
Here the methodology is based on random sampling (with replacement) of monthly South African bond and equity total returns (i.e. we assume full reinvestment of interest and dividend proceeds) considered over the period 1950 to 2014 (data source: I-NET/Bridge). This methodology is referred to as a bootstrap simulation.
We consider the bootstrap simulation over fixed investment periods of 15, 20, 25 and 30 years, assuming no mortality. The monthly portfolio value is therefore a function of the simulated investment returns reduced by the amounts withdrawn. We perform 10 000 simulations over all fixed investment periods.
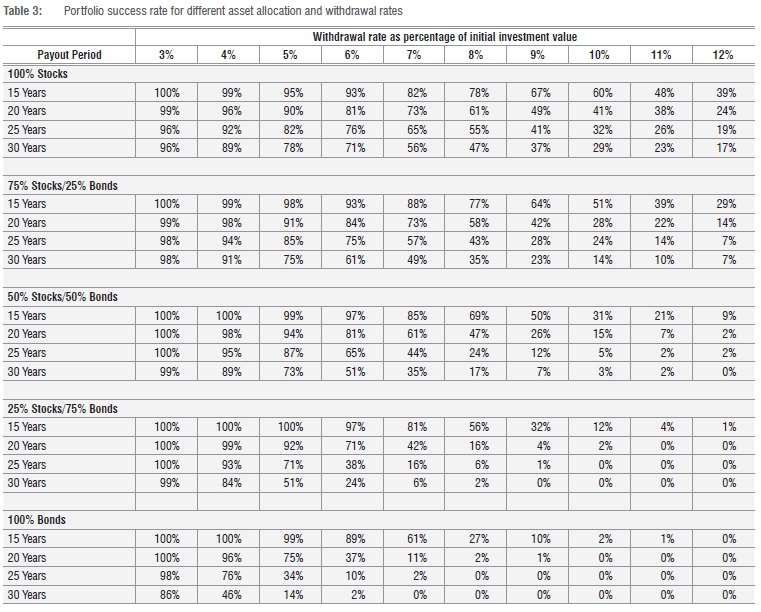
As in Cooley et al.3, we consider a portfolio successful if it has capital left at the end of the specific investment period considered and report the portfolio success rates (i.e. the percentage of successful portfolios based on the bootstrap simulations).
Table 3 details the results. As an example, to aid interpretation, the success rate for a portfolio consisting of 50% stocks and 50% bonds considered over an investment period of 30 years is 35% if we plan to draw 7% pension annually. Recall that our analysis adjusts for the effects of inflation hence the 7% is the real withdrawal rate.
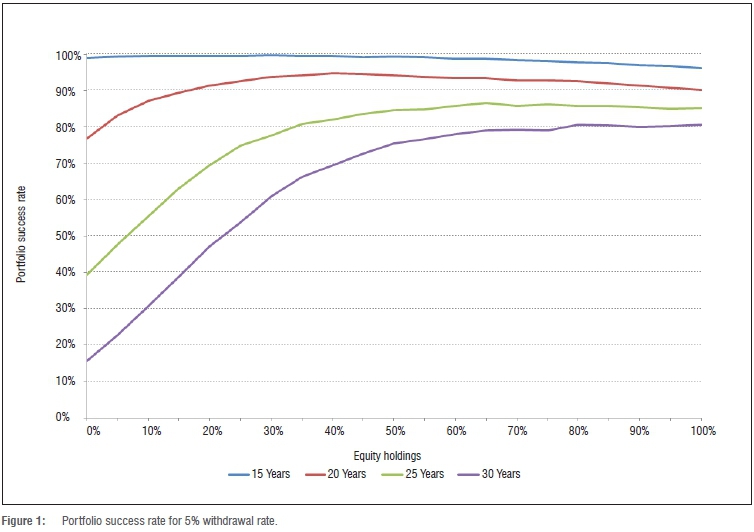
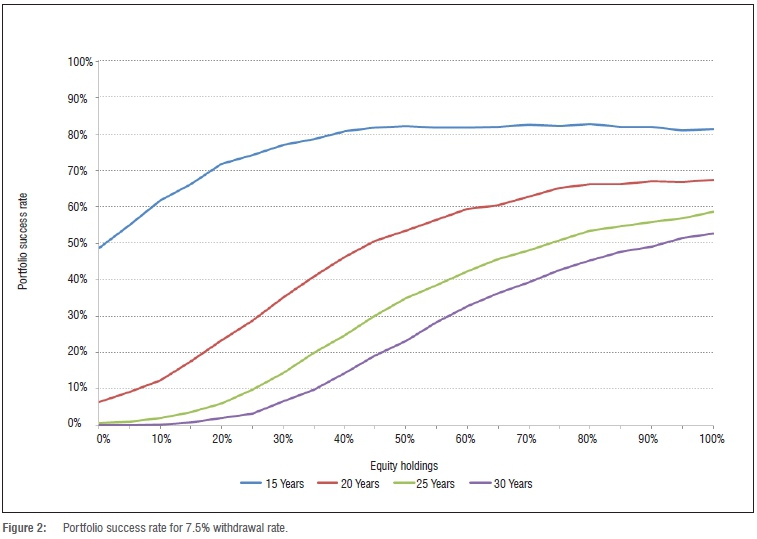
We note the effects of high withdrawal rates on the portfolio success rates - even over relatively short investment periods (15 years). Over long investment periods (30 years), even low withdrawal rates might not protect us fully against running out of capital (Figures 1 and 2.)
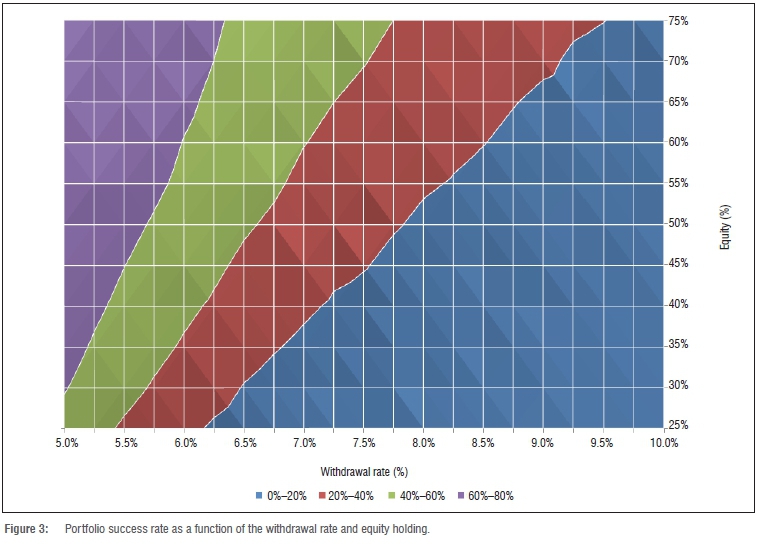
The results detail the effects of asset allocation clearly. A 30-year portfolio consisting only of bonds will have a 2% success rate given a withdrawal rate of 6% annually, whereas the same analysis for a portfolio consisting only of equities yields a 71% success rate. Figure 3 details the 30-year portfolio success rate as a function of withdrawal rate versus equity holding. The results show very clearly, in the South African context, that spending rates above 6% yield low portfolio success rates (less than 60%) for moderate equity holdings. This conclusion can be drawn from Figures 1 and 2 as well.
In our approach we consider the distribution of terminal account balances and also calculate the probability of the investor's capital being depleted. This corresponds to the notion of a safe withdrawal rate.
In the South African context it would appear that a 5% withdrawal rate is sustainable over relatively short periods (15 years or less). Longer-term investment periods yield results which are similar to the Cooley et al.3,4 studies.
These results are important. Scott et al.8 criticised the notion of withdrawing a fixed real amount from an inherently volatile portfolio. I concur; the results obtained here indicate moderation and a cautious approach - the risk associated with the investment environment is significant - while one can expect the risky nature to be maintained in future years there can be no guarantee that historical returns would be maintained. I quote from Cooley et al.7(p.115) in conclusion: 'A portfolio is only successful if it lasts as long as required by the retiree.'
References
1. Statman M. What investors really want. New York: McGraw-Hill; 2011. [ Links ]
2. Huxley SJ, Burns JB. Asset dedication: How to grow wealthy with the next generation of asset allocation. New York: McGraw-Hill; 2005. [ Links ]
3. Cooley PL, Hubbard CM, Walz DT. Retirement savings: Choosing a withdrawal rate that is sustainable. J Am Assoc Individual Investors. 1998;20(2):16-21. [ Links ]
4. Cooley PL, Hubbard CM, Walz DT. Sustainable withdrawal rates from your retirement portfolio. Financ Counsel Plan. 1999;10(1):40-50. [ Links ]
5. Dimson E, Marsh P Staunton M. Credit Suisse Global Investment Returns Sourcebook. Zurich: Credit Suisse; 2014. Available from: http://doc.xueqiu.com/14cdbae48e74653fe7546fe0.pdf [ Links ]
6. Bengen WP. Determining withdrawal rates using historical data. J Financ Plan. 1994;7(1):171-180. [ Links ]
7. Cooley PL, Hubbard CM, Walz DT. A comparative analysis of retirement portfolio success rates: Simulation versus overlapping periods. Financ Serv Rev. 2003;12:115-128. [ Links ]
8. Scott JS, Sharpe WF, Watson JG. The 4% rule - at what price? J Investment Manage. 2009;7(3):31-48. [ Links ]
 Correspondence:
Eben Maré
Department of Mathematics and Applied Mathematics, University of Pretoria
Private Bag X20, Hatfield 0028, South Africa
Eben.Mare@up.ac.za

