


Services on Demand
Article
 English (pdf)
 Article in xml format
 Article references
Indicators

Related links
-
 Cited by Google
 -
 Similars in Google
Share

 Permalink
South African Journal of Science
On-line version ISSN 1996-7489
Print version ISSN 0038-2353
S. Afr. j. sci. vol.111 n.11-12 Pretoria Nov./Dec. 2015
http://dx.doi.org/10.17159/sajs.2015/20140279
RESEARCH ARTICLE
Potential human impact on the environmental central niche of the chacma baboon
Olivia M.L. StoneI; Shawn W. LaffanI; Darren CurnoeI; Andy I.R. HerriesII
ISchool of Biological Earth and Environmental Science, University of New South Wales, Sydney, Australia
IIDepartment of Archaeology and History, College of Arts, Social Science and Commerce, La Trobe University, Melbourne, Australia
ABSTRACT
We assessed the human impact on regions identified as the environmental central niche for the chacma baboon (Papio ursinus) across southern Africa. This central niche is the area within an animal's natural range that is most insulated from changes to the environmental variables that influence that animal's distribution. We used an environmental envelope model constructed with geographic information system software to predict the geographic extent of the central niche. The predicted chacma baboon central niche was 389 000 km2, with substantial overlap with human settlements in several countries. Of note is that although Botswana contains nearly 60 000 km2 of predicted central niche, the International Union for the Conservation of Nature chacma baboon distribution map implies that much of this area is uninhabited by baboons. A regional assessment of the province of KwaZulu-Natal (South Africa) suggests more than 95% of its central niche is uninhabited. Additionally, the very limited and likely disturbed central niche area in Lesotho coupled with the unknown status of chacma baboons within Lesotho warrants further attention. Overall, it appears likely that significant proportions of the predicted central niche in southern Africa are currently uninhabited by the chacma baboon. These uninhabited areas correspond with areas of high human population density and anthropogenic land alteration. The remaining central niche areas that are still inhabited are potentially key areas for conservation and are important for ensuring the sustainability of future populations. However, these areas may be undergoing degradation whilst also becoming more inaccessible to baboons, thus increasing the difficulty of conservation efforts. This preliminary assessment highlights the urgent need for detailed assessments at a finer scale.
Keywords: Papio ursinus; habitat distribution; GIS; core habitat; anthropogenic impact
Introduction
Human population expansion has left many other animal species with decreased available habitat or has forced them into direct competition with humans. Primates in particular are greatly affected by anthropogenic land alteration and land use conflict. As 48% of primate species are listed as 'vulnerable', 'endangered' or 'critically endangered' by the International Union for the Conservation of Nature (IUCN), including 37% of all African primates1, habitat fragmentation can be extremely detrimental to population size and dynamics and metapopulation survival2. Often these same animals are in direct competition with humans, become known as pest species and suffer considerable persecution.3 In many cases these persecuted species are those less charismatic fauna that are believed to be abundant. The chacma baboon (Papio ursinus) is one such animal.
Data on the relationship between a species and its habitat can provide fundamental information about distribution patterns, migration, population size and density. These data can be crucial for informing conservation efforts. Obtaining data about areas most valuable to a species will allow assessments of ecological requirements and help target geographical regions crucial to species sustainability. These types of data are undefined for the chacma baboon, a species with a supposed broad distribution across much of southern Africa.4 Although the chacma baboon is classified as being of 'least concern',5,6 further investigation into chacma baboon distribution is warranted by the recent recognition that the distribution within at least one province (KwaZulu-Natal, South Africa) is now highly fragmented owing to anthropogenic land alteration, resulting in declining and fragmented populations.7 Until recently, there were only qualitative published predictions detailing the current distribution of the chacma baboon,8-10 although this situation is changing, with a quantitative predicted habitat distribution prior to anthropogenic land disturbance now available.11
Previous studies refer to potentially important areas as prime or core habitat, but there is no consensus on the use of these terms. Rather there are several definitions, ranging from areas buffered from human disturbance, used in landscape assessments12 to any area of habitat large enough to support at least one animal of the target species, as applied in giant panda (Ailuropoda melanoleuca) habitat predictions.13 Core habitat has been identified as the area most frequently utilised, which can vary from feeding and ranging in howler monkeys (Alouatta palliata)14to den and rendezvous locations in grey wolves (Canis lupus)15. Alternatively, core habitat has been described as the area where the population can successfully survive and reproduce with the inclusion of intervening lands for dispersal.16 Core or prime habitat could also refer to habitat within an individual animal's home range or to areas identified within the total range of a species. The chacma baboon has no species-specific core habitat definition and available core habitat definitions are unsuitable. However, as the chacma baboon occupies a range of environments throughout southern Africa9,10,17-18, and as environmental variables are most influential over a continental extent19, modelling with environmental variables becomes the primary option. Consequently, we proposed and investigated the environmental central niche.
We describe the central niche as that within an animal's fundamental niche (where the fundamental niche is the full environmental range, including land and resources, with the potential to be inhabited, in the absence of limiting factors such as species competition). The central niche is land that is insulated and protected from the environmental extremes that influence the animal's distribution. Such areas are likely to place less stress on the animals, offer more favourable habitat and thus increase species survival. This statement is based on the assumption that individuals tend to live within the most advantageous habitat available to them. The central niche can contain a variety of different habitats and does not limit the total species range.
The aim of this study was to identify the chacma baboon's central niche and to compare it with human occupation and, by association, land disturbance. We used climatic data to predict the central niche of the chacma baboon.
Methods
Central niche areas are the set of geographical locations that fall within the central part of the environmental range for each of the environmental variables known to influence an animal's distribution. These ranges are determined using species observation records. The central 50% is identified as those locations which fall within the inter-quartile range of a set of environmental variables. Therefore, we estimate that approximately 50% of our known baboon populations are living within these limits. Using the central part of the range allows for a buffer (25%) to counter for outliers and less favourable conditions, whilst locating the land areas with the potential to have the most ideal and stable conditions.
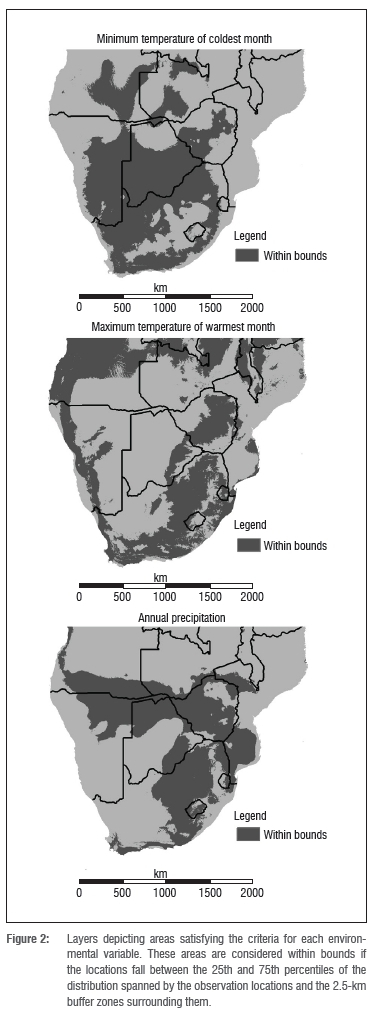
We employed an environmental envelope model to identify the areas that satisfy the central 50% of the range for the environmental variables affecting baboon distribution. The approach used follows that of Stone et al.11 Briefly, we defined the environmental envelope using data derived from the Worldclim data set.20 Then, based on the actual ranges inhabited by the animals, land satisfying certain requirements is identified. Stone et al.11 identified mean maximum temperature of the warmest month, mean minimum temperature of the coldest month, mean annual rainfall and altitude as the most likely environment variables to affect the distribution. The components of the model described here differ from Stone et al.11 in that the ranges of temperature and rainfall used here were defined only for the central 50% and altitude was excluded because of its minimal effect on the central range. We used the Worldclim data set (resolution 30 arc seconds),20 as it provided surfaces of the climatic variables.
The environmental data sets were sampled using 459 locations (each with a 2.5-km buffer)11 known to have been inhabited by baboons (Figure 1). Both current and historical (within the last 100 years) location data were used to establish the environmental variable ranges. Any location data with a positional error exceeding 1 km were excluded. To prevent bias from areas of spatially dense samples, all location data were declustered. The end result was 459 locations with a more uniform spatial density consistent with the majority of the data. Random selection was used to thin the clustered areas (more detail is provided in Stone et al.11). The environmental conditions were sampled for each of the 459 location points with a 2.5-km radius buffer around each point. This 2.5-km buffer represents the average day range (5 km) for the chacma baboon.811,21-29

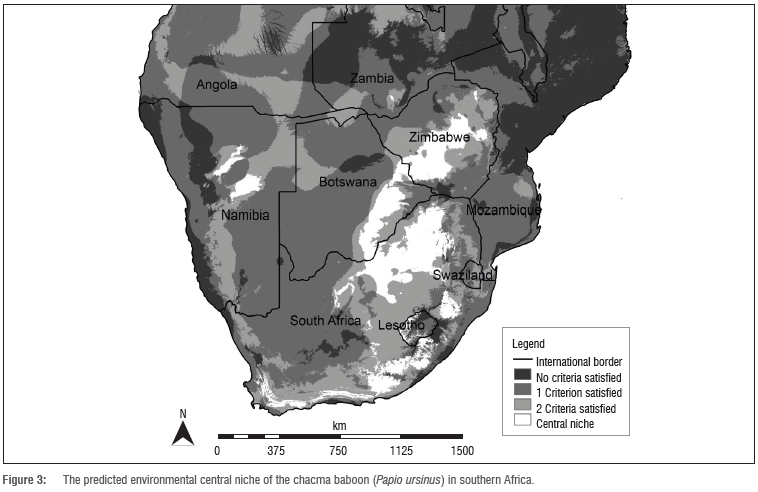
For each environmental variable, the central 50% of the sampled range was identified using the 25th and 75th percentiles (Supplementary figure 1 online). All locations that fell within these bounds (Table 1) were given a value of 1 and those outside were given a value of 0 (Figure 2). The layers were then summed (using ArcGIS 10.0, ESRI, Redlands, CA, USA) to create a layer with a relative scale from 0 (outside the bounds for all variables) to 3 (within the bounds for all variables), with the latter being the predicted environmental central niche.

To assess the validity of the predicted central niche distribution, we needed to confirm if areas of estimated habitat, that are not impacted upon by cities and populated places, currently contained baboons or had contained baboons in the recent past. During fieldwork in August 2009, an area of central niche habitat was identified as satisfying these criteria with a resident population of baboons in rural KwaZulu-Natal, South Africa. Location data (visual sightings of animals and spoor) from throughout KwaZulu-Natal were collected using Garmin eTrex GPS units and additional location data were also recorded on 1:50 000 scale topographical maps as indicated by interviewees known to have reliable knowledge of the animal. Both areas known to be occupied by baboons and areas presumed to be uninhabited by baboons were surveyed. Further detail is provided in Stone et al.7 These data were digitised and entered into the GIS to identify populations within the central niche area. Then, based on the non-habitat specific home range of 15.19 km2,7 we estimated how much of the central niche area in KwaZulu-Natal was inhabited by baboons.
We compared the predicted distribution of the chacma baboon central niche with the IUCN Red List of Threatened Species distribution for the chacma baboon5 to identify areas that may require further investigation as a consequence of potential human impact. The IUCN map was used as it is easily accessible, widely known and generally accepted. The IUCN distribution map is at a continental extent, and depicts the animals as homogeneously distributed across the landscape.
The predicted central niche was then compared against a data set of human population estimates from the WorldPop Project30 used under the Creative Commons Attribution 4.0 International Licence (http:// creativecommons.org/licenses/by/4.0/). These data are provided at a resolution of 3 arc seconds, so were projected into Africa Albers Equal Area Conic at a resolution of 90 m to estimate the population density per km2. We then calculated the fraction of the predicted central niche area that was occupied by human population densities exceeding a set of increasing thresholds (10 to 450 persons per km2).
The central niche prediction was also compared with the distribution of large human settlements to assess how these areas have been affected by human occupation and land disturbance. Populated places were included in the assessment if they satisfied two criteria. Firstly, as a result of the southern African human population data being difficult and sometimes impossible to establish, we chose to use only settlements with population estimates that exceeded 20 000 people. Secondly, these large settlements needed to be contained by, or within 15 km of, predicted central niche areas.
For conservation purposes, the central niche areas in each selected country were overlaid and compared with protected areas31 to gauge how much of the central niche is protected.
Finally, a tenfold cross validation was undertaken to test the reliability of the model. This validation used subsets that were formed by removing 10% of the original data points, randomly selected using R software (version 3.0.2). Each location point was given a buffer (2.5 km) and then converted back to points to sample the environmental data layers. These samples were analysed and the parameters identified and compared (Supplementary table 1 online). The parameters from the 10 samples were used to form layers that were then summed together. This summing resulted in one map (a confidence surface) for each environmental variable.
Results
The central niche model identified approximately 389 000 km2 of core habitat primarily located in six countries: Botswana, Lesotho, Namibia, South Africa, Zambia and Zimbabwe (Figure 3). South Africa and Zimbabwe contain approximately 78% of the predicted area. South Africa contains the largest area of central niche habitat, with approximately 219 570 km2 and, at 462 km2, the smallest area is within Zambia (Table 2). Lesotho also contains only a small area of approximately 3984 km2. The habitat is a central region through northern South Africa, branching westward through southeastern Botswana, leading north to southwestern and central Zimbabwe. The distribution of the central niche is fragmented (which is expected), with large patches in central northern Namibia and more coastal patches leading from the Cape region of South Africa along the eastern coast to KwaZulu-Natal.

Rainfall determines the northern limits of the central niche habitat (Figure 2). With the higher rainfall to the north, coupled with low rainfall in the southwest and higher rainfall in the east, the predicted habitat is limited to a north-south corridor passing through eastern southern Africa and an east-west corridor sweeping from Mozambique to Namibia and marginally into Angola. Rainfall excluded 67% of southern Africa from the central niche.
Large areas, including >75% of Botswana and Mozambique and over 50% of Namibia, were above the bounds of maximum temperature in the hottest month (Figure 2). As an indicative value, approximately 58% of the land south of 10°S is outside the central niche because of this maximum temperature upper bound. In fact, the upper limits for both temperature variables were far more restricting than the lower limits. The upper bound for mean minimum temperature of the coldest month followed a similar pattern and excluded 57% of the land area south of 10°S.
None of the predicted central niche was located within Mozambique, as at least one variable was outside the envelope bounds in every location. Over half of Mozambique's total area was found to be outside the envelope bounds for all the variables, and both temperature variables were excluded as the upper bound was exceeded. Similarly, no central niche was predicted in Swaziland, as the land area was outside either the rainfall or minimum temperature bounds.
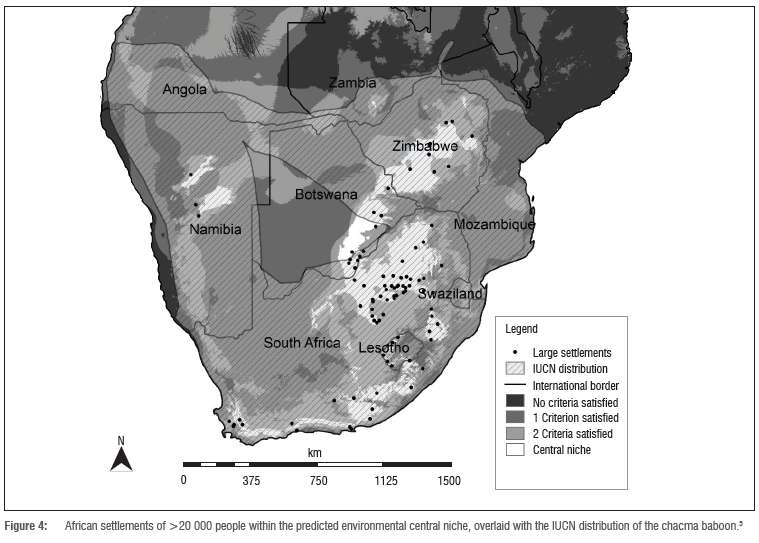
The majority (68%) of the central niche areas have a human population density of less than 10 people per km2. A quarter of the central niche area has a density of between 10 and 100 people per km2 and approximately 4% of the central niche area has a density of more than 200 people per km2. A total of 5760 km2 (1.5%) had a human population density of greater than 450 people per km2. A total of 92 settlements (>20 000 people per settlement) were identified within the designated central niche area or within a distance of 15 km of its edge (Figure 4). Of these settlements, 30 were either provincial capitals (20), national capitals (5) or large cities (5) (Supplementary table 2 online). South Africa had the highest number of populated places, with 62 located within the predicted central niche areas, 4 of which are capital cities. Both Botswana and Lesotho had seven large cities within the central niche zones, including both national capitals, within or near to these areas.
A comparison of the predicted central niche areas with the IUCN distribution (Figure 4) suggests that a large proportion (>40%) of the central niche within Botswana is uninhabited by baboons. Botswana has the third largest area of predicted central niche and the third largest area of central niche land per large settlement (Table 2). Lesotho had the smallest amount of predicted area per settlement (Table 2), with all seven capitals in close proximity to the comparatively small central niche area.
South Africa had the largest area of central niche lands currently protected (approximately 8% of its core area) (Table 2). Namibia protects approximately 46% of its total central niche lands, which equates to the second largest holding of protected central niche. Interestingly, the majority of Namibia's protected central niche (92%) is non-government protected (private freehold and communal conservancies). Overall, approximately 8% of chacma baboon central niche is protected, including 0.03% of the central niche located in Lesotho, 3% in Zimbabwe and 0.2% in Botswana; none of the limited area in Zambia is protected.
Baboons in KwaZulu-Natal were recorded in unprotected central niche zones, despite the population's reliance on protected areas.7 However, our findings suggest that less than 5% of KwaZulu-Natal's central niche is actually inhabited.
Lastly, the tenfold cross validation produced one confidence surface for each variable (Supplementary figure 2 online). A value of 10 identifies land that is always with the envelope and 0 identifies land that is never within the envelope bounds. The current central niche is predicted to cover approximately 389 000 km2 of land (7% of available land south of 10°S); this tenfold cross validation results in central niche predictions ranging from approximately 315 000 km2 to approximately 535 000 km2 (or 5% to 9% of land south of 10°S). Areas of reduced confidence are not widespread and there are no substantial areas of conflict with the current central niche areas, thus supporting our prediction.
Discussion
Modelling and limitations
This model is preliminary and there are limitations where data is simply not available at such a large scale. However, we included the best available data and a search of the published literature aided the selection of environmental variables employed. There was a large interspecies variation in habitat mean annual rainfall across the genus,32-35 thus suggesting some differentiation among Papio species. Rainfall indirectly affects plant productivity and species richness and thus food availability,35-39 consequently foraging and ranging patterns, and indirectly distribution, are affected. However, rainfall seasonality was excluded as it was highly geographically restrictive, possibly as environmental extremes are more prevalent over an area as large as southern Africa. For example, rainfall in some inhabited arid areas is so low (<15 mm/year11) that the effect of seasonality becomes nullified. Both temperature variables are included because of their direct and indirect influence on distribution;21'22,40-43 and altitude was excluded as it was found to have very little effect on the central range, possibly because of the already limiting effects of temperature.
This model predicts potential liveable environmental ranges and not an actual distribution. Therefore, the dates of the baboon location data are not required. More pertinent was the accuracy of the location data in order to sample the correct environmental conditions. Equally the human settlement data were chosen for accuracy. We found population estimates exceeding 20 000 to be more consistent and large enough to cause considerable land disturbance. The 15-km buffer allowed for urban, sub-urban and semi-rural spread from the datum and the baboons' ability to range towards the settlements (up to 19.3 km daily22).
There is no accurate up-to-date distribution map for the chacma baboon and we acknowledge the limitations arising from using the IUCN distribution, including undisclosed data accuracy. Whilst this map is useful for comparison, it does not consider regional or even international variations in distribution. Therefore, it can only be a guide for further research. Regional assessments have yet to be undertaken in most areas of southern Africa.
Modelling over a continental extent means variations in environmental conditions over time (from the last 100 years) are smoothed out and there are likely to be areas included that are uninhabited by baboons, e.g. drought-affected areas. Furthermore, as Worldclim data are already temporally averaged, we expect the model to overestimate the land area. Although the model is mathematically derived, it is still based on the biological (environmental) requirements for the central section of the population (the central part of the range of the environmental conditions inhabited) and will encompass mean and median conditions encountered by actual populations. We expect the central niche areas to include only a small proportion of the entire species range. Nonetheless, these areas have the best potential to persist in adverse environmental conditions as a result of the large buffers (25%) afforded by the analysis. We cannot know whether the bounds include the entirety of the area most likely to promote species survival, nor can we determine if all less suitable areas are excluded. However, this central niche method does produce a quantitative, repeatable and testable hypothesis.
Core habitat and other baboon species
The area of core habitat is approximately 10% of the estimated total suitable habitat11 as large areas of potential habitat are excluded from the central niche areas. This exclusion is because of a narrow range of rainfall (409-788 mm in the core habitat compared with a range of 15- 1555 mm for chacma baboon distribution11), and because temperatures are too hot over much of the potential range (e.g. in Mozambique).
The chacma baboon core habitat is extremely limited north of the Zambezi River, which is a putative transition or contact zone for Kinda baboons (Papio kindae), yellow baboons (Papio cynocephalus) and chacma baboons.18,44,45 It is possible that species interaction could limit chacma baboon access to the central niche areas north of the Zambesi. However, assuming competitive exclusion, any contact should occur at the edges of the whole distribution, thus it is unlikely to occur at the edges of the central niche. Equivalent studies would need to be undertaken for both Kinda and yellow baboons to further investigate potential impact from species competition.11
Anthropogenic disturbance
The absence of baboons in Botswana's eastern central niche area, as depicted by the distribution shown in the IUCN map, may be related to the large number of major settlements within this region. Seven of the major settlements are capital cities including six provincial capitals and Gaborone, the national capital. It is possible that this land disturbance may have adversely affected baboon distribution. Botswana's central niche land area per settlement was third largest amongst the southern African countries (Table 2). Yet if the area per settlement is recalculated excluding the area that the IUCN reported as uninhabited by baboons, the land per settlement drops from 5368 km2 to 3836 km2, a reduction of 29% with nine cities remaining within the predicted central niche habitat.
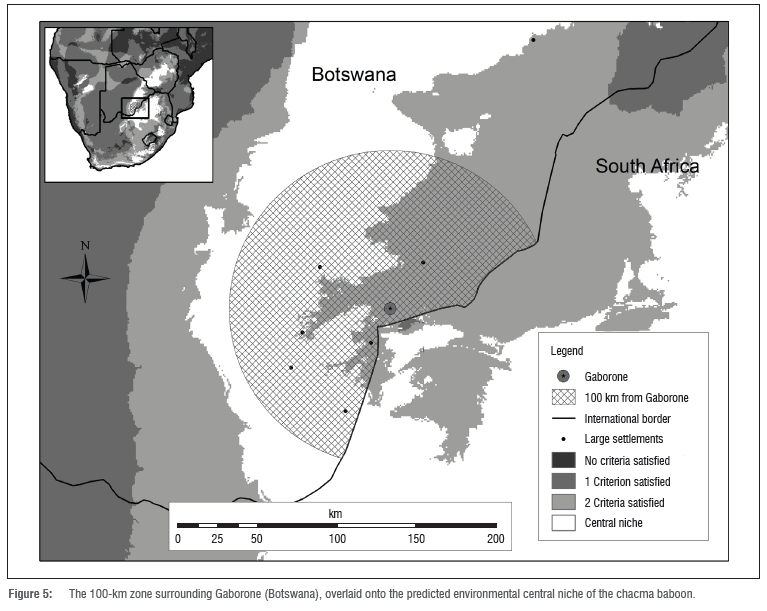
The settlements in southeastern Botswana can be seen as a geographical cluster in the central niche area (Figure 4). This cluster includes or is adjacent to land that is uninhabited by baboons according to the IUCN distribution map. It is possible that the land in Botswana that is potentially the most valuable to the chacma baboon may be significantly compromised with regard to both ecological integrity and baboon access to the area. This land in southeastern Botswana is climatically compatible and has no major geographical barrier separating it from adjacent South African baboon populations, yet baboons are reportedly absent. Botswana's urban satellite villages are rapidly increasing in size, with urban villages growing faster than modern towns and cities.46 In 1991, 50% of the national population of Botswana resided within 100 km of Gaborone.47 Twenty years later the national population had reached over 2 million,46 making Gaborone one of the fastest growing capital cities in Africa. The land disturbance within 100 km of Gaborone will likely be extensive as a result of this population growth. This 100-km zone encompasses a considerable proportion of the predicted central niche area in Botswana (Figure 5) and the central niche within this zone has a mean human population density of 21 people per km2. This area of central niche has a higher mean density than 76% of the total central niche land and Gaborone itself has a population density of 1160 people per km2.30
Moreover there are many smaller settlements (with a human population <20 000), often in close proximity to the larger settlements, which are not depicted in Figure 5. These findings may help to explain why baboons are not found in some of these potentially viable areas.
Anthropogenic land disturbance in Lesotho may also be impacting baboons. The amount of central niche predicted within Lesotho is small. Our model predicts a total of 3984 km2 of land in close proximity to seven major settlements (Supplementary figure 3 online). This figure provides an estimate of only 569 km2 per city, all of which are provincial capitals. It is likely that these animals would be greatly affected by anthropogenic land alteration. The status of baboons in Lesotho deserves further investigation.
Conservation planning and protected areas
This model of predicted central niche areas has direct implications for conservation planning. The 92 large settlements identified within the central niche zone increases the likelihood of land disturbance in these areas. With conservation of the chacma baboon a growing concern, conservation authorities may have difficulty acquiring or even maintaining protected areas within central niche zones. Baboons are a highly adaptable, resilient species. Thus, if baboon populations are noted to decline over larger areas, then the more inflexible species will have already suffered. Human land use and human occupation can leave land transformed and deconditioned48,49 and form physical barriers to wildlife. Although there are many protected areas within these zones, especially in South Africa, these areas are fragmented and separated by long distances. In addition, baboons are not always safe in these protected areas, as they often are culled when it is perceived that they have become problematic.
There are baboon populations occupying the core area to the east of Johannesburg and Pretoria. This area is under constant threat of development; however, the region is partly protected from major development by the Cradle of Humankind UNESCO World Heritage area and the Magaliesberg Protected Natural Environment. It is critical that we maintain these protected environments and protect similar and surrounding locations that are being encroached by new developments. As human population density and its resulting influence are increasing,5052 areas of core habitat with lower human population density and potentially less degradation become ideal conservation areas (Supplementary figure 4 online).
The review of this central niche prediction is a preliminary assessment which highlights the need for more detailed assessments in localised areas. Current and accurate location data are very limited and, with the exception of KwaZulu-Natal,7 no regional assessments are published. There are spot assessments covering smaller areas and assessments of individual troops,27'29,35,53,54 but nothing that would enable quantitative regional assessments. In addition, we have little detailed associated data regarding the surroundings of the very limited location data we can access. For the most part, we do not have enough information even for localised basic assessments. The lack of data includes but is not limited to some auxiliary data such as baboon abundance, permanent water sources (including small human-made farming adaptations or even streams or springs), flora, fauna and land usage at locations. As a preliminary assessment at a continental scale we did not presume to expect such data or detail; however the overall lack of such data severely limits further analysis. Further regional assessments need to be undertaken and it is unlikely that these will progress without prior sub-regional assessments. These sub-regional assessments need to be specific to their local populations, and should assess viable population sizes and land requirements, including access to more valuable land areas.
This central niche prediction is a best estimate, formed using data sets that are themselves interpolated from raw data. This interpolation, combined with location data from the last 100 years, means that subtle changes in environmental conditions are smoothed out over the continental scale and the prediction is most likely to be an overestimate. We acknowledge the central niche is only the central habitat located within a much wider range occupied by baboons, but if future research finds these areas of key habitat are not able to support healthy populations then the concern must be that areas less conducive to survival will be undergoing a greater loss.
Acknowledgements
Location data used in the modelling were provided by Amathole Museum, Ezemvelo Wildlife, Iziko South African Museum, National Museum Bloemfontein and the Ditsong National Museum of Natural History (formerly the Transvaal Museum). We thank Ezemvelo KZN wildlife staff and residents of KwaZulu-Natal who assisted us in locating baboon troops and the anonymous reviewers whose comments much improved this manuscript. A.I.R.H. was supported by an Australian Research Fellowship as part of ARC Discovery Grant DP0877603 and ARC Future Fellowship FT 120100399.
Authors' contributions
All authors conceived the study; O.M.L.S., S.W.L. and A.I.R.H. collected the data; O.M.L.S. undertook the analysis; and O.M.L.S. led the writing with revisions undertaken by all authors.
References
1. IUCN. Primate fact sheet [document on the Internet]. c2008 [cited 2011 Oct 23]. Available from: http://cmsdata.iucn.org/downloads/primate_fact_sheet_2008_final.pdf; [ Links ]
2. Ewers RM, Didham RK. The effect of fragment shape and species' sensitivity to habitat edges on animal population size. Conserv Biol. 2007;21(4):926-936. http://dx.doi.org/10.1111/j.1523-1739.2007.00720.x [ Links ]
3. Lee PC, Priston NEC. Human attitudes to primates: perceptions of pests, conflict and consequences for primate conservation. In: Patterson JD, Wallace J, editors. Commensalism and conflict: The human-primate interface. Alberta: American Society of Primatologists; 2005. p. 1-23. [ Links ]
4. Jolly CJ. Species, subspecies and baboon systematics. In: Kimbel WH, Martin LB, editors. Species concepts and primate evolution. New York: Plenum Press; 1993. p. 67-107. http://dx.doi.org/10.1007/978-1-4899-3745-2_4 [ Links ]
5. Hoffman M, Hilton-Taylor C. Papio ursinus: IUCN Red List of Threatened Species, Version 2011.1 [document on the Internet]. c2008 [cited 2011 July 06]. http://dx.doi.org/10.2305/IUCN.UK.2008.RLTS.T136856A4347282.en [ Links ]
6. Friedmann Y, Daly B. Red data book of the mammals of South Africa: A conservation assessment. Johannesburg: CBSG Southern Africa, Conservation Breeding Specialist Group (SSC/IUCN), Endangered Wildlife Trust; 2004. [ Links ]
7. Stone OML, Laffan SW, Curnoe D, Rushworth I, Herries AIR. Distribution and population estimate for the chacma baboon (Papio ursinus) in KwaZulu-Natal, South Africa. Primates. 2012;53(4):337-344. http://dx.doi.org/10.1007/s10329-012-0303-9 [ Links ]
8. Anderson CM. Baboons below the tropic of capricorn. J Hum Evol. 1982;11(3):205-217. http://dx.doi.org/10.1016/S0047-2484(82)80037-7 [ Links ]
9. Baldwin LA, Teleki G. Field research on baboons, drills, and geladas: An historical, geographical, and bibliographical listing. Primates. 1972;13(4):427-432. http://dx.doi.org/10.1007/BF01793662 [ Links ]
10. Hall KRL. Variations in the ecology of the chacma baboon, Papio ursinus. Symp Zool Soc Lond. 1963;10:1-28. [ Links ]
11. Stone OML, Laffan S, Curnoe D, Herries AIR. The spatial distribution of chacma baboon (Papio ursinus) habitat based on an environmental envelope model. Int J Primatol. 2013;34(2):407-422. http://dx.doi.org/10.1007/s10764-013-9669-9 [ Links ]
12. Goetz SJ, Jantz P, Jantz CA. Connectivity of core habitat in the northeastern United States: Parks and protected areas in a landscape context. Remote Sens Environ. 2009;113(7):1421-1429. http://dx.doi.org/10.1016/j.rse.2008.07.019 [ Links ]
13. Linderman M, Bearer S, An L, Tan Y, Ouyang Z, Liu J. The effects of understory bamboo on broad-scale estimates of giant panda habitat. Biol Conserv. 2005;121(3):383-390. http://dx.doi.org/10.1016/j.biocon.2004.05.011 [ Links ]
14. Williams-Guillén K, McCann C, Martinez Sanchez J, Koontz F. Resource availability and habitat use by mantled howling monkeys in a Nicaraguan coffee plantation: Can agroforests serve as core habitat for a forest mammal? Anim Conserv. 2006;9(3):331-338. [ Links ]
15. Blanco JC, Cortés Y Virgós E. Wolf response to two kinds of barriers in an agricultural habitat in Spain. Can J Zool. 2005;83(2):312-323. http://dx.doi.org/10.1139/z05-016 [ Links ]
16. Helferty N. Natural heritage planning for amphibians and their habitats: With reference to populations on the south slope of the Oak Ridges Moraine. Supplementary report for Oak Ridges Moraine Richmond Hill Ontario Municipal Board Hearing, Save the Rouge Valley System Inc. and the City of Toronto. Ontario: Natural Heritage Consulting; 2002. [ Links ]
17. Sithaldeen R, Bishop JM, Ackermann RR. Mitochondrial DNA analysis reveals Plio-Pleistocene diversification within the chacma baboon. Mol Phyl Evol. 2009;53(3):1042-1048. http://dx.doi.org/10.1016/j.ympev.2009.07.038 [ Links ]
18. Zinner D, Wertheimer J, Liedigk R, Groeneveld LF, Roos C. Baboon phylogeny as inferred from complete mitochondrial genomes. Am J Phys Anthropol. 2013;150(1):133-140. http://dx.doi.org/10.1002/ajpa.22185 [ Links ]
19. Pearson RG, Dawson TP Predicting the impacts of climate change on the distribution of species: Are bioclimate envelope models useful? Glob Ecol Biogeogr. 2003;12(5):361-371. http://dx.doi.org/10.1046/j.1466-822X.2003.00042.x [ Links ]
20. Hijmans RJ, Cameron SE, Parra JL, Jones PG, Jarvis A. Very high resolution interpolated climate surfaces for global land areas. Int J Climatol. 2005;25:1965-1978. http://dx.doi.org/10.1002/joc.1276 [ Links ]
21. Stoltz LP Saayman GS. Ecology and behaviour of baboons in the Northern Transvaal. Ann Transvaal Mus. 1970;26(5):99-143. [ Links ]
22. Hall KRL. Numerical data, maintenance activities and locomotion in the wild chacma baboon, Papio ursinus. Proc Zool Soc Lond. 1962;139(2):181-220. http://dx.doi.org/10.1111/j.1469-7998.1962.tb01831.x [ Links ]
23. Brain C. Spatial usage of a desert environment by baboons (Papio ursinus). J Arid Environ. 1990;18:67-73. [ Links ]
24. Davidge C. Ecology of baboons (Papio ursinus) at Cape Point. Zool Afr. 1978;13:329-350. http://dx.doi.org/10.1080/00445096.1978.11447633 [ Links ]
25. Gaynor D. Foraging and feeding behaviour of chacma baboons in a woodland habitat [PhD thesis]. Durban: University of Natal; 1994. [ Links ]
26. Hamilton WJ. Namib Desert chacma baboon (Papio ursinus) use of food and water resources during a food shortage. Madoqua. 1986;14(4):397-407. [ Links ]
27. Marais AJ. Resource utilisation of the chacma baboon in different vegetation types in north-eastern mountain sour veld, Blyde Canyon Nature Reserve [dissertation]. Pretoria: University of South Africa; 2005. [ Links ]
28. Van der Weyde L. Ecology of chacma baboons, Papio hamadryas ursinus, in a semi-desert environment in South Africa. Sydney: University of New South Wales; 2004. [ Links ]
29. Whiten A, Byrne R, Henzi S. The behavioral ecology of mountain baboons. Int J Primatol. 1987;8(4):367-388. http://dx.doi.org/10.1007/BF02737389 [ Links ]
30. Linard C, Gilbert M, Snow RW, Noor AM, Tatem AJ. Population distribution, settlement patterns and accessibility across Africa in 2010. PLoS One. 2012;7(2):e31743. http://dx.doi.org/10.1371/journal.pone.0031743 [ Links ]
31. IUCN, UNEP. The World Database on Protected Areas (WDPA). Cambridge, UK: UNEP-WCMC; 2015. [ Links ]
32. Biquand S, Biquand-Guyot V Boug A, Gautier J-P. The distribution of Papio hamadryas in Saudi Arabia: Ecological correlates and human influence. Int J Primatol. 1992;13(3):223-243. http://dx.doi.org/10.1007/BF02547815 [ Links ]
33. Dunbar RIM, Dunbar EP Ecological relations and niche separation between sympatric terrestrial primates in Ethiopia. Folia Primatol. 1974;21(1):36-60. http://dx.doi.org/10.1159/000155595 [ Links ]
34. Barrett L, Henzi SP. An inter-population comparison of body weight in chacma baboons. S Afr J Sci. 1997;93(10):436-438. [ Links ]
35. Hamilton WJ, Buskirk RE, Buskirk WH. Defense of space and resources by chacma (Papio ursinus) baboon troops in an African desert and swamp. Ecology. 1976;57(6):1264-1272. [ Links ]
36. Kay RF, Madden RH, Van Schaik C, Higdon D. Primate species richness is determined by plant productivity: Implications for conservation. Proc Natl Acad Sci USA. 1997;94(24):13023-13027. http://dx.doi.org/10.1073/pnas.94.24.13023 [ Links ]
37. O'Brien EM. Climatic gradients in woody plant species richness: Towards an explanation based on an analysis of southern Africa's woody flora. J Biogeogr. 1993;20(2):181-198. http://dx.doi.org/10.2307/2845670 [ Links ]
38. Hamilton W. Demographic consequences of a food and water shortage to desert chacma baboons, Papio ursinus. Int J Primatol. 1985;6(5):451-462.http://dx.doi.org/10.1007/BF02735570 [ Links ]
39. Barton RA, Whiten A, Strum SC, Byrne RW, Simpson AJ. Habitat use and resource availability in baboons. Anim Behav. 1992;43:831-844. http://dx.doi.org/10.1016/S0003-3472(05)80206-4 [ Links ]
40. Henzi S, Byrne R, Whiten A. Patterns of movement by baboons in the Drakensberg mountains: Primary responses to the environment. Int J Primatol. 1992;13(6):601-629. http://dx.doi.org/10.1007/BF02551256 [ Links ]
41. Korstjens AH, Lehmann J, Dunbar R. Resting time as an ecological constraint on primate biogeography. Anim Behav. 2010;79(2):361-374. http://dx.doi.org/10.1016/j.anbehav.2009.11.012 [ Links ]
42. Hill RA. Thermal constraints on activity scheduling and habitat choice in baboons. Am J Phys Anthropol. 2006;129:242-249. http://dx.doi.org/10.1002/ajpa.20264 [ Links ]
43. Hill RA. Day length seasonality and the thermal environment. In: Brockman DK, Van Schaik CP editors. Seasonality in primates: Studies of living and extinct human and non-human primates. Cambridge, UK: Cambridge University Press; 2005. p. 197-214. http://dx.doi.org/10.1017/CBO9780511542343.008 [ Links ]
44. Keller C, Roos C, Groeneveld LF, Fischer J, Zinner D. Introgressive hybridization in southern African baboons shapes patterns of mtDNA variation. Am J Phys Anthropol. 2010;142(1):125-136. http://dx.doi.org/10.1002/ajpa.21209 [ Links ]
45. Jolly CJ, Burrell AS, Phillips-Conroy JE, Bergey C, Rogers J. Kinda baboons (Papio kindae) and grayfoot chacma baboons (P ursinus griseipes) hybridize in the Kafue River Valley, Zambia. Am J Primatol. 2011;73(3):291-303. http://dx.doi.org/10.1002/ajp.20896 [ Links ]
46. Majelantle A. Population & housing census: Preliminary results brief. Gaborone: Census Office, General Statistics Office Botswana; 2011. [ Links ]
47. Gwebu T. Patterns and trends of urbanization in Botswana and policy implications for sustainability. Gaborone: Department of Environmental Science, University of Botswana; 2004. [ Links ]
48. Mills A, Fey M. Declining soil quality in South Africa: Effects of land use on soil organic matter and surface crusting. S Afr J Sci. 2003;99(9):429-436. [ Links ]
49. Reynolds JF, Maestre FT, Kemp PR, Stafford-Smith DM, Lambin E. Natural and human dimensions of land degradation in drylands: Causes and consequences. In: Canadell J, Pataki D, Pitelka lF, editors. Terrestrial ecosystems in a changing world. Berlin: Springer-Verlag; 2007. p. 247-257. http://dx.doi.org/10.1007/978-3-540-32730-1_20 [ Links ]
50. Lehohla P Mid-year population estimates 2014. Pretoria: Statistics South Africa; 2014. [ Links ]
51. Steytler J. Namibia population projections 2011-2041. Windhoek: Namibia Statistics Agency; 2014. [ Links ]
52. Majelantle A. Population and housing census 2011: Analytical report. Gaborone: General Statistics Office Botswana; 2014. [ Links ]
53. Stoltz LP Keith ME. A population survey of chacma baboon in the Northern Transvaal. J Hum Evol. 1973;2:195-212. http://dx.doi.org/10.1016/0047-2484(73)90076-6 [ Links ]
54. Hoffman T, O'Riain MJ. The spatial ecology of chacma baboons (Papio ursinus) in a human-modified environment. Int J Primatol. 2011;32(2):308-328. http://dx.doi.org/10.1007/s10764-010-9467-6 [ Links ]
 Correspondence:
Olivia Stone
School of Biological Earth and Environmental Science, University of New South Wales
High St. Kensington, Sydney New South Wales 2052
Australia
Email: oliviamlstone@gmail.com
Received: 12 Aug. 2014
Revised: 29 Jan. 2015
Accepted: 08 Apr. 2015

