


Serviços Personalizados
Artigo
 Inglês (pdf)
 Artigo em XML
 Referências do artigo
Indicadores

Links relacionados
-
 Citado por Google
 -
 Similares em Google
Compartilhar

 Permalink
South African Journal of Science
versão On-line ISSN 1996-7489
versão impressa ISSN 0038-2353
S. Afr. j. sci. vol.111 no.11-12 Pretoria Nov./Dez. 2015
http://dx.doi.org/10.17159/sajs.2015/20140186
RESEARCH ARTICLE
Housing and population sprawl near tailings storage facilities in the Witwatersrand: 1952 to current
Melanie A. KneenI; Matthew E. OjeledeII; Harold J. AnnegarnIII
IDepartment of Geosciences, University of Texas at Dallas, Richardson, Texas, United States of America
IIDepartment of AtmosphericSciences, Digby Wells Environmental, Johannesburg, South Africa
IIIEnergy Institute, Faculty of Engineering, Cape Peninsula University of Technology, Cape Town, South Africa
ABSTRACT
Mining, tailings storage facilities (TSFs), dust pollution and growth in residential housing development are synonymous with the Witwatersrand, South Africa. Encroachment of housing onto land close to TSFs, i.e. areas rendered marginal because of the dust hazard and risk of structural failure, has continued unabated for decades, intensifying human exposure to windblown mineral dust. Recent research indicates that the finer milling used for modern gold extraction results in aeolian dust emanating from the TSFs which contributes to a higher proportion of inhalable particles in the source material. Air quality dispersion modelling, validated by ambient aerosol monitoring campaigns, indicates that episodic dust events generate particulate matter (PM10) and, specifically, quartz dust concentrations that are unhealthy at distances of up to 2 km downwind from TSFs. This contribution documented residential development from 1952 to 2011 (using historical aerial photographs, census data from 2001 and 2011 and ancillary information) to determine the population exposed to dust emanations from the TSFs. Using the images, land use was classified into residential areas, TSF footprints and open areas, onto which a series of 500 m buffer zone contours were superimposed. The resulting statistics were used to assess the populations exposed to dust hazard within the defined buffer zones. Overall, housing development has experienced a growth of approximately 700% since 1952 at a rate of 14% per year. Analysis of recent monitoring campaign data has confirmed multiple occurrences of quartz-rich inhalable dust in residential settings at levels that exceed occupational health standards, extrapolated to values for population exposure.
Keywords: aeolian dust; residential population; quartz; silicosis risk; calculating exposed population
Introduction
Evolution in social, economic and political landscapes often shapes population growth, migration and settlement patterns, which in turn often influence the net environmental risks to populations. This is particularly evident in Asian and African countries.15 A growth projection of 2.4% over a twenty-year period (between 2000 and 2020) suggested for sub-Saharan Africa, is higher than for other developing regions (1.3%) and the developed world (0.1%). Cities in African countries will experience an additional 150 million residents because of 'high rates of rural-out migration'.3 In South Africa, the transformation into an urban, socio-economic and political space has been ongoing since the discovery of gold in the mid-1890s, with gold mining initiating an unusually rapid population growth. Influxes of migrant labourers led to the proliferation of makeshift houses, the establishment of mining camps and eventually towns and cities - areas which continue to evolve. Events on the Witwatersrand have defied the norm whereby, on the cessation of mining, surrounding settlements usually become ghost towns. By contrast, prospecting, excavation, processing a range of ore minerals and the reclamation of legacy gold mine tailings continue to make mining a major regional industry. This process has made the Witwatersrand region a vibrant economic hub.4
Tailings storage facilities (TSFs) are intertwined with built-up areas and other mine features in the Witwatersrand.6,7 With sparse vegetation cover and the reworking of older TSFs for their residual gold content, exposure to windgenerated mineral dust presents an intermittent but persistent environmental hazard for nearby residents.6,8 As part of evolving technology for gold extraction, the reclaimed TSF material is milled to a much finer grade (down to 30 μm, considerably smaller than the previous 70 μm diameter). This greatly increases the fraction of inhalable material or PM10 (i.e. less than 10 μm aerodynamic diameter particles which can be inhaled) in the tailings material. Investigation into detailed size and chemical characterisation of material and ambient airborne dust exposure is ongoing, as is an epidemiological survey aimed at quantifying the associated human health risk of exposed residential populations developing silicosis.8 Recent research indicates that dust management faces challenges9, while the increasingly fine material size ranges8,10 coupled with the results of this study (which identifies the extent of the population being exposed) makes mitigating the negative effects a priority.
While international standard practice and local mining regulations prohibit or avoid locating residential areas closer than 500 m from TSFs,11 the earliest aerial photographic images of the areas within that distance around Johannesburg's TSFs, clearly show that housing development has been continuing despite the recent data on the emerging increase in health risks for residents.
This study assesses the growth of housing developments near the gold mine TSFs of the Witwatersrand over the past 50 years and evaluates changes in the population exposed to windblown dust emanations from the TSFs. This information forms a critical component of the process of evaluating net risk, and in quantitatively assessing benefit-to-cost ratio of proposed mitigation strategies that depend on scarce resources, such as water, for dust mitigation.
Background
Prior to the 1950s, the sites selected for deposition of gold mining residues were in sparsely populated areas mainly covered with savannah grassland, colloquially known as veldt, with grass or low shrubs and few trees. Nearest residential areas were 3-4 km distant from the margins of the TSFs. From the 1950s onwards, rapid expansion of mining led to the socio-economic growth of Johannesburg and surroundings, with rapid urbanisation to the north and the simultaneous development of dormitory suburbs in the area south of the Witwatersrand ridge (through the forced resettlement policies of the apartheid-era government). In the post-apartheid era, after 1994, with newfound political freedom and removal of restrictions on movement of citizens of colour, there has been a surge in rural-urban migration by people in search of a better livelihood, leading to the increased development of formal and informal housing.
There is currently a housing backlog in South Africa and increased pressure for further housing developments, particularly on remaining open land within the greater city limits, along the Witwatersrand mining corridor. These historical forces have shaped the housing patterns and dynamics, resulting in extensive infill of vacant land that had constituted the safety buffer zone near both active and dormant TSFs, thereby aggravating the exposure to health hazards and environmental consequences of dust pollution from the TSFs.8
With 270 TSFs in the region,12 several topics - such as the extensive development, continued surge in migrant labourers, great land pressure issues, public health concerns associated with exposure to airborne mineral quartz dust - have all been the subject of research initiatives.13-20
For the purpose of this research, three large TSFs were selected for investigation of historical changes in population density within the zones of maximum dust exposure: the Crown Gold Recoveries (CGR) complex in central Johannesburg; the Durban Roodepoort Deep (DRD) TSF on the west Witwatersrand; and the East Rand Proprietary Mine (ERPM) TSF complex on the east Witwatersrand. These TSFs, each with areal footprints exceeding 1 km2, besides being the largest three TSFs in the Central Witwatersrand goldfield, represent a range of conditions. The CGR complex is the site of recent active deposition of reprocessed and finer grade material, reclaimed from numerous smaller TSFs which are a legacy of earlier mining efforts when gold extraction processes were less efficient. The DRD complex is dormant, and vegetation from an earlier rehabilitation campaign has been extensively eroded or buried by windblown sand. The ERPM complex is undergoing reclamation that commenced circa 2010, exposing previously vegetated surfaces to wind and water erosion.
In this study, historical and local 'at risk' population density and distribution trends are documented. Detailed algorithms - to expand the analysis to permit rapid application of population location-based risk analysis at regional (citywide) or specific (project or TSF based) scales - were explored.
Data and methods
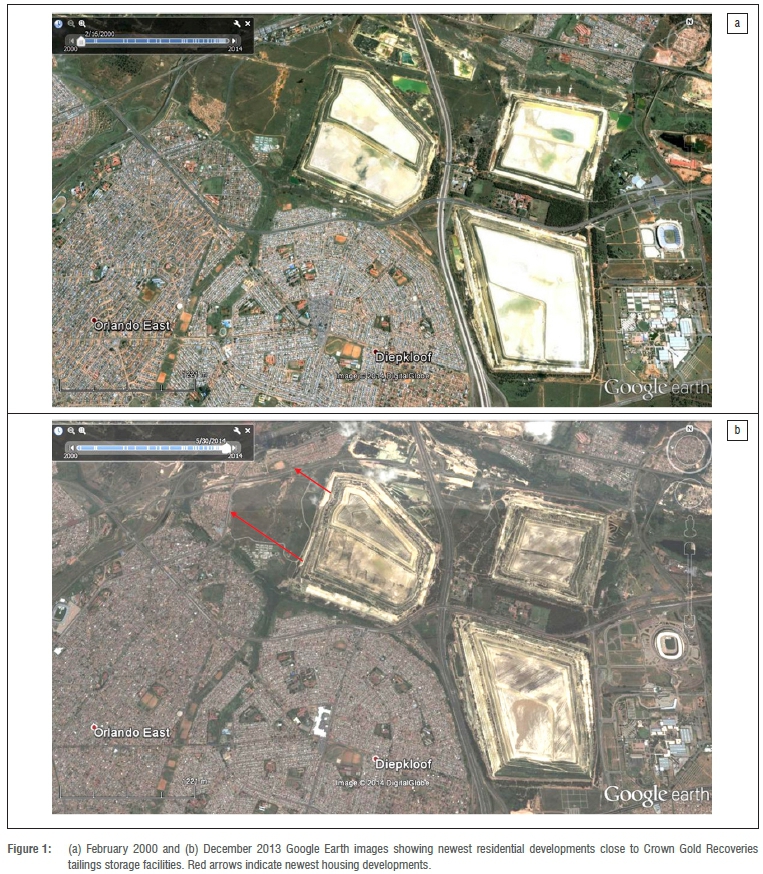
Scanned aerial photographs, drawn from the records of the Chief Directorate of Survey and Mapping21 in Cape Town, South Africa were employed to obtain historical information on residential patterns in relation to the selected TSFs. QuickBird Imagery for 2004 obtained from Southern Mapping Company (Pty) Ltd) and Google Earth historical images (Figure 1) were used to survey changes in residential land use. These were complemented with 1:50 000 topographic maps, which show the extent of formal housing developments, in shapefile format. Census data for 200122 and 201122, with an accurate count of the houses and people within demarcated census areas called 'enumerator areas', were obtained from Statistics South Africa (Stats SA).
Formal housing developments have the advantage that both the structure and housing density have remained fixed for reasonably long periods. With the dwelling density and the area of each dwelling space derived for 2001, the total population and the number of households for earlier periods were estimated. The assumption that the household density and dwelling space ratios, as calculated in the 2001 census data22, remained the same over time was required, because census data coinciding with the image dates do not exist. Matching the historical residential areas in the newer images confirmed that for these formal residential developments, this assumption is reasonable. Because the relationship between land area and number of households has been constant within the study area, the household sizes, and thus the number of people associated with these homes, is also likely to have remained constant.
For several reasons the Census 2001 data22 were the best estimate of the South African population, and therefore served as the basis for estimates of TSF-affected population in this study. This was the first census taken after the end of apartheid and consequently was less influenced by legal and political pressure. The 2001 census data22 covered a wide range of parameters, including household size, income, individuals and their ages. Without the pressure of under-reporting (concealing) illegal occupation, the 2001 census results22 could be treated with more confidence than any studies prior to the political changes in 1994.
Image pre-processing
The digital aerial photographic images and QuickBird imagery were geo-referenced using ground-control points derived from the 1:50 000 topographic maps. Images from the different historical periods were resampled to matching spatial resolutions. The pre-processing continued through making a mosaic of the different scenes, covering the area of interest using both aerial photo and remotely-sensed imagery in each period, typified in Figure 2. Across all images and for all time periods, the geo-referencing was accurate to 1 m or better. Separate images covering the area of interest for the selected years (1952, 1976, 1991 and 2002) for areas surrounding the three TSFs (CGR, DRD and ERPM) were extracted from the mosaic images. These have been illustrated by the series of aerial photographs for the CGR complex for the respective years, 1952, 1976, 1991 and 2002.
Delineation of buffers and polygon outlines and quantification of change
After the mosaic process, three different approaches were adopted to evaluate growth in residential housing developments over time. Firstly, using geographic information system (GIS) spatial analysis tools, buffer zones were defined at distances of 500 m, 1000 m, 1500 m and 2000 m from the edges of the TSFs under survey.
Secondly, on-screen digitising of the areal extent of residential housing developments, within each buffer zone, was performed for the different periods under survey. The areas covered by the digitised polygons were estimated using the statistical tools in TNTmips® (MicroImages 2009), with differences evaluated as the areas changed between successive periods.
Most of the housing developments within the buffer zones of the selected mega-TSFs are formal settlements with permanent structures. Informal settlements (comprising shack dwellings) occur extensively at other locations and around other TSFs in the city, but have not been rated in this study. The benefit of formal housing structures is that once a development has been completed, the number of dwellings remains remarkably stable. While the population might change over time, the number of households can be calibrated and compared with confidence.
The dramatic social and political changes in this region since the 1950s have made the comparison of census data problematic. In this case, population data are best extrapolated from housing changes, quantified as described above, and calibrated to population by the most reliable single census. The census data from 200122 provided the best available count of the houses and people within reporting areas - called enumerator areas - at that point in time. An observed problem is that the enumerator areas include both the open land and the residential areas. By contrast, the 1:50 000 topographic data show the extent of the formal housing developments (which excludes open land) but gives no indication of the actual number of houses and people. Combining these data sets in an ARC® GIS environment, the exact area occupied by residential areas, average dwelling space and the dwelling density in 2001 was computed. It was observed that in neighbourhoods reporting lower incomes (according to the 2001 census data22), properties occupied less space and were more densely populated; higher income neighbourhoods occupied larger expanses of land at a lower density.
Extrapolation to large scale or automated analysis
Once the detailed, specific and historical analysis of the three priority locations had been completed, the next stage was to extend the analysis, using the calibrated and hand checked data to include all the TSFs in the city and across the Witwatersrand. Population densities, derived from 2001 census data22, and dwelling structure footprints from 201123 were used separately to estimate the regional impact of fine dust on residential areas adjacent to mine TSFs. These techniques to estimate automatically population numbers from census22,23 and survey general topographic data, can be applied regionally or to any selected subset of locations.
Two approaches were used to estimate the population living close to the TSF. The 2001 census data22, with the population densities (calculated as described previously), were intersected with the TSF buffers to compute population density polygons within each buffer zone. Within each buffer zone, the exposed population was calculated by multiplying the number of people (or households) per unit area by the area within that buffer zone (Figure 3a).
The first step was to designate buffers around the required land use areas. In this example, both types of TSF locations were used, i.e. older sand dumps, and more recent slimes dam deposits of hydraulically placed tailings material with a median particle grade of 70 μm or less. Buffer distances, of 0.5 km, 0.5-1.0 km, 1.0-1.5 km, 1.5-2.0 km, 2.0-2.5 km and 2.5-3.0 km, were used to assess the population distribution at a range of distances. This range corresponded to distances shown in dispersion modelling studies to be adversely influenced by transport of dust during high wind speed conditions.24 Modelling results24 have been validated against data from particulate matter monitoring campaigns downwind of the studied TSFs. Monitoring results confirmed that the frequency and intensity of dust episodes are directly related to the strength and frequency of high wind speeds.8
The analysis undertaken with the 2001 census data22 was then repeated using the 2011 census data23. Additionally, and of more interest, the 2011 census data23 released for this project included access to a shapefile of the 'external dwelling frame' locations - i.e. the fixed structure, formal houses (small coloured squares, Figure 3b). To further investigate the stability of these population estimates, the number of dwellings identified within each buffer zone was computed. While this approach overlooks the significant homeless population of the city, it does provide a stable record of permanent structures, mostly brick or concrete block buildings, and therefore the long-term exposed population can be calculated. Buffer distances, in 50 m increments up to 250 m, were created to determine how closely residential dwellings had encroached onto marginal land (defined as land unsuitable for residential use because of exposure to heavy dustfall or risk of mechanical failure of the tailings impoundment).
Results and discussion
Changes in urban development around Crown Gold Recoveries TSFs
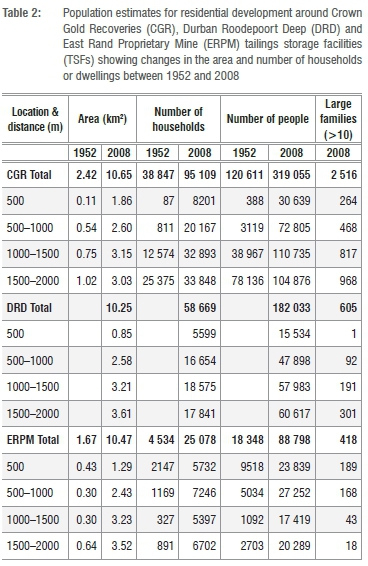
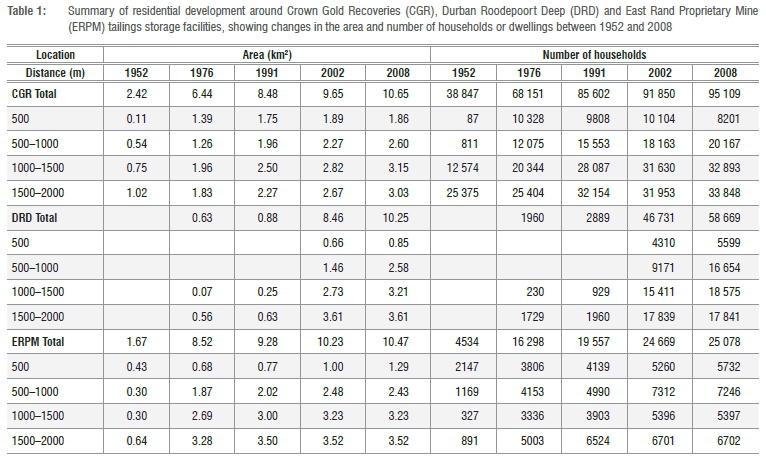
Changes in the number of households and the population within specific buffer distances (0-500 m, 500-1000 m, 1000-1500 m and 1500-2000 m) of each of the TSF complexes were derived from the changes in formal residential developments (fixed housing structures). Figure 4 illustrates the progression of developments around the Crown Gold Recoveries facilities. The most significant changes occurred between 1952 and 1976 - encompassing the rapid development of the Soweto dormitory city - and again between 1991 and 2002 - with urbanisation after the political transformation following the demise of the apartheid regime in 1994. Little undeveloped land remains around this location. The area of the TSF buffer zone occupied by residences has tripled, from 2.4 km2 in 1952 to 9.6 km2 in 2002 - detailed values of the change in area and number of households is shown in Table 1.
The latest available images from Google Earth indicate that, despite recent communication between official representatives, interested and affected parties and TSF site management's efforts to discourage or reduce the development of further housing projects on marginal land (land unsuitable for human settlement for environmental or geo-structural reasons), development in such areas has continued.
Changes in urban development around Durban Roodepoort Deep TSFs
In 1952, the area to be covered by the Durban Roodepoort Deep (DRD) tailings facility and surroundings was still undisturbed veldt. By 1976, the encroachment of residential development towards the boundaries of the TSF had begun. Development areas within TSF buffer zones remained minor through 1991 (Figure 5). Development accelerated after 1991, because of the scarcity of open land close to the city centre and the changing political climate. The Reconstruction and Development Plan of the new government post-1994 incorporated a policy of providing free houses (25-35 m2) to indigent citizens. These government-financed housing developments often encroached on the TSF buffer zones (brown area, Figure 5). Overall, residential development in this region has increased from zero in 1952 to 0.63 km2 in 1976 and 8.46 km2 in 2002.
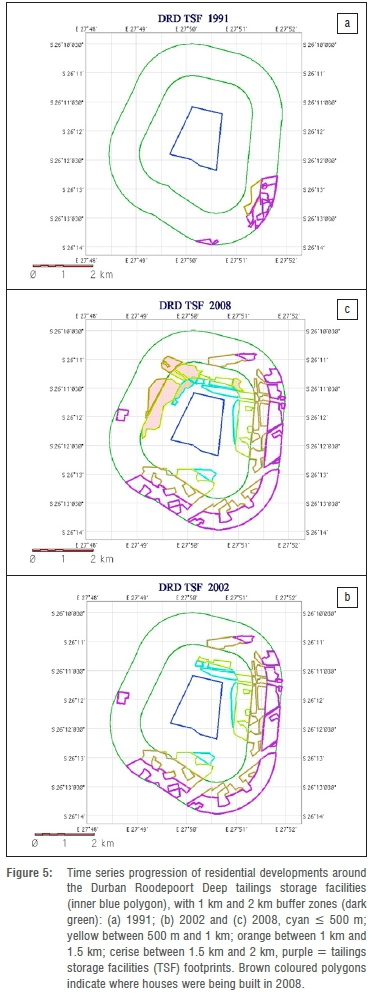
In contrast with the CGR TSF, there are indications that the 500 m buffer zone around the DRD TSF has been maintained (as can be seen along the eastern and southern margins of this TSF (Figure 5)). Detailed values of the change in area and number of households is shown in Table 1.
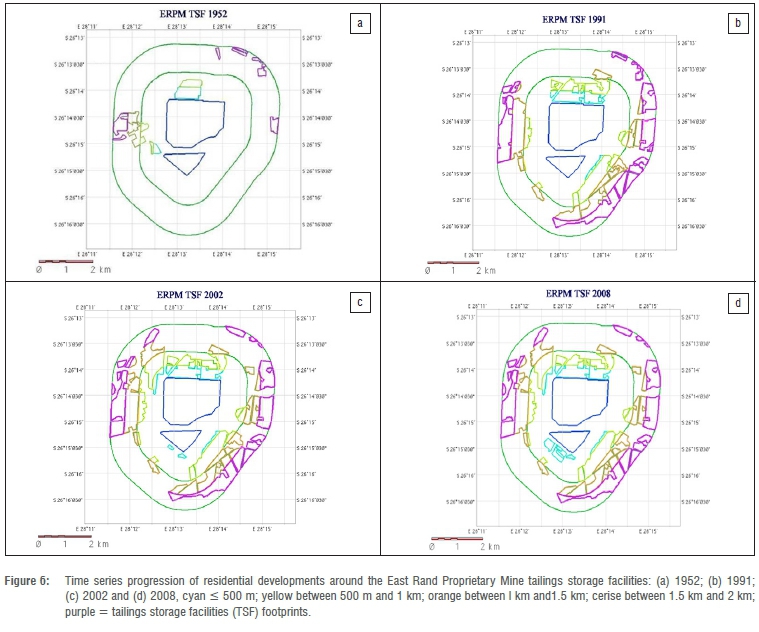
Changes in urban development around East Rand Properties TSFs
Around the East Rand Properties Mining (ERPM) TSF, even from the earliest images, there has been no buffer zone between the tailings facilities and the residential developments (Figure 6). In 1952 there was already 1.67 km2 of residential developments close to the ERPM TSF. The coloured forced resettlement area of Reiger Park, 0.43 km2 in extent, was situated closer than 500 m from the northern margin of the TSF. Suburbs to the south east, intended for habitation by whites, were located 0.5-1 km or more, distant from the TSF margins. The total residential area increased gradually and by 2002, had grown to 10.2 km2 of developments, with 1.1 km2 lying within 500 m of the TSF footprint. Later images from Google Earth (2012 Nov 29) do not indicate further residential developments occurring in the buffer zones defined around this TSF. Detailed values of the change in area and number of households are shown in Table 1.
Changes in population around TSFs since 2001
Table 1 summarises the change in residential development around the TSFs from 1952 to 2008. By 1952 there was already a small population living around the newly established CGR and ERPM tailings storage facilities: the principal increase in near-TSF residential population occurred after 1952.
Steady growth has been evident after 1976, with the DRD location lagging somewhat in time. Urbanisation and development of low-cost housing caused a boom in residential developments after 1994 and this is reflected in the increased population for 2002. While there is only a short time interval between 2002 and 2008, the images for 2008 are evidence that the housing boom has continued.
Based on the images, it is obvious that there was no (enforced) policy in place in Johannesburg to prevent human settlements close to these tailings facilities. Since these facilities were created, buffer zones around the TSFs, as prescribed under mining regulations, have not been enforced. After more than half a century of mining and mine tailings in the city, Johannesburg's residents were confident they could live in the shadow of the TSFs. Since 1952, for over 50 years, this has been true. While dust was a constant presence in these areas during spring (August, September and October), that dust was mainly coarse, settleable particles which were not inhaled and remained primarily a nuisance. Since 2002, finer milling and generation of inhalable dust have transformed this nuisance into a health hazard. This contributes to the current need to invest in dust suppression and the importance of educating the local population about not damaging or disturbing the dust mitigation measures (water sprays and vegetation on TSF surfaces).
Table 2 shows the population estimate calculations based on household size information from the Census 200122 data set. This Table also contains an additional column reporting the number of households comprised of more than 10 individuals, according to the Census 200122 reports. Earlier survey data collected within Johannesburg, on a small scale and with return times more frequent than the national census, indicate that household size has increased since the 1950s. As explained above, the earliest reliable household size data are Census 2001 22, which is the basis of the population calculations presented here. The large household concentrations for 2008 have been provided as a reference metric for the potential effect of smaller households for earlier years.
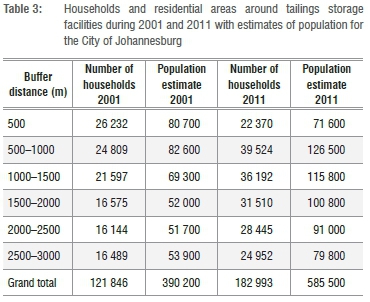
Comparing the 2001 and 2011 populations on a regional basis, focusing on the permanent structures, also shows continuous growth of the residential developments. With the underlying housing deficit in Johannesburg and the ongoing urbanisation of South Africa's population, this was not unexpected. Residential housing needs, especially those within easy travel distances from employment opportunities and infrastructure, will continue to motivate infill development of marginal lands within the urban boundary. Based on the population estimates in Table 3, there are already more residents in these marginal zones than could possibly be relocated and it is unlikely that any policy or health requirement will slow this growth for as long as open space continues to exist around any of the TSFs within the city limits. Pressure to find work opportunities (and housing within reasonable distance) will override health concerns related to quartz inhalation.
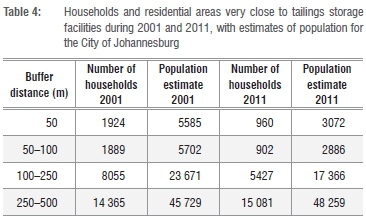
One potentially significant weakness of using the population density to calculate the exposed households is the sliver effect that small polygons add to the population calculation. This can occur when a narrow strip of land along the buffer edge is classified as residential but does not contain any actual houses. To quantify this effect, smaller buffer zones within 500 m of the TSF boundary were evaluated (Table 4). Comparisons, made between the dwelling frame based data (2011) and population density data (2001) show that this effect is important at the 50 m and 100 m distances but by 500 m, the data sets are in closer agreement.
Further, it was found that household densities also vary, along with the property sizes, with implications for the population per unit area, thus indicating a strong link between socio-economic status and household sizes. Over time, there has been a substantial growth in residential areas around the tailings storage facilities. This ongoing growth has created tension between the need for affordable housing within existing urban zones, and the protection of public health. While there are currently a large number of homes within 2-3 km of these tailings storage facilities, there is still a considerable proportion of open land under continuing development. Quantifying the population currently (and potentially) living in these regions highlights the vital nature of research into the health hazard potential.
Conclusion
The research detailed above indicates that continued human encroachment onto marginal lands poses a growing risk of human health consequences (because of the surge in residential dwellings near TSFs). Increasing hazard from inhalable dust around TSFs sites8 requires continued monitoring, quantification and mitigation efforts.
The growth of residential housing developments on marginal land near tailings storage facilities has been appraised over a 50-year period, using historical aerial photographic images and contemporary satellite retrievals. The spatial evolution associated with the residential housing and the number of households, coupled with the population dynamics over time, has been analysed.
Residential units within a 2 km radius of the three researched TSFs: Crown Gold Recoveries complex, Durban Roodepoort Deep and East Rand Proprietary Mine now number 163 250, 46 731 and 24 669 households respectively (Table 3). The combined human population within a radius of 2 km, exposed to airborne dust from the TSFs, grew from 138 959 in 1952 to 585 600 in 2011. The implication of so many residents downwind of what is now potentially an important health risk pollutant source, justifies ongoing monitoring efforts, resource allocation for dust control measures (including water resources even in times of drought) and education programmes about the causes, prevention and treatment of silicosis.
A steady growth in housing developments edging closer towards the various tailings storage facilities has been confirmed by analysis of aerial and satellite images in conjunction with census data,22,23 indicating the combined number of households within TSF buffer zones has increased from 43 381 in 1952 to 163 250 in 2004 (Table 3). The area covered by residential housing development has increased approximately 700% since 1952 at a rate of 14% per year. These changes have led directly to increased human exposure to increasingly hazardous inhalable dust from the TSFs. Ideally, no further development of residential areas should be permitted within a certain perimeter - i.e. within a distance of less than 2 km from the edge of the TSFs. Similarly, relocation of the current residential population would be desirable, but is unlikely to be feasible within the economic and political landscape. Socio-economic pressure, fostered by the need for low-income homes close to work opportunities, will continually cause pressure for further residential development. Hence, increased emphasis on preventing wind erosion of TSF is likely to be the most cost-effective solution to this increasing hazard -which currently affects half a million residents of South Africa.
Acknowledgements
Funding for this work was provided by Focus Area Grant No. FA2005040600018 from the South African National Research Foundation to H.J. Annegarn, and by the University of Johannesburg. We thank the Chief Directorate of Survey and Mapping in Cape Town, South Africa for providing the aerial photographic images and Statistics South Africa for the census data.
Authors' contributions
H.J.A. was the project leader, M.E.O. performed the image processing and M.A.K. performed the calculations and spatial analysis.
References
1. Parnell S. Building developmental local government to fight poverty: Institutional change in the city of Johannesburg. Int Dev Plann Rev. 2004;26(4):377-399. http://dx.doi.org/10.3828/idpr.26.4.3 [ Links ]
2. Parnell S, Robinson J. Development and urban policy: Johannesburg's city development strategy. Urban Stud. 2006;43(2):337-355. http://dx.doi.org/10.1080/00420980500406710 [ Links ]
3. Parnell S, Walawege R. Sub-Saharan African urbanisation and global environmental change. Global Environ Change. 2011;21(Suppl.1):S12-S20. http://dx.doi.org/10.1016/j.gloenvcha.2011.09.014 [ Links ]
4. Schäffler A, Swilling M. Valuing green infrastructure in an urban environment under pressure - The Johannesburg case. Ecol Econ. 2013;86:246-257. http://dx.doi.org/10.1016/j.ecolecon.2012.05.008 [ Links ]
5. Population Reference Bureau. World population data sheet. Washington, DC: Population Reference Bureau; 2007. [ Links ]
6. Annegarn HJ, Surridge AD, Hlapolosa HSP Swanepoel DJDV Horne AR. Review of 10 years of environmental dust monitoring at Crown Mines. J Mine Vent Soc S Afr. 1991;44(3):46. [ Links ]
7. Blight GE, Caldwell JA. Abatement of pollution from abandoned gold residue dams. J S Afr Inst Min Metall. 1984;84(1):1-9. [ Links ]
8. Ojelede ME, Annegarn HJ, Kneen MA. Evaluation of aeolian emissions from gold mine tailings on the Witwatersrand. Aeolian Res. 2012;3(4):477-486. http://dx.doi.org/10.1016/j.aeolia.2011.03.010 [ Links ]
9. JJ Martins. A critical evaluation of the challenges facing dust management within gold mining regions of South Africa [MSc thesis]. Potchefstroom: North-West University; 2014. [ Links ]
10. Oguntoke O, Ojelede ME, Annegarn HJ. Frequency of mine dust episodes and the influence of meteorological parameters on the Witwatersrand area, South Africa. Int J Atmos Sci. 2013;3(4):602-611. http://dx.doi.org/10.1155/2013/128463 [ Links ]
11. Williams DA, Jones H. Tailings storage facilities. Developments in Mineral Processing 2005;15:729-751. http://dx.doi.org/10.1016/S0167-4528(05)15030-3 [ Links ]
12. Anglogold Ashanti. Anglogold Ashanti environmental report, Woodlands Project - Good Progress being made with Phytoremediation Project. Johannesburg: Anglogold Ashanti; 2004 [ Links ]
13. Annegarn HJ, Zucchiatti A, Sellschop JPF Booth-Jones P PIXE characterization of airborne dust in the mining environment. Nucl Instrum Meth B. 1987;22(1-3):325- 330. http://dx.doi.org/10.1016/0168-583X(87)90351-X [ Links ]
14. Hnizdo E, Murray J, Sluis-Cremer GK, Thomas RG. Correlation between radiological and pathological diagnosis of silicosis: An autopsy population based study. Am J Ind Med. 1993;24(4):427-445. http://dx.doi.org/10.1002/ajim.4700240408 [ Links ]
15. Hnizdo E. Risk of silicosis in relation to fraction of respirable quartz. Am J Ind Med. 1994;25(5):771-772. http://dx.doi.org/10.1002/ajim.4700250517 [ Links ]
16. Donaldson K, Borm PJA. The quartz hazard: A variable entity. Ann Occup Hyg. 1998;42(5):287-294. http://dx.doi.org/10.1093/annhyg/42.5.287 [ Links ]
17. Belle B, Phillips HR. Influence of section return dust levels as an exposure indicator and assessment parameter of engineering control in coal mines. J Mine Vent Soc S Afr. 2009;62(4):6-9. [ Links ]
18. Belle BK, Du Plessis J. Recent advances in dust control technology on South African underground coal mines. J Mine Vent Soc S Afr. 2002;55(4):138-144. [ Links ]
19. Belle BK. Comparison of three side-by-side real-time dust monitors in a duct using average and peak display dust levels as parameters of performance evaluation. J Mine Vent Soc S Afr. 2010;63(1):10-17. [ Links ]
20. Gibbs GW, Du Toit RSJ. Estimating the quartz exposure of South African gold miners. Ann Occup Hyg. 2002;46(7):597-607. http://dx.doi.org/10.1093/annhyg/mef084 [ Links ]
21. Chief Directorate of Survey and Mapping/National Geo-spatial Information. Aerial Photography (1926-2008). Cape Town: Department of Rural Development and Land Reform; no date. [ Links ]
22. Statistics South Africa. Census 2001. Pretoria: Stats SA; 2003 [ Links ]
23. Statistics South Africa. Census 2011. Pretoria: Stats SA; 2011 [ Links ]
24. Liebenberg-Enslin H. A functional dependence analysis of wind erosion modelling system parameters to determine a practical approach for wind erosion assessments [PhD thesis]. Johannesburg: University of Johannesburg; 2014. [ Links ]
 Correspondence:
Melanie Kneen
Department of Geology and Environmental Science
Spring Creek Campus 2800 E.
Spring Creek Parkway Plano, TX 75074
United States of America
Email: Melanie.kneen@gmail.com
Received: 04 June 2014
Revised: 19 Nov. 2014
Accepted: 25 Apr. 2015

