


Services on Demand
Article
 English (pdf)
 Article in xml format
 Article references
Indicators

Related links
-
 Cited by Google
 -
 Similars in Google
Share

 Permalink
South African Journal of Science
On-line version ISSN 1996-7489
Print version ISSN 0038-2353
S. Afr. j. sci. vol.111 n.11-12 Pretoria Nov./Dec. 2015
http://dx.doi.org/10.17159/sajs.2015/20140380
RESEARCH ARTICLE
Keurbooms Estuary floods and sedimentation
Eckart H. Schumann
Department of Geosciences, Nelson Mandela Metropolitan University, Port Elizabeth, South Africa
ABSTRACT
The Keurbooms Estuary at Plettenberg Bay lies on a wave-dominated, microtidal coast. It has a dune-topped sandy barrier, or barrier dune, almost 4 km long, with a narrow back-barrier lagoon connected to its source rivers, the Keurbooms and Bitou. The estuary exits to the sea through this barrier dune, and it is the geomorphology and mouth position in relation to floods, which is the subject of this paper. Measurements of rainfall, water level, waves and high- and low-tide water lines were used to analyse the mouth variability over the years 2006-2012. Two major floods occurred during this time, with the first in November 2007 eroding away more than 500 000 m3 of sediment. The new mouth was established at the Lookout Rocks limit - the first time since 1915. The second flood occurred in July 2012 and opened up a new mouth about 1 km to the north-east; high waves also affected the position of the breach. The mouth has a tendency to migrate southwards against the longshore drift, but at any stage this movement can be augmented or reversed. The effectiveness of floods in breaching a new mouth through the barrier dune depends on the flood size and the nature of the exit channel in the back-barrier lagoon. Other factors such as ocean waves, sea level, vegetative state of the dune and duration of the flood are also important and can determine where the breach occurs, and if the new mouth will dominate the old mouth.
Keywords: estuary morphology; mbarrier dune; mouth migration; river floods; ocean waves
Introduction
The Keurbooms Estuary is situated in Plettenberg Bay on the wave-dominated, microtidal south coast of South Africa. The southern boundary of the estuary is formed by the Lookout Rocks of the Cape Supergroup, while the study area consists of the Holocene tide-dominated sedimentary deposits extending to the bridge where the N2 national road crosses the estuary. The situation is depicted in Figure 1.
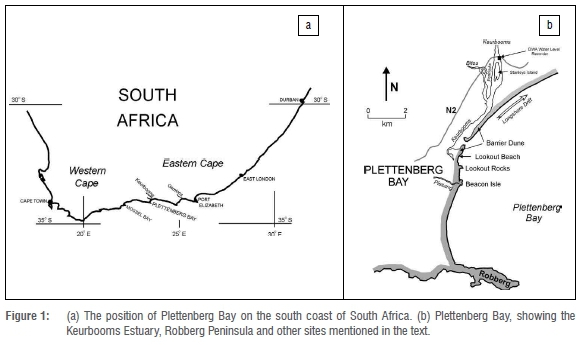
The estuary is formed by the confluence of two rivers, namely the Keurbooms River itself, and its tributary the Bitou River. The two estuaries combine to form a narrow back-barrier lagoon behind a dune-topped sandy barrier which extends almost 4 km - here termed a barrier dune. The tidal inlet or mouth is not anchored in any substrate resistant to erosion, and it exits through this barrier dune. It is the variations in the mouth position in response to floods and ocean forcing which form the primary subject of this paper.
Historical records show the mouth situated at various positions along the barrier dune. Storrar1 shows maps drawn by JC Frederici in 1789 and Lieutenant W McPherson Rice in 1797 which both depict the mouth positioned approximately in the middle of the barrier dune.
A later map of the region drawn by the Royal Navy Hydrographic Office in 1867 shows the mouth situated at the Lookout Rocks. A divisional map of Knysna dated 1890 confirms this position, while the Colonial Surveyor-General in 1900 depicted the mouth nearly 1 km north of the Lookout Rocks.
Reddering2 reports that up to 1915, the mouth was at the Lookout Rocks, though it is not clear when it changed from the position depicted in 1900. In 1915, a severe flood breached the barrier dune at its northern end; this new mouth was big enough to dominate the previously-existing southern mouth which subsequently closed.
Aerial photographs became available in the 1930s and were used to trace further developments. In particular, those taken by the Chief Directorate: Surveys and Mapping (Trig Survey) provide a sequence, though not at regular intervals. The first of these aerial photographs dates from 1936 and is shown in Figure 2.
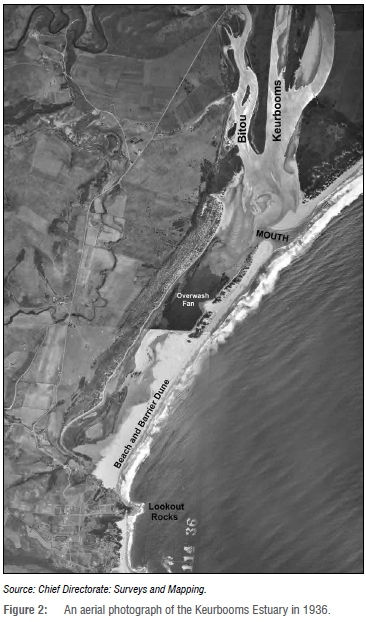
At the time, the mouth was still situated at the northern end of the barrier dune, while a complex system of sandbanks is evident on the estuary side. The barrier dune extending southwards had a sparse collection of vegetation, while a prominent overwash fan is indicated. Farther south, the wide beach/barrier dune seems void of vegetation, with marine sediments extending some distance into the back-barrier lagoon. On the western side there appears to be a number of channels with zostera-covered sandbars.
Fromme3 analysed the mouth migrations using a set of 14 aerial photographs over a period of 44 years. The first two photographs from 1936 (Figure 2) and 1942 show the mouth still in the northerly position, while all the other 12 photographs located it in the centre of the barrier dune, some 2 km north of the Lookout Rocks. The mouth position over the 19 years from 1961 to 1980 varied over a distance of around 500 m.
Reddering2,4 and Duvenhage and Morant5 concluded that there was a general migration of the mouth southwards to the Lookout Rocks. It was furthermore proposed that the position of the Keurbooms Estuary mouth goes through long-term cycles, starting with a breach of the barrier dune in the north.2,4,5 It then slowly migrates south-westward to the Lookout Rocks, with temporary reversals of this migration caused by the wave climate. The cycle repeats when a major flood breaches the barrier dune in the north again. Nonetheless, in the available historical record of over 200 years, it was only in 1915 that the mouth was situated in the extreme north.
More recently, the barrier dune was vegetated from the Lookout Rocks side. It appeared as if this vegetation would inhibit further erosion of the barrier dune3, though in 2003, Illenberger6 concluded that the mouth would reach the Lookout Rocks in 6-12 years.
In August 2006, a large flood removed about 200 m of the remaining barrier dune, in the process destroying a toilet/shower building. A year later, in November 2007, a massive flood removed what was left of the barrier dune, and a new mouth of the Keurbooms Estuary was formed adjacent to the Lookout Rocks. Some infrastructure, including two toilets and change-room facilities were destroyed, with rocks on the southern boundary of the estuary preventing further damage.
In July 2012, another flood breached the low barrier dune about 1 km north of the Lookout Rocks. The estuary continued to function with two mouths, but gradually the mouth at the Lookout Rocks silted up and in 2014, the estuary had only one mouth.
This paper details the changes in the geomorphology of the estuary mouth region over the last two floods from 2006 to 2012. It is proposed that the manner in which the estuary develops is dependent on a number of physical processes, and that the changes that are caused by, for instance a flood, depend on the developmental stage of the estuary at that time.
Keurbooms estuary dynamics
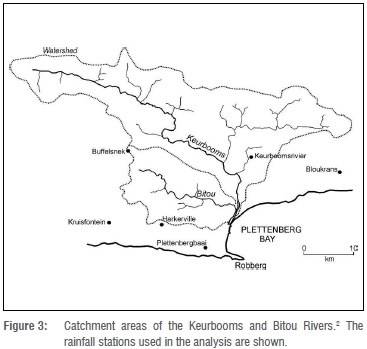
The catchments of the Keurbooms and Bitou Rivers are shown in Figure 3 and have areas of 859 km2 and 237 km2, respectively.2 The mean annual run-off of both catchments was estimated to lie in the range of 70 x 106 m3 to 160 x 106 m3 by Duvenhage and Morant.5 On the other hand, Fromme3 calculated a median discharge of 8.29 x 10⁶ m3 per month over a period of 56 years. These values correspond to an average inflow between 2.2 m3/s and 5 m3/s, although these values include occasional floods, which means that the daily flow from the two rivers is probably considerably less.
Reddering2 calculated the tidal prism, or volume of water entering and exiting the estuary over a tidal cycle, to be 1.8 x 10⁶ m3. This tidal prism is relatively large and is probably the reason why the Keurbooms has a permanently open inlet.7,8
A fresh water inflow of 5 m3/s amounts to about 6% of the tidal prism volume over half a tidal cycle, though this volume will vary from spring to neap tide. These values indicate that it is probable that freshwater plays little part in the estuarine dynamics of the back-barrier lagoon, apart from the flood events.
Waves approaching a coastline at an angle will move available sediment along the coast in a longshore drift dependent on the wave height, the beach slope and the angle at which the waves approach the beach.9 With the dominant wave direction from the south/southwest10 it means that the average longshore sand transport along the South African south coast is predominantly towards the west.
Potential sand transport calculations made for the Cape Recife/Algoa Bay area to the east found total transport volumes varied from around 100 000 m3/annum to 400 000 m3/annum11, while in the Mossel Bay region to the west, values between 320 000 m3/annum and 500 000 m3/ annum were determined12. The actual alongshore sediment transport rate is dependent on the availability of sand, but it can be expected that similar volumes will occur here.
Martin and Flemming12 report the presence of a massive spit of unconsolidated sediment extending out from the end of the Robberg peninsula (Figure 1b). While this spit may indicate a deposition zone, longer period swell will move sediment in deep water past such capes,13 so that Robberg should not be seen as a barrier to longshore sediment transport. Martin and Flemming12 also found extensive deposits of Holocene sediments across Plettenberg Bay.
Plettenberg Bay conforms to a log-spiral or half-heart bay shape, with a resistant headland - the Robberg Peninsula - and a gently curving bay behind it. Wave energy can be expected to increase progressing around the bay away from the protection of Robberg until at the farther end where it is open to the Southern Ocean. The shape and characteristics of the beaches can also be expected to reflect these changes and Flemming14 reports fine sand in the shelter of such a headland and coarser sand in the more exposed areas. This distribution conforms to the sand distribution found by Fromme3. The longshore drift of sand is therefore in a north/northeasterly direction in Plettenberg Bay.
As discussed, the migration of the Keurbooms Estuary mouth appears to be in a southward direction, i.e. counter to the longshore drift. This migration is a comparatively rare situation4, with the tidal passing of the sand being over-efficient9.
The manner in which sand progresses past the Keurbooms Estuary mouth has been discussed by Reddering4, while Fitzgerald et al.15 describe nine different bypassing models, although these are more specific to ebb-tidal systems. The processes occurring in the mouth are complex, with separate flood and ebb channels being formed, flood and ebb tidal deltas developing and being shaped by wave action, while at the same time the longshore drift continuously adds to a longshore drift delta extending northwards from the southern side of the mouth.
It is apparent in all these scenarios that the final movement of sand across the mouth of the estuary occurs as an event, where breaching occurs of a spit or of the longshore drift delta, allowing the ebb channel in particular a more direct route to the sea. The cut-off section of the longshore drift delta is left on the northern side of the mouth and melds onto the ebb-tidal delta, with the sand continuing onwards in the longshore drift.
High waves are also important in their direct effect on the estuary, causing a wave set up of the background sea level.16 Over periods of days, coastal trapped waves can affect sea level by more than 0.5 m,17 while the peak of a spring tide will add to background sea level. Zhang et al.18 documented such an event where the sea level in the Gamtoos Estuary was increased by about 1.15 m, resulting in large scale inundation.
High waves and elevated sea level conditions can result in overwash of the barrier dune, where waves are large enough to go right over the dune and into the back-barrier lagoon beyond. These waves can erode a channel through the aeolian dune ridge and spill the sand into the lagoon in the form of a lobate washover fan. Reddering2 estimated that between 1915 and 1942, a total of 325 000 m3 of sand entered the southern part of the back barrier lagoon by barrier overwash.
Almost all South African estuaries have a subtidal sandy barrier that extends across the seaward section of the mouth.8 This barrier is a wave-built sand ridge, distorting the tidal signal that enters the estuary. In particular, the tidal amplitude within the estuary is decreased relative to the adjacent ocean, and in most estuaries, there is also a tidal lag as well as an asymmetric tidal signal, with a shorter flood tide and a longer ebb tide. To enable the same volume of water to flow out on the ebb as flowed in on the flood means that ebb currents are generally slower than flood currents.19
Sand is moved in and out of the estuary by these currents. Bedload transport is roughly proportional to the cube of the shear velocity, and it means that small increases in current speed lead to marked increases in sediment transport.20 With increasing shear, the sand starts bouncing, or saltating, along the bed, finally being put into suspension and carried in the body of the fluid.
The tidal asymmetry means that more sand is carried into the estuary on the flood tide than is taken out again on the subsequent ebb tide. This sediment transport is enhanced by waves, and it means that there is a net ingress of sand into the estuary. Moreover, current speeds increase in the narrow mouth, and once clear, the speeds decrease again and sediment in suspension settles. The settling velocity is dependent on the sand grain size, and flow which is slowing down will carry finer grains further: This process leads to a natural sorting where finer sands are found higher up in estuaries and such sand forms complex flood tidal deltas within the estuary. Correspondingly, ebb currents also speed up in the narrow mouth and then deposit their sediments when they slow down after exiting into the adjacent sea. In a high wave energy environment such ebb-tidal deltas are poorly developed.21
Data
The aim of the analysis is to investigate changes in the geomorphology of the Keurbooms Estuary, in particular during flood events. For this, rainfall data as well as water levels in the sea and estuary, wave heights in the ocean and estuarine morphology are available. Details are given below.
Rainfall and floods
Rainfall data from various stations surrounding the Keurbooms and Bitou rivers were obtained from the South African Weather Services (SAWS) for the period 1990-2013. Daily rainfall was measured at 08:00, although at all stations there were days when no measurements were taken.
Stations were selected on the basis of being relevant to the two river catchments, i.e. they needed to be close enough, and positioned on the southern side of the Tsitsikamma Mountain range. On this basis, the six stations shown in Figure 3 were selected to represent rainfall in the catchments. Mean values for every day over all six stations were calculated, the advantage being that missing values from any one station would not impact too greatly on the final value.
Water levels and waves
Sea level is measured by the South African Naval Hydrographer at Mossel Bay (Figure 1a) relative to Chart Datum, now defined as the Lowest Astronomical Tide. Land Levelling Datum is often referred to as mean sea level (msl) by surveyors, and for this analysis a value of 0.933 m was subtracted from the measured values to obtain mean sea level.
The site of the Department of Water Affairs (DWA) water level recorder is at the N2 bridge over the Keurbooms Estuary (Figure 1b). Hourly values are given in metres, although the actual values have not been adjusted to chart datum. Lack of adjustment means there was no opportunity to make a direct comparison with the sea level measurements.
It proved difficult to obtain detailed wave data for use in this analysis. As such, wave estimates from voluntary observing ships (VOS) data were obtained from the South African Data Centre for Oceanography (SADCO). The observers on such ships can be assumed to estimate the significant wave height, and thus their reports can be taken to represent waves and swell in the representative areas; only swell height is considered, with no consideration of wave direction.
The area from which VOS wave data was used extends from 34°S to 36°S, and 22°E to 25°E. It was found that the distribution of data varied considerably, and a number of days did not have any data at all. Nonetheless, only the relative changes in wave heights were used here, and when there was data, significant changes in wave height could be ascertained.
Global Positioning System surveys and imagery
Global Positioning System (GPS) surveys were carried out when possible and represent a rough measure of the morphology of the Keurbooms Estuary at that time. They were executed by running/walking along the water's edge on the beaches and in the estuaries while marking out the route with a GPS; waypoints were taken at suitable locations. In general, the distances covered along the water's edge varied between about 3 km and 10 km, and could be completed in about 1-1.5 h. Both the low tide and high tide surveys were started on the ocean side of the estuary at about the predicted low and high water times. With the known lag of 1-2 h in the estuary,2 it meant that the surveys in the estuary were finished during the corresponding estuarine low and high water levels.
Where possible, the surveys were done at low and high tides, and more specifically at spring low and high tides. These two surveys could then give some indication of the intertidal sediment distribution.
There is a certain amount of subjectivity involved in this process, particularly on the beach face, because the waves present at the time would have influenced the assessment of what constitutes the water's edge. Nonetheless, the technique gives a good representation of the estuary's sedimentary morphology, primarily because the changes recorded have been massive and small deviations do not affect the conclusions in any substantial manner.
The surveys up to and including July 2009 were undertaken using a Garmin 12 GPS (Garmin International, Kansas City, KS, USA). This instrument did not record positions continuously, and waypoints had to be taken at selected positions. From December 2009, a Garmin 60CSx GPS was (Garmin International) used, and was set to record positions every 3 s on the way around the water's edge, while some additional waypoints were still taken.
It proved difficult at times to include surveys on the northern side of the barrier dune as this involved getting across the mouth. At times, when high tide surveys could not be completed, estimates were made of the high water positions from the location of wrack and small scarps on the beach.
The accuracy of the GPS instruments is given as better than 10 m. Fixed reference points (shower, pumphouse, rock) were marked as waypoints for each of the surveys, and all GPS measurements on that day were then referred to this position. Conversion scales for latitude and longitude were obtained from 1:50 000 South African Naval Hydrographer (SAN) charts and programs were written to plot the results onto scale maps of 1 cm:100 m. These were transferred into Coreldraw, where the various features could be depicted. Google Earth maps on the same scale were used to include all the adjacent features such as roads, buildings and bush, while Google Earth images taken on 07 August 2005, 10 November 2010, 20 August 2011 and 30 August 2013 were also used to add to the survey results.
Results
Daily rainfall over the years 2006-2012 is shown in Figure 4. Intense rainfall events of more than 100 mm over 3 or 4 days are circled. Figure 5 shows the corresponding water levels at the N2 gauge in the Keurbooms Estuary. A standard symmetrical cosine-Lanczos filter with 97 weights and a quarter power point at 0.035 cph was used to filter these measurements, thereby effectively eliminating periods shorter than about 30 h, and in particular removing the tidal signals.
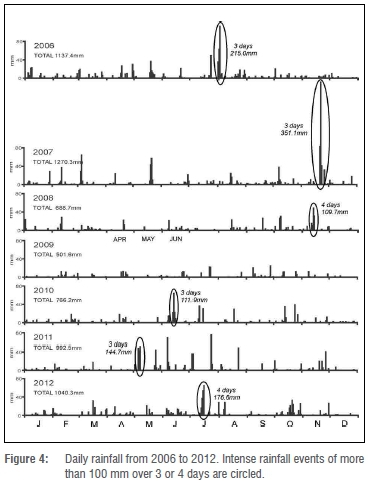
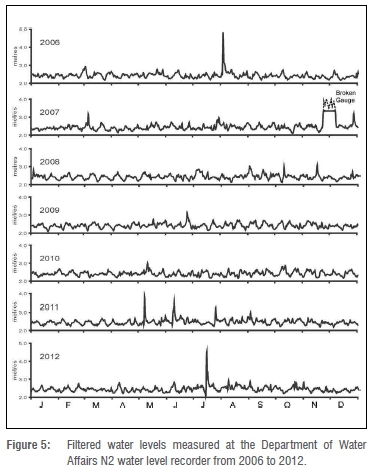
The correspondence between the intense rainfall events and the elevated water levels in the Keurbooms Estuary are clearly evident. In particular, the floods of 2006, 2007 and 2012 appear prominently, with the major flood of 2007 actually breaking the recording gauge. Nonetheless, there are a number of smaller events which stand out as potentially significant.
The flood of 2007
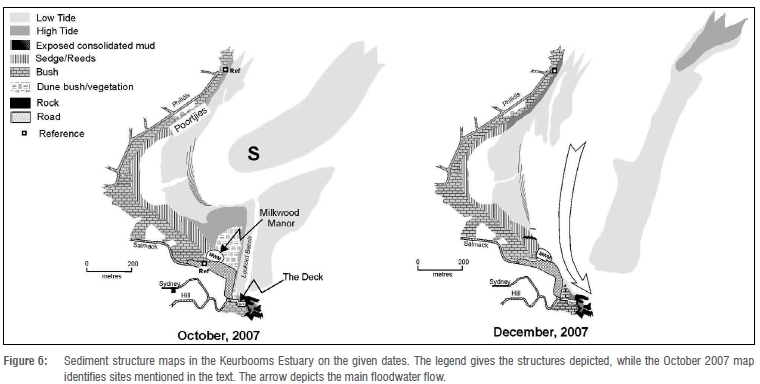
As indicated, the flood of August 2006, took away about 200 m of the barrier dune at the back of Lookout Beach, including dense bush and dune vegetation. After this flood, the normal estuarine sedimentary processes continued, and the general geomorphology for October 2007 is depicted in Figure 6. This figure also shows the positions of various sites mentioned in the text.
Flows at a corner have slower currents on the inner boundary leading to deposition of sediment, while maximum currents on the outer boundary lead to erosion and possible scour holes.22 The spit S formed such an inner boundary for both the flood tidal flow turning north-eastwards and the ebb tidal flow turning to exit through the mouth, and consequently accreted, extending south-westwards. Wave accretion also took place at the inlet beach face, because accretion is the only process that deposits sand above the water level4.
On the other hand, the outer boundary eroded very slowly, as it consisted of consolidated fluviogenic mud and sand that had been subjected to extensive bioturbation. This outer boundary would have originated from the depositions over the years, from when the barrier dune was breached in the northeast in about 1915.2
At the mouth of the estuary, the longshore drift had formed an extensive longshore drift delta, with a low tide runnel in front of Lookout beach. This meant that a very convoluted channel served as the exit to the sea, particularly at the end of the ebb tide outflow.
The flood waters in November 2007, were too great to be constrained by the narrow, convoluted ebb channel and flowed directly out to sea, in the process removing the last bit of the barrier dune forming Lookout Beach. The Cape Supergroup rocks at the southwestern boundary of the estuary were exposed and were the primary reason that the estuary could not erode this bank any further.
Cooper23 found that in such tide-dominated estuaries, floods typically erode accumulated sediment and deposit some of it as an ephemeral delta. This is what happened here, and Figure 6 shows that in December a new subtidal barrier dune had formed with its tip some 400-500 m seawards of the previous position.
The area of sand forming the Lookout barrier dune and longshore drift delta was some 15.3 ha. In places amongst the dune vegetation, the dune was more than 6 m high, so the volume of sand removed in the flood was probably in excess of 500 000 m3. This sand excludes any of the sand which formed the spit S, as some of that would have been washed out to form the new subtidal barrier dune.
Estuary development up to October 2011
After the massive flood in November 2007, Figure 7 shows the changes over the next 4 years. It is expected in such tide-dominated estuaries that reworking of the barrier dune by wave action should move it back more or less to its previous orientation within a relatively short period,23 and this movement is evident by July 2008. It had also accumulated subaerial sand.
The owner of Milkwood Manor surrounded the guesthouse/restaurant with a structure of rocks, limiting further damage. However, the beach section to The Deck and the base of the Lookout Rocks was no longer protected from ocean waves and suffered severe erosion. In particular, a large part of the car park was removed and the toilet/shower facilities collapsed into the sea.
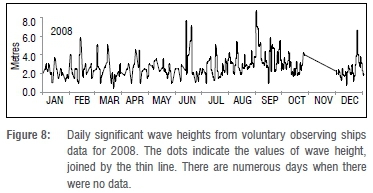
By December 2008, the ebb flow had continued eroding the consolidated muddy western boundary, while much of the shallow sandbank in front of Poortjies had been removed. Of particular interest are the changes to the barrier dune in that a new channel had developed about 200 m to the northeast of the main mouth channel. Moreover, the section of barrier dune shown was submerged at high tide, and even though the water levels at the time of measurement were some 200 mm higher than in July, the indications are that additional erosion had occurred; there were also several washover points further north.
Inspection of rainfall records in Figure 4 shows that a total of 109.7 mm of rain fell over the 4 days 11-14 November 2008, but there was only a small corresponding peak in the DWA water level record in Figure 5. Similarly, the 59 mm of rain that fell on 7 and 8 October also only caused a minor increase in water level.
The reasons for the changes can then probably be found in Figure 8. The VOS data showed that very high wave conditions occurred around 1 September, with wave heights greater than 8 m. At the time there was also considerable damage reported from other coastal areas along the south coast. Such storm waves would have eroded the barrier dune, with extensive washover areas occurring. One such washover was probably sufficiently large to form a channel, and once formed, water would have selectively exited along this channel. Moreover, the waves penetrating over the barrier dune would have been responsible for the erosion of the sand delta at Poortjies.
In July 2009, both the new secondary mouth and the Lookout Rocks mouth were operating, although the latter was substantially deeper. Note that the high tide survey did not extend to the barrier dune, although there was a small area exposed on the separate island, and the north-eastern barrier dune was also exposed some distance south-westward.
The input of sediment into the system was very apparent at the Lookout Rocks mouth, and a beach had built up between The Deck and Milkwood Manor, even at high tide. At Milkwood Manor, the sand at low tide extended well away from the protective ring of rocks. An ebb-tidal/ longshore drift delta was evident to the east of the mouth.
By December 2009, some closing up of the secondary mouth had occurred, but substantial flows were still using this channel. Moreover, erosion of the west bank of the estuary had continued, with the low tide backwater also reduced in area. Erosion of the sandbanks to the north of The Deck had again occurred, and there was no beach available at high tide.
A low tide survey a year later in December 2010 (not shown here) confirmed that the secondary mouth had closed up and it is not evident at all in July 2011. Substantial changes had occurred in the flow patterns, with a large low tide sandbank extending out from the western bank at the toilet/changeroom reference point. As happened after the 2006 flood, the barrier dune had extended westward at its southern end as a result of being on the inner boundary of the flow, while more erosion had occurred at the western bank in the vicinity of the remnant backwater. This erosion led to increasingly convoluted flows. Extensive overwash fans were evident on the barrier dune, while clumps of dune bush had also become established in the north-east. Dune pioneers were also evident over much of the rest of the barrier dune exposed at high tide.
It should be noted that there were several minor floods in 2011 (Figure 5), which caused an appreciable increase in the water level at the N2 bridge - up to 1.5 m. However, it is apparent that the convoluted exit channel could cope with the additional flow, and there were no significant changes in the estuary's morphology.
The processes continued until October 2011. The sandbank extending from the toilet/changeroom reference on the western bank maintained its position, while the sandbank on the eastern side of the mouth channel continued accreting. However, of concern was the erosion of the western bank occurring in the Poortjies area, where even at low tide, in some places there was no beach in front of the bushes. Slow erosion continued on the western bank, but with the consolidated mud and vegetation resisting the continual flow.
The flood of July 2012
The next appreciable flood to cause major changes in the Keurbooms Estuary occurred over the four days 12-15 July 2012, when 176.6 mm of rain was recorded (Figure 4). The amount of rain is not much more than the 144.7 mm which fell over 6-8 May 2011; however, the water level at the N2 bridge increased by about 2.5 m, and this rise had a markedly different effect on the estuary.
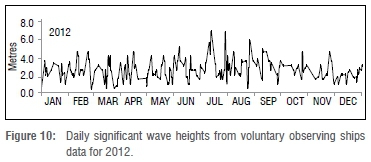
The rainfall, sea level at Mossel Bay, as well as the water level at the N2 gauge are depicted in Figure 9, starting on 12 July and ending eight days later when conditions had returned to normal. In addition, Figure 10 shows that high wave conditions were experienced at the time, with peak wave heights close to 8 m being reported. Inspection of Figure 7 shows that in July and October 2011, overwash points were observed on the barrier dune south of the more heavily vegetated section. These points were evident, both from a lowered dune profile where waves had penetrated over the dune, and the washover fans where sand had subsequently been deposited in the estuary. These points were particularly vulnerable to breaching by the floodwaters and Figure 9 shows that the water level in the estuary rose rapidly from about midday on 14 July in response to the continuing rain from 12 July onwards. Such a damming up of water behind the barrier dune would have been caused by the convoluted exit channel past Poortjies being too small and obstructive to accommodate the volume of water flowing into the estuary.

The neap tide on 12 July and the ebb tide early on 14 July allowed more water to flow out thereby checking the rising water levels for a short time. The following flood tide served to limit this outflow, and the water level in the estuary rose rapidly. The high waves at the time would also have caused a wave set up thereby further blocking up the water in the estuary.
The flood water level reached its maximum and then from about 5pm on 14 July there was a rapid decrease. The reason for this decrease can be seen in the photograph in Figure 11, taken just after the peak water level had been reached (Figure 9).
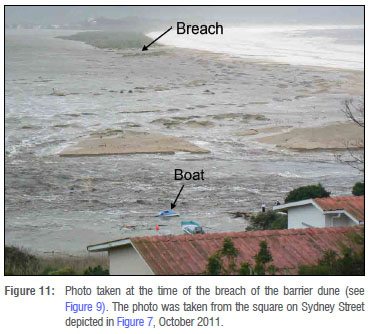
It is apparent that a combination of the high water levels in the estuary, as well as probable overwashing from the high sea waves caused a breach in the barrier dune at the position indicated. This was an old overwash position observed in both July and October.
At the same time, the mass of water going over the southern part of the barrier dune and flowing directly to a position just northwest of Milkwood Manor can be seen. Here the rocks deflected the water to the mouth. The floodwaters washed out numerous items from the estuary, included the boat shown in Figure 11.
Once the breach had been made, the dammed up waters started flowing out rapidly, leading to the abrupt drop in water levels. The new channel provided a much shorter and more direct exit to the sea and once started, would have been quickly scoured out further. Figure 9 shows that it was still raining hard at the time, and in fact, 15 July recorded a higher rainfall than 14 July. Nonetheless, the new channel could accommodate the additional flow and was being widened and deepened in the process. The water level continued falling, though the rate of decrease slowed down until late on 15 July when it had dropped some 2 m from its peak level. Then there was a slight increase again, possibly when floodwaters from another tributary reached the estuary, and thereafter the decrease in water level continued. It was only on 17 July that tidal fluctuations again reached the gauge, and on 19 July, the situation had returned to normal.
The surveys carried out on 17, 18 and 19 July are depicted in Figure 12 and show the new estuary configuration. The new mouth was situated about 1 km from the Lookout Rocks and was accommodating a substantial volume of the tidal exchanges. The remaining barrier dune was still intact, but was now an island between the two mouths. The sand delta extending from the reference point on the western bank of the estuary was still largely intact. Most of the floodwaters exited through the new mouth and thus did not pass and erode this delta.
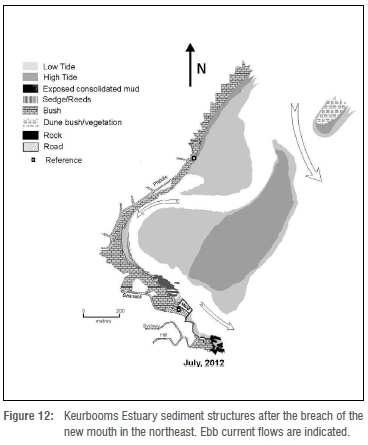
At this stage it was not clear which mouth would dominate. However, a survey in December 2012 revealed that substantial sandbanks had developed off the Lookout Rocks, extending across the old mouth. A survey in February 2013 showed that a low tide sandbank extended right across the mouth, and it was clear that this mouth would soon be closed completely. The closing happened by the time of a survey in July 2013.
Discussion and conclusion
This analysis followed the geomorphological changes in the Keurbooms Estuary over a period during which two substantial flood events occurred. The results confirm earlier conclusions4,5 on the sedimentation patterns in the estuary mouth area, in particular the substantial longshore drift and the development of flood-tidal and longshore drift deltas, and smaller ebb-tidal deltas. As already discussed, the southwards migration tendency of the mouth is effected when the longshore drift delta extends too far northwards and is then breached by the ebb-tidal flow to provide a more direct channel to the sea. The slug of sand at the end of the delta has then bypassed the mouth15 and continues northward, with wave swash coalescing it onto the beach face.
However, the long barrier dune as well as the associated narrow back-barrier lagoon give the Keurbooms Estuary unique characteristics, and the manner in which waves and floods impact on the estuarine morphology also depends on the back-barrier channels. Thus the development of a south-west trending spit on the northern barrier dune forces the main channel westwards and southwards, in the process eroding the estuary banks and causing a more convoluted exit channel. This development is clearly evident in the sequence shown in Figure 7.
The impact of a flood will depend on the volume of floodwaters, as well as the resistance to flow of the convoluted backwater channel. Figures 4 and 5 show that there were at least two reasonable floods in 2011 which caused the water levels at the N2 gauge to rise around 1.5 m, however, there appeared to be little impact on the estuary. The flood of July 2012 raised the N2 gauge water level by about 2.5 m, and the impact on the estuary was massive. As already described, this impact was probably because the back channels had become more convoluted and the flood waters breached the barrier dune to find a more direct route to the sea. The high waves and overwash fan assisted in finding a suitable point to breach the barrier dune.
The convoluted back-barrier channel was also evident before the 2007 flood, although the volume of floodwaters at that time ensured that a new direct exit channel would be formed. This channel encompassed an extensive area of the southern part of the estuary.
If a new mouth is breached through the barrier dune, there is no guarantee that it will become dominant: this depends to a large measure on the duration of flow after breaching. The volume of water which exits will determine how well the new mouth is scoured, and whether it will then allow an easier route than the old mouth for tidal flows after the floodwaters have abated.
It appears that extreme wave events, such as those of September 2008, can also cause breaching of the barrier dune. The channel evident in December 2008 (Figure 7) remained operative for more than a year before it was eventually closed when the northward extending longshore delta became too long.
The effect of increasing vegetation on the barrier dune will also determine whether a breach can occur. Such vegetation will trap increasing amounts of wind-blown sand, causing the dune to grow both vertically and horizontally, making it more of a barrier to breaching.
Considering all these factors, it is clear that no definite predictions can be made about the effect of a flood, or indeed if and where breaching will occur. The available historical record from 1789 appears to show that the mouth was situated in the middle or southern sections of its range for most of the time, and that the breach in the north in 1915 was an unusual occurrence. Nonetheless, there is a tendency for the mouth to migrate southwards, although at any stage, breaching of the barrier dune could again occur at any other position. It all depends on the conditions at the time.
Acknowledgements
The provision of relevant data by the following authorities is gratefully acknowledged: the South African Naval Hydrographer for sea level data at Mossel Bay; the Department of Water Affairs for water levels in the Keurbooms Estuary; the South African Weather Service for rainfall data; the South African Data Centre for Oceanography for voluntary observing ships data, and the Chief Directorate: Surveys and Mapping for the 1936 aerial photographs. The work formed part of the Department of Environment Affairs - Nelson Mandela Metropolitan University (NMMU) Memorandum of Understanding, and the support of both the DEA and NMMU is gratefully acknowledged. One referee is thanked for valuable insights to improve the paper.
References
1. Storrar P Portrait of Plettenberg Bay. Cape Town: Purnell; 1978. [ Links ]
2. Reddering JSV. The sedimentology of the Keurbooms Estuary [MSc dissertation]. Port Elizabeth: University of Port Elizabeth; 1981. [ Links ]
3. Fromme GAW. The dynamics of the Keurbooms-Bitou Estuary. CSIR Report T/SEA 8511. Stellenbosch: CSIR; 1985. [ Links ]
4. Reddering JSV. An inlet sequence produced by migration of a small microtidal inlet against longshore drift: The Keurbooms Inlet, South Africa. Sedimentology. 1983:30;201-218. http://dx.doi.org/10.1111/j.1365-3091.1983.tb00665.x [ Links ]
5. Duvenhage IR, Morant PD. Report no. 31: Keurbooms/Bitou System (CMS 19) and Piesang (CMS 18). In: Heydorn AEF, Grindley, JR, editors. Estuaries of the Cape. Part 2: Synopses of available information on individual systems. CSIR Research Report No. 430. Stellenbosch: CSIR; 1984 p. 64 [ Links ]
6. Illenberger WKI. Management of Keurbooms Estuary sediment dynamics. Report for the Plettenberg Bay Municipality. Plettenberg Bay: Illenberger and Associates; 2003. [ Links ]
7. Reddering JSV Schumann EH. Sedimentation: Causes and processes. In: Schumann EH, editor. Towards the management of marine sedimentation in South African estuaries with special reference to the Eastern Cape. WRC Report no.: 1109/1/03. Pretoria: Water Research Commission; 2003. [ Links ]
8. Cooper JAG. Geomorphological variability among microtidal estuaries from the wave-dominated South African coast. Geomorphology. 2001:40:99-122. http://dx.doi.org/10.1016/S0169-555X(01)00039-3 [ Links ]
9. Carter RWG. Coastal Environments: An introduction to the physical, ecological and cultural systems of coastlines. London: Academic Press; 1988. http://dx.doi.org/10.1016/B978-0-08-050214-4.50007-3 [ Links ]
10. Rossouw J. Review of existing wave data, wave climate and design waves for South African and South West African (Namibian) coastal waters. CSIR Report T/SEA 8401; Stellenbosch: CSIR; 1984. [ Links ]
11. Watermeyer Halcrow and Partners. The causes and prevention of periodic beach erosion of the southern beaches of Port Elizabeth. Part 1. Port Elizabeth: City Engineers Department; 1986. [ Links ]
12. Martin AK, Flemming BW. The Holocene sediment wedge off the south and east coasts of South Africa. In: Knight RJ, McClean JR, editors. Shelf sand and sandstones, Memoir II. Calgary: Canadian Society of Petroleum Geologists; 1986. p. 27-44. [ Links ]
13. Silvester R, Hsu JRC. Coastal stabilization: Innovative concepts. Englewood Cliffs, NJ: Prentice-Hall; 1993. [ Links ]
14. Flemming BW. Geology, morphology and sedimentology of estuaries and coasts. In: Wolansky E, McClusky DS, editors. Treatise on estuarine and coastal science. Waltham: Academic Press; 2011. p. 7-38. http://dx.doi.org/10.1016/B978-0-12-374711-2.00302-8 [ Links ]
15. Fitzgerald DM, Kraus NC, Hands, EB. Natural mechanisms of sediment bypassing at tidal inlets. ERDC/CHL CHETN-IV-30, Vicksburg, MS: US Army Engineer Research and Development Center; 2000. [ Links ]
16. Raubenheimer B, Guza RT, Elgar S. Field observations of wave-driven setdown and setup. J Geophys Res-Oceans. 2001;106:4629-4638. http://dx.doi.org/10.1029/2000JC000572 [ Links ]
17. Schumann EH, Brink KH. Coastal trapped waves off the coast of South Africa: Generation, propagation and current structures. J Phys Oceanogr. 1990;20:1206-1218. http://dx.doi.org/10.1175/1520-0485(1990)020<1206:CTWOTC>2.0.CO;2 [ Links ]
18. Zhang P Schumann EH, Shone RW. Effects of a storm surge coincident with a high spring tide in the Gamtoos Estuary, May 1992. S Afr J Sci. 1995;91:412-414. [ Links ]
19. Schumann EH, Largier JL, Slinger JH. Estuarine hydrodynamics. In: Allanson BR, Baird D, editors. Estuaries of South Africa. Cambridge: Cambridge University Press; 1999. p. 27-52. http://dx.doi.org/10.1017/CBO9780511525490.003 [ Links ]
20. Open University. Waves, tides and shallow-water processes. Oxford: Pergamon Press; 1989. [ Links ]
21. Cooper JAG, Wright CI, Mason TR. Geomorphology and sedimentology. In: Allanson BR, Baird D, editors. Estuaries of South Africa. Cambridge: Cambridge University Press; 1999. p. 5-26. http://dx.doi.org/10.1017/CBO9780511525490.002 [ Links ]
22. Dyer KR. Estuaries: A physical introduction. Chichester: John Wiley and Sons; 1997. [ Links ]
23. Cooper JAG. The role of extreme floods in estuary-coastal behaviour: Contrasts between river-dominated and tide-dominated microtidal estuaries. Sediment Geol. 2002;150:123-137. http://dx.doi.org/10.1016/S0037-0738(01)00271-8 [ Links ]
 Correspondence:
Eckart Schumann
26 Marine Gardens, Glengarry Crescent
Humewood 6013, South Africa
Email: eckarts@mweb.co.za
Received: 30 Oct. 2014
Revised: 26 Feb. 2015
Accepted: 09 Mar. 2015

