


Serviços Personalizados
Artigo
 Inglês (pdf)
 Artigo em XML
 Referências do artigo
Indicadores

Links relacionados
-
 Citado por Google
 -
 Similares em Google
Compartilhar

 Permalink
South African Journal of Science
versão On-line ISSN 1996-7489
versão impressa ISSN 0038-2353
S. Afr. j. sci. vol.111 no.11-12 Pretoria Nov./Dez. 2015
http://dx.doi.org/10.17159/sajs.2015/20140389
RESEARCH ARTICLE
Assessing the effects of climate change on distributions of Cape Floristic Region amphibians
Mohlamatsane M. MokhatlaI, II; Dennis RödderIII; G. John MeaseyII
IDepartment of Zoology, Nelson Mandela Metropolitan University, Port Elizabeth, South Africa
IICentre for Invasion Biology, Department of Botany and Zoology, Stellenbosch University, Stellenbosch, South Africa
IIIZoologisches Forschungsmuseum Alexander Koenig, Bonn, Germany
ABSTRACT
Climatic changes have had profound impacts on species distributions throughout time. In response, species have shifted ranges, adapted genetically and behaviourally or become extinct. Using species distribution models, we examined how changes in suitable climatic space could affect the distributions of 37 endemic frog species in the Cape Floristic Region (CFR) - an area proposed to have evolved its megadiversity under a stable climate, which is expected to change substantially in future. Species distributions were projected onto mean climate for a current period (1950 to 2000), hindcasted to palaeoclimate (Last Glacial Maximum; LGM = 21 kya and Holocene Glacial Minimum; HGM = 6 kya) and forecasted for two emissions scenarios (A2a and B2a) for the year 2080. We then determined the changes in area sizes, direction (longitude and latitude), fragmentation index and biotic velocity, and assessed if these were affected by life-history traits and altitude. We found that the biotic velocity at which the CFR amphibian community is expected to shift north (A2a = 540.5 km/kya) and east (B2a = 198 km/kya) far exceeds historical background rates (=1.05 km/kya, north and west = 2.36 km/kya since the LGM). Our models further suggest that the CFR amphibian community has already lost about 56% of suitable climate space since the LGM and this loss is expected to accelerate under future emission scenarios (A2a = 70%; B2a = 60%). Lastly, we found that highland species were more fragmented than lowland species between the LGM and current period, but that the fragmentation of lowland species between current and future climates is expected to increase.
Keywords: amphibian community; species range shifts; Cape Floristic Region; species distribution models; biotic velocity
Introduction
Climatic changes have had profound impacts on the survival and extinction rates of species through time.1 One of the ways in which species have dealt with these climatic changes has been to adjust their distribution ranges2, although changes in behaviour and genetic adaptation can also play a role3,4. Evidence from ice cores and other climate reconstruction studies5,6 has provided better insight into how past climatic changes may have structured distributions as climates were changing. Recent evidence from fossil records suggests that past climatic fluctuations may have brought about changes at broadscale regional or biome level. Examples of such changes include the occurrence of lakes and 'forest-elements' within the current Sahara region (between 11 kya and 4 kya, under warmer and wetter conditions) and the replacement of forest by savannah vegetation in equatorial west Africa when conditions are predicted to have been warmer and drier than present.7
Studies undertaken in southern Africa, particularly in the Cape Floristic Region (CFR) suggest that climate has remained relatively stable throughout the Quaternary.5 Indeed, areas such as the CFR that are proposed to have experienced relatively stable climate coincide with contemporary centres of richness and narrowly distributed endemic species.2 These areas may have served as climate refugia during times of climatic perturbations.8,9 Moreover, such areas are also proposed to have experienced relatively slow climate change velocities.10,11 Conversely, areas that have experienced rapid changes in climate are suggested to harbour biota that have coupled biotic velocities: the velocity of shifts in species' climate envelopes.12 Understanding how communities respond to these changes is very important given the biological importance of megadiverse regions under threat.13 Amphibians of the CFR in particular provide an excellent group to study the role of climate in structuring species community distribution because: (1) they are biogeographically distinct at a global scale14 and (2) amphibians are generally considered to be poor dispersers15, and are thus more directly affected by changes in climate compared to other vertebrates.
While attempting to elucidate the importance of ecological factors in describing amphibian species distribution patterns in southern Africa, Poynton16 hypothesised that the climatic oscillations resulting from Milankovitch cycles would have driven the expansion of the CFR amphibian assemblage inland as a response to an increase in climatic suitability during glacial periods. Dynesius and Jansson2 suggest that large-scale climatic oscillations may have favoured species with large distribution ranges, because these species were able to migrate to climatically suitable areas or persist in climatically unsuitable areas17,18. Furthermore, other past climate models for the CFR argue that during glacial periods, the extent of the CFR's winter rainfall area increased as a result of westerlies migrating north towards the equator, providing moisture to areas of the current Karoo region,19 thus supporting Poynton's hypothesis. Until recently, it had been very difficult to test such hypotheses. However, using species distribution modelling techniques, a recent test of Poynton's hypothesis concluded that he was correct in predicting range expansion of the CFR assemblage during glacial periods.20 Nevertheless, instead of expanding inland, the assemblage was predicted to have made use of the exposed Agulhas bank during periods when sea level was much lower.5
Future climate models for southern Africa predict increased drying in the winter rainfall region21,22, caused by the increase in both Indian and Atlantic sea surface temperatures and the El Nino Southern Oscillation23. Understanding how changes in climate may have structured distribution is of particular relevance as it will help in: (1) predicting how current changes in climate might affect distributions as well as interactions among species24 in the CFR and (2) adequately planning for these changes considering the climatic history of the region2 and other biodiversity threats such as habitat modification25. The aim of this study is to determine how climate (palaeo-, current and future) affects the distribution of the CFR endemic amphibian community. To do this we adopt an ensemble modelling approach using general circulation models (GCMs) of two palaeoclimates and four future climate GCMs, projected under two emission scenarios. In particular, we determine how the distributions of the CFR amphibian community have changed in terms of: (1) direction (latitude and longitude), (2) area of occupancy (changes in areas occupied at different climate periods), (3) biotic velocities (the rate at which communities shift with changes in climate)12 and (4) fragmentation. Furthermore, we estimate how life-history traits and altitudinal specialisation affect these outcomes. We assume that shifts (direction of movement and size) in climatically suitable space across climatic periods will lead to coupled species range shifts in the CFR amphibian community.20
Methods
Data
The most recent taxonomic treatment of species was used to ensure that all species of interest were included.2629 Approximately 40 species are endemic to the CFR (here taken as areas representing both the Fynbos and the Succulent Karoo Biomes30; Figure 1). We excluded three recently described species (Breviceps branchi31, Cacosternum aggestum and C. australis32) because of the relative lack of distribution records, leaving 37 CFR endemic amphibian species from six families for further analysis. Some amphibians do not display a biphasic typical amphibian lifestyle, for example members of the direct developing genus Arthroleptella endemic to the CFR33, which leads to a variation in the ways each life-history trait will be affected by threats34. To assess the effect of life-history traits on species distributions resulting from changes in climate, species were grouped according to their modes of egg deposition and development35 (Supplementary table 1 online).
There was a high variation in the number of available species distribution records, from Cacosternum platys, Rose 1950 (4 records) to Tomopterna delalandii, Tschudi 1838 (541 records). Occurrence records were obtained from the South African Frog Atlas Project (SAFAP)33, CapeNature and iSpot, as well as records published in recent literature26,29,36 and our own observations. We included only records with accuracy to the nearest second or higher. Records were projected into ArcMap GIS 10.237 to identify any doubtful records that may have been recorded outside known ranges, using Global Amphibian Assessment (IUCN 2008; http://www.iucnredlist.org/; accessed September 2013) polygons as 'known distribution ranges'. Based on these results, we judged whether the outlying records represented credible sightings or should be excluded from further analyses.
Climate data
Environmental predictors were compiled from a set of 19 bioclimatic variables at a spatial resolution of 2.5 arc minutes available from WorldClim.38 Inter-correlation structure among predictors throughout the study area was assessed by computing pairwise squared Spearman's rank correlation coefficients, and in cases in which R2exceeded 0.75, only the putatively biologically most important variables were retained. After computing the Spearman's rank correlations, 10 variables were retained: isothermality (mean diurnal range/temperature annual range; BIO3), temperature annual range (BIO7), temperature of wettest quarter (BIO8), mean temperature of driest quarter (BIO9), mean temperature of warmest quarter (BIO10), mean temperature of coldest quarter (BIO11), precipitation of wettest month (BIO13), precipitation seasonality (BIO15), precipitation of driest quarter (BIO17) and precipitation of coldest quarter (BIO19); see Supplementary table 2 online for percentage variable contributions.
Species distribution modelling
Species distribution model projections were created at a 2.5 arc minute resolution, using current distribution data to reconstruct hypothetical distributions for palaeo- and future climate. To reconstruct past distributions, we projected species distribution models onto palaeo-climate for the Last Glacial Maximum (LGM ~ 21 kya) and the Mid-Holocene/Holocene Glacial Minimum (HGM ~ 6 kya) climate periods. We used two GCMs: the Community Climate System Model (CCSM)39 and the Model for Interdisciplinary Research on Climate (MiROC)40, available through http://pmip2.lsce.ipsl.fr/41. Palaeoclimate data were downscaled to a spatial resolution of 2.5 arc minutes following the delta method.42 Current distributions were based on species distribution modelling projections onto mean climate from 1950 to 2000. To forecast future distributions for the year 2080, species distribution models were projected using four GCMs, to capture the variability associated with predicting climate change: (1) General Circulation Global Climate Model (CGCM2)43, (2) Hadley Centre Coupled Model (HadCM3)44, (3) Commonwealth Scientific and Industrial Research Organisation Mark-2b (CSIRO-Mk2)45 and (4) National Institute for Environmental Studies (NIES 99)46. Each GCM was projected onto two Intergovernmental Panel on Climate Change emission scenarios, both representing a more heterogeneous world: (1) A2a representing a business as usual climate outlook with average temperature increases between 2.0 °C and 5.4 °C and (2) B2a representing a more optimistic outlook with a moderate increase in future temperature of between 1.4 °C and 3.8 °C.47
The selected environmental variables were used to model both past and future potential distributions of amphibian species using an ensemble species distribution modelling framework, BIOMOD248 - a multi-model platform implemented in R.49 The BIOMOD2 procedure uses an ensemble of modelling techniques including generalised linear models, general additive models, generalised boosted models, classification tree analysis, artificial neural networks, surface range envelope, flexible discriminant analysis, multi-adaptive regression splines, random forests, including maximum entropy to produce consensus models, which are weighted averages between all models.50 To ensure that our models were comparable across scale, they were rescaled using a binomial generalised linear model.
We randomly selected 1000 pseudo absence records, three times within a circular buffer of 100 km enclosing the species records as environmental background. For model evaluation, we divided the species records into 80% used to train the models and 20% for model evaluation using three different performance criteria (area under the receiver operating characteristic curve, AUC51; true skills statistics; and Cohen's kappa52). As a quality threshold for the final ensemble, we selected only those models with an AUC score greater than 0.7 (Supplementary table 3 online). The final ensemble was built using a proportional weighting of the models according to their predictive performance. As a presence-absence threshold, we selected the minimum training presence as the non-fixed threshold.53 When projecting the ensemble across space and time, non-analogous climatic conditions that exceeded the training range of the models were quantified, wherein the numbers of these predictors were highlighted using multivariate environmental similarity surfaces (MESS)54 (see online Supplementary figures 1 and 2: palaeo-, current and future projections for Arthroleptella bicolor as an example). Projections into non-analogous climates may increase the potential for extrapolation and interpolation errors.54 Potential areas of occurrence were computed based on presence-absence maps applying the minimum training presence threshold using the respective functions in the raster package for R (i.e. 'area') but excluding extrapolation areas as identified by MESS. To determine the final consensus area projection for each climate period across all models (different GCMs), we projected all models on to ArcMap 1 0.237 and the consensus was taken as a combination of all grid cells that were identified as suitable by 50% or more of the models at each climate period55.
Statistical analyses
To assess changes in species distributions across climatic periods, we calculated the total area, perimeter and the centroid coordinates for each species across climatic periods from suitable climate space projections. Area and perimeter were then used to determine the fragmentation index (i.e. the landscape dissection index, DI')56. This was achieved by determining the edge of each species distribution range, in relation to the core of the distribution using the formula:
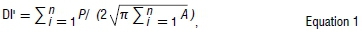
where P is the perimeter and A is the area. DI compares the amount by which any 'island' or a distribution range is dissected relative to the total area, with a DI' of 1 representing a circle, suggesting a less fragmented shape with a low perimeter to area ratio. We determined changes in area occupancy, rate of area change, the direction of range shifts (across both longitudes and latitudes) and fragmentation index (DI') between climate periods.57,58 We ran our results in two ways: first with a full suite of 37 species and second with 34 species (excluding those species with less than 10 species records, to avoid model over-fitting59). We found that the results in both attempts were almost identical and that patterns remained largely similar and thus report results of the analysis considering a full suite of 37 species. Lastly, we checked whether these changes were affected by altitude and life-history trait. All the tests were performed in R.49
Results
Range shifts
Our results suggest that the amphibian community of the CFR would have responded to Quaternary climatic changes by shifting distributions. Longitudinally, we found that between the LGM and current periods, amphibian communities have shifted their distribution northwards, and are expected to shift further northwards, for both A2a and B2a emission scenarios. Biotic velocity has been relatively slow since the LGM to current, but it is expected to increase dramatically if amphibian communities are assumed to track climate suitable space under anthropogenically induced climate change towards the end of this century (Figure 1a; e.g. LGM-HGM = 1.058 km/kya compared with current-A2a = 540.554 km/kya). Across latitudes, our models suggest that the CFR amphibian community has shifted its range westward between the LGM and HGM, as well as between the HGM and current. However between current and 2080, our models suggest that the CFR amphibian community will shift eastward under both A2a and B2a emission scenarios, although we found this shift between climate periods to be significant for the B2a emission scenario only (paired t-test; t=2.119; p=0.039). Biotic velocity across latitudes between current and B2a climate periods is expected to occur at rapid rates compared with historical rates (Figure 1a; LGM-HGM = 2.360 km/kya compared with current-B2a = 198.319 km/kya).
Changes in area of occupancy
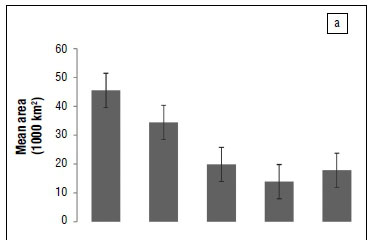
We found that the CFR amphibian community has progressively lost =56% of its suitable climate space since the LGM. Furthermore it is expected to lose =70% and 60% of climatically suitable space under A2a and B2a emission scenarios, respectively (Figure 2a). However, we found that the rate at which the CFR endemic amphibian community has lost climatically suitable space has been relatively slow between the LGM and HGM and HGM and current, but this rate is expected to increase significantly under future climate change (in particularly, under the A2a emission scenario; Figure 1b).
Landscape dissection index
Fragmentation of potential distributions increased slightly from LGM to HGM, but decreased between HGM and current climates (Figure 2b). Our models predict that fragmentation will increase under future scenarios. We did not find any significant difference between life-history traits and DI'. In contrast, we found that the fragmentation of highland species was significantly higher than that of lowland species between HGM and the current climate (Mann-Whitney-Wilcox test; 1/1/=37, p=0.002). However, between current and future climate periods under the A2a emission scenario, fragmentation of lowland species is expected to be higher than that of highland species (W=18, p=0.033). When looking at each climate period separately, we found that highland species were significantly more fragmented than lowland species during the LGM (W=113, p=0.035), HGM (W=162, p=0.012) and current scenarios (W=233, p=0.023) (Figure 3). Lastly, we found that the rate at which DI' changed was only significant between HGM and the current (paired t-test; t=2.065, p=0.047).
Discussion
Quaternary climate changes have had significant impacts on the distributions of amphibian communities in the CFR as predicted16 and modelled20. Our results suggest that climatically suitable areas for the CFR amphibian community have shifted northwards since the LGM, and are expected to shift further northwards under both A2a and B2a future emissions scenarios. Latitudinally, we found that the amphibian community shifted westward from the LGM through to current, but this trend is expected to change to an eastwards directional community shift under both A2a and B2a emission scenarios. Furthermore, our models indicate that fragmentation is expected to increase under future climatic scenarios (Figure 2b) as amphibian communities are predicted to continuously lose suitable climatic space (Figure 2a). These results largely concur with previous studies undertaken in the region.60
One multi-taxon study which included birds, mammals, reptiles and insects for the whole of South Africa suggested that about 78% of the species included in the analysis are expected to experience range contractions, while 41% are expected to shift their ranges eastward, in response to future climatic changes by the year 2050.60 Other studies assessing the impacts of future climate change in the CFR also predicted an eastward directional shift and concluded that this shift will lead to large-scale spatial mismatches with current protected areas portfolio.61 The predicted range shifts and associated impacts are expected to result in as much as 50% loss in current climate space62 and as much as 10% of the endemic plant species.63 In addition, we found that the CFR amphibian community has lost =56% of its suitable climate. Indeed, several studies looking at anurans of southern Africa suggest that they have already lost =60% of suitable climate space64,65, such that current distributions could very well be representative of refugial distributions for most of the endemic Cape species20.
We found that fragmentation (as measured by the index DI') between highland and lowland species was more pronounced during the LGM, HGM and current distributions (Figure 3), with highland species being more fragmented than lowland species. When looking at fragmentation between climate periods, we found that the fragmentation index of lowland species is expected to be higher than that of highlands species, suggesting that projected changes in climate will exert pressure on the CFR lowland species in addition to substantial changes in land use.66 This result is of significance considering that the CFR lowlands have already been transformed,66 mainly for agriculture and human settlements, and will become more fragmented in the future as suitable climate space is lost to climate change. These results are supported by several studies suggesting that the coupled threat posed by climate change and land use will be very important, particularly for sub-Saharan African amphibians in the future.25,67,68 Furthermore, the suggested increase in fragmentation of lowland species points to the likely increase in movement along altitudinal gradients69 as species migrate to highlands in response to projected climate change65. This finding further emphasises the importance of improving habitat linkages between the CFR highlands and lowlands,70 thus retaining the opportunity for altitudinal migrations, which may be critical for poorly dispersing taxa such as amphibians.
Our results, based on future climate change models for the CFR, suggest significant range reductions for the CFR amphibian community as well as rapid rates of suitable area loss. However, certain issues must be taken into consideration when interpreting these results. Firstly, despite their importance in conservation biology, correlative models such as species distribution modelling techniques are largely based on the assumption that species distributions are in tune with current climatic factors, and this assumption could lead to an under-estimation of what the real future impact might be15, specifically when considered in the light of other biodiversity threats such as habitat destruction71. Secondly, our landscape dissection index DI' does not standardise for area size.71 However, controlling for area size in predictive modelling studies may be problematic as these areas are largely speculative. Nonetheless, these methods are still informative and our predictions are in line with those of previous studies.64 Thirdly, the rate of change (as determined in this study) for past and future models, are simple averages taken across climatic periods. We are, however, of the view that past climatic changes, resulting from Milankovitch cycles, provided species with time to track climatically suitable areas because landscapes were untransformed. We are also aware that species range shifts are but one of several strategies amphibian communities can employ in response to climatic change: other strategies include behavioural, physiological and genetic adaptations.3,4
In conclusion, we suggest that the results of this study provide important baseline information for a region-wide assessment of the predicted impacts of climate change on a highly diverse vertebrate community of reduced vagility. If we are to reduce the threat of biodiversity loss as a result of climate change within the CFR, several factors need to be addressed. Firstly, climate change should be included in future protected areas planning efforts.72,73 Secondly, efforts aimed at improving the connectivity between highland and lowlands as well as the breeding (e.g. aquatic) and the non-breeding (e.g. terrestrial) habitats of amphibians within the CFR need to be intensified. Thirdly, solutions such as the land stewardship programmes entered into with private landowners should be accelerated74, considering that most biodiversity is found in privately owned land in the CFR75. These solutions are particularly important if we consider that amphibians have strong habitat specificity, which is largely driven by their generally poor dispersal abilities.76 This specificity results in deep phylogenetic structures at relatively small spatial scales15 which could be an outcome of both climate stability and topography77. We advocate that future models should try to incorporate the use of different GCMs55 because such consensus models outperform individual GCMs in predicting consensus climatic space. We also suggest that, if possible, these GCMs should be augmented with mechanistic models78 as species are more likely to use different responses available (behaviour, physiology and range shifts) when dealing with predicted changes in climate.
Acknowledgements
We thank the numerous volunteers who contributed their amphibian species distribution data to SAFAP, CapeNature, and iSpot, and Werner Conradie, Lemmy Mashinini, Sarah Davies, Andrew Turner and Tony Rebelo. We also thank Peter Bradshaw for advice on GIS and Giovanni Vimercati for reading through previous drafts of this manuscript. We acknowledge the editor and two anonymous reviewers, whose comments helped to improve the quality of the manuscript. M.M.M. acknowledges support from the NRF Innovation bursary and the Nelson Mandela Metropolitan University. G.J.M. acknowledges the DST-NRF Centre of Excellence for Invasion Biology for support.
Authors' contributions
G.J.M. and M.M.M. conceived the ideas. D.R. and M.M.M. constructed species distribution models. All authors analysed the data and wrote the manuscript.
References
1. Wake DB, Vredenburg VT. Are we in the midst of the sixth mass extinction? A view from the world of amphibians. Proc Natl Acad Sci USA. 2008;105:11466-11473. http://dx.doi.org/10.1073/pnas.0801921105 [ Links ]
2. Dynesius M, Jansson R. Evolutionary consequences of changes in species' geographical distributions driven by Milankovitch climate oscillations. Proc Natl Acad Sci USA. 2000;97:9115-9120. http://dx.doi.org/10.1073/pnas.97.16.9115 [ Links ]
3. Davis MB, Shaw RG. Range shifts and adaptive responses to Quaternary climate change. Science. 2001;292:673-679. http://dx.doi.org/10.1126/science.292.5517.673 [ Links ]
4. Jump AS, Penuelas J. Running to stand still: Adaptation and the response of plants to rapid climate change. Ecol Lett. 2005;8:1010-1020. http://dx.doi.org/10.1111/j.1461-0248.2005.00796.x [ Links ]
5. Compton JS. Pleistocene sea-level fluctuations and human evolution on the southern coastal plain of South Africa. Quaternary Sci Rev. 2011;30:506-527. http://dx.doi.org/10.1016/j.quascirev.2010.12.012 [ Links ]
6. Zachos J, Pagani M, Sloan L, Thomas E, Billups K. Trends, rhythms, and aberrations in global climate 65 Ma to present. Science. 2001;292:686-693. http://dx.doi.org/10.1126/science.1059412 [ Links ]
7. Willis KJ, Bennett KD, Burrough SL, Macias-Fauria M, Tovar C. Determining the response of African biota to climate change: Using the past to model the future. Philos T Roy Soc B. 2013;368, Art. #20120491, 9 pages. http://dx.doi.org/10.1098/rstb.2012.0491 [ Links ]
8. Araújo MB, Nogués-Bravo D, Diniz-Filho JAF, Haywood AM, Valdes PJ, Rahbek C. Quaternary climate changes explain diversity among reptiles and amphibians. Ecography. 2008;31:8-15. http://dx.doi.org/10.1111/j.2007.0906-7590.05318.x [ Links ]
9. Jansson R. Global patterns in endemism explained by past climatic change. P Roy Soc Lond B Bio. 2003;270:583-590. http://dx.doi.org/10.1098/rspb.2002.2283 [ Links ]
10. Loarie SR, Duffy PB, Hamilton H, Anser GP Field CB, Ackerly DD. The velocity of climate change. Nature. 2009;462:1052-1055. http://dx.doi.org/10.1038/nature08649 [ Links ]
11. Sandel B, Arge L, Dalsgaard B, Davies RG, Gaston KJ, Sutherland WJ, et al. The influence of Late Quaternary climate-change velocity on species endemism. Science. 2011;334:660-664. http://dx.doi.org/10.1126/science.1210173 [ Links ]
12. Ordonez A, Williams JW. Climatic and biotic velocities for woody taxa distributions over the last 16 000 years in eastern North America. Ecol Lett. 2013;16:773-781. http://dx.doi.org/10.1111/ele.12110 [ Links ]
13. Myers N, Mittermeier RA, Mittermeier CG, Da Fonseca GA, Kent J. Biodiversity hotspots for conservation priorities. Nature. 2000;403:853-858. http://dx.doi.org/10.1038/35002501 [ Links ]
14. Holt BG, Lessard J-P Borregaard MK, Fritz SA, Araújo MB, Dimitrov D, et al. An update of Wallace's zoogeographic regions of the world. Science. 2013;339:74-78. http://dx.doi.org/10.1126/science.1228282 [ Links ]
15. Tolley KA, De Villiers AL, Cherry MI, Measey GJ. Isolation and high genetic diversity in dwarf mountain toads (Capensibufo) from South Africa. Biol J Linn Soc. 2010;100:822-834. http://dx.doi.org/10.1111/j.1095-8312.2010.01469.x [ Links ]
16. Poynton J. The biotic divisions of southern Africa, as shown by the Amphibia. In: Davis DHS, editor. Ecological studies in southern Africa. The Hague: Junk; 1964. p. 206-218. [ Links ]
17. Jansson R, Dynesius M. The fate of clades in a world of recurrent climatic change: Milankovitch oscillations and evolution. Annu Rev Ecol Syst. 2002;33:741-777. http://dx.doi.org/10.1146/annurev.ecolsys.33.010802.150520 [ Links ]
18. Van Bocxlaer I, Loader SP Roelants K, Biju SD, Menegon M, Bossuyt F. Gradual adaptation toward a range-expansion phenotype initiated the global radiation of toads. Science. 2010;327:679-682. http://dx.doi.org/10.1126/science.1181707 [ Links ]
19. Chase BM, Meadows ME. Late Quaternary dynamics of southern Africa's winter rainfall zone. Earth-Sci Rev. 2007;84:103-138. http://dx.doi.org/10.1016/j.earscirev.2007.06.002 [ Links ]
20. Schreiner C, Rödder D, Measey GJ. Using modern models to test Poynton's predictions. Afr J Herpetol. 2013;62:49-62. http://dx.doi.org/10.1080/21564574.2013.794865 [ Links ]
21. Engelbrecht C, Engelbrecht F, Dyson L. High-resolution model-projected changes in mid-tropospheric closed-lows and extreme rainfall events over southern Africa. Int J Climatol. 2013;33:173-187. http://dx.doi.org/10.1002/joc.3420 [ Links ]
22. Giannini A, Biasutti M, Held IM, Sobel AH. A global perspective on African climate. Climatic Change. 2008;90:359-383. http://dx.doi.org/10.1007/s10584-008-9396-y [ Links ]
23. Hoerling M, Hurrell J, Eischeid J, Phillips A. Detection and attribution of twentieth-century northern and southern African rainfall change. J Clim. 2006;19:3989-4008. http://dx.doi.org/10.1175/JCLI3842.1 [ Links ]
24. Blois JL, Zarnetske PL, Fitzpatrick MC, Finnegan S. Climate change and the past, present, and future of biotic interactions. Science. 2013;341:499-504. http://dx.doi.org/10.1126/science.1237184 [ Links ]
25. Newbold T, Hudson LN, Hill SLL, Contu S, Lysenko I, Senior RA, et al. Global effects of land use on local terrestrial biodiversity. Nature. 2015;520:45-50. http://dx.doi.org/10.1038/nature14324 [ Links ]
26. Channing A, Wahlberg K. Distribution and conservation status of the desert rain frog Breviceps macrops. Afr J Herpetol. 2011;60:101-112. http://dx.doi.org/10.1080/21564574.2011.608383 [ Links ]
27. Frost DR, Grant T, Faivovich J, Bain RH, Haas A, Haddad CFB, et al. The amphibian tree of life. B Am Mus Nat Hist. 2006;297:1-291. http://dx.doi.org/10.1206/0003-0090(2006)297[0001:TATOL]2.0.CO;2 [ Links ]
28. Turner AA, Channing A. A new species of Arthroleptella Hewitt, 1926 (Anura: Pyxicephalidae) from the Klein Swartberg Mountain, Caledon, South Africa. Afr J Herpetol. 2008;57:1-12. http://dx.doi.org/10.1080/21564574.2008.9635564 [ Links ]
29. Turner AA, De Villiers AL, Dawood A, Channing A. A new species of Arthroleptella Hewitt, 1926 (Anura: Ranidae) from the Groot Winterhoek Mountains of the Western Cape Province, South Africa. Afr J Herpetol. 2004;53:1-12. http://dx.doi.org/10.1080/21564574.2004.9635493 [ Links ]
30. Colville JF, Potts AJ, Bradshaw PL, Measey GJ, Snijman D, Picker MD, et al. Floristic and faunal Cape biochoria: Do they exist? In: Allsopp N, Colville JF, Verboom GA, editors. Fynbos: Ecology, evolution, and conservation of a megadiverse region. Oxford: Oxford University Press; 2014. p. 73-92. http://dx.doi.org/10.1093/acprof:oso/9780199679584.001.0001 [ Links ]
31. Channing A. A new species of rain frog from Namaqualand, South Africa (Anura: Brevicipitidae: Breviceps). Zootaxa. 2012;3381:62-68. [ Links ]
32. Channing A, Schmitz A, Burger M, Kielgast J. A molecular phylogeny of African Dainty Frogs, with the description of four new species (Anura: Pyxicephalidae: Cacosternum). Zootaxa. 2013;3701:518-550. http://dx.doi.org/10.11646/zootaxa.3701.5.2 [ Links ]
33. Minter LR, Burger M, Harrison JA, Braak HH, Bishop PJ, Kloepfer D. Atlas and red data book of the frogs of South Africa, Lesotho, and Swaziland. Washington DC/Cape Town: Smithsonian Institute/Avian Demography Unit; 2004. [ Links ]
34. Mokhatla MM, Measey GJ, Chimimba CT, Van Rensburg BJ. A biogeographical assessment of anthropogenic threats to areas where different frog breeding groups occur in South Africa: Implications for anuran conservation. Divers Distrib. 2012;18:470-480. http://dx.doi.org/10.1111/j.1472-4642.2011.00870.x [ Links ]
35. Wells KD. The ecology and behavior of amphibians. Chicago, IL: University of Chicago Press; 2007. http://dx.doi.org/10.7208/chicago/9780226893334.001.0001 [ Links ]
36. Measey GJ, Tolley KA. Investigating the cause of the disjunct distribution of Amietophrynus pantherinus, the endangered South African western leopard toad. Conserv Genet. 2011;12:61-70. http://dx.doi.org/10.1007/s10592-009-9989-7 [ Links ]
37. ArcGIS Desktop version 10.2. Redlands, CA: Environmental Systems Research Institute; 2011. [ Links ]
38. Hijmans RJ, Cameron SE, Parra JL, Jones PG, Jarvis A. Very high resolution interpolated climate surfaces for global land areas. Int J Climatol. 2005;25:1965-1978. http://dx.doi.org/10.1002/joc.1276 [ Links ]
39. Otto-Bliesner BL, Brady EC, Clauzet G, Tomas R, Levis S, Kothavala Z. Last Glacial Maximum and Holocene climate in CCSM3. J Climate. 2006;19:2526-2544. http://dx.doi.org/10.1175/JCLI3748.1 [ Links ]
40. Hasumi H, Emori S. K-1 coupled gcm (miroc) description. Tokyo: Center for Climate System Research, University of Tokyo; 2004. [ Links ]
41. Braconnot P Otto-Bliesner B, Harrison S, Joussaume S, Peterchmitt J-Y Abe-Ouchi A, et al. Results of PMIP2 coupled simulations of the Mid-Holocene and Last Glacial Maximum Part 1: Experiments and large-scale features. Clim Past. 2007;3:261-277. http://dx.doi.org/10.5194/cp-3-261-2007 [ Links ]
42. Peterson AT, Nyari AS. Ecological niche conservatism and Pleistocene refugia in the thrush-like mourner, Schiffornis sp., in the neotropics. Evolution. 2008;62:173-183. [ Links ]
43. Flato G, Boer G. Warming asymmetry in climate change simulations. Geophys Res Lett. 2001;28:195-198. http://dx.doi.org/10.1029/2000GL012121 [ Links ]
44. Gordon C, Cooper C, Senior CA, Banks H, Gregory JM, Johns TC, et al. The simulation of SST, sea ice extents and ocean heat transports in a version of the Hadley Centre coupled model without flux adjustments. Clim Dynam. 2000;16:147-168. http://dx.doi.org/10.1007/s003820050010 [ Links ]
45. Gordon HB, O'Farrell SR Transient climate change in the CSIRO coupled model with dynamic sea ice. Mon Weather Rev. 1997;125:875-908. http://dx.doi.org/10.1175/1520-0493(1997)125<0875:TCCITC>2.0.CO;2 [ Links ]
46. Emori S, Nozawa T, Abe-Ouchi, A, Numaguti A, Kimoto M, Nakajima T. Coupled ocean-atmosphere model experiments of future climate change with an explicit representation of sulfate aerosol scattering. J Meteor Soc Japan. 1999;77:1299-1307. [ Links ]
47. Nakicenovic N, Swart R, editors. Special report on emissions scenarios. Cambridge, UK: Cambridge University Press; 2000. [ Links ]
48. Thuiller W, Georges D, Engler R. biomod2: Ensemble platform for species distribution modeling. R package version 2; 2013. [ Links ]
49. R Development Core Team. R: A language and environment for statistical computing; 2014. [ Links ]
50. Marmion M, Rarviainen M, Luoto M, Heikkinen RK, Thuiller W. Evaluation of consensus methods in predictive species distribution modelling. Divers Distrib. 2009;15:59-69. http://dx.doi.org/10.1111/j.1472-4642.2008.00491.x [ Links ]
51. Swets JA. Measuring the accuracy of diagnostic systems. Science. 1988;240:1285-1293. http://dx.doi.org/10.1126/science.3287615 [ Links ]
52. Allouche O, Tsoar A, Kadmon R. Assessing the accuracy of species distribution models: Prevalence, kappa and the true skill statistic (TSS). J Appl Ecol. 2006;43:1223-1232. http://dx.doi.org/10.1111/j.1365-2664.2006.01214.x [ Links ]
53. Liu C, Berry PM, Dawson TP Pearson RG. Selecting thresholds of occurrence in the prediction of species distributions. Ecography. 2005;28:385-393. http://dx.doi.org/10.1111/j.0906-7590.2005.03957.x [ Links ]
54. Elith J, Rhillips SJ, Hastie T, Dudik M, Chee YE, Yates CJ. A statistical explanation of MaxEnt for ecologists. Divers Distrib. 2011;17:43-57. http://dx.doi.org/10.1111/j.1472-4642.2010.00725.x [ Links ]
55. Forester BR, DeChaine EG, Bunn AG. Integrating ensemble species distribution modelling and statistical phylogeography to inform projections of climate change impacts on species distributions. Divers Distrib. 2013;19:1480-1495. http://dx.doi.org/10.1111/ddi.12098 [ Links ]
56. Bowen GW, Burgess R. Quantitative analysis of forest island pattern in selected Ohio landscapes. Oak Ridge, TN: Oak Ridge National Laboratory; 1981. http://dx.doi.org/10.2172/6367140 [ Links ]
57. Van Der Wal J, Murphy HT, Kutt AS, Rerkins GC, Bateman BL, Rerry JJ, et al. Focus on poleward shifts in species' distribution underestimates the fingerprint of climate change. Nat Clim Change. 2013;3:239-243. http://dx.doi.org/10.1038/nclimate1688 [ Links ]
58. Wollenberg KC, Vieites DR, Glaw F, Vences M. Speciation in little: The role of range and body size in the diversification of Malagasy mantellid frogs. BMC Evol Biol. 2011;11:217. http://dx.doi.org/10.1186/1471-2148-11-217 [ Links ]
59. Rlatts RJ, Garcia RA, Hof C, Foden W, Hansen LA, Rahbek C, et al. Conservation implications of omitting narrow-ranging taxa from species distribution models, now and in the future. Divers Distrib. 2014;20:1307-1320. http://dx.doi.org/10.1111/ddi.12244 [ Links ]
60. Erasmus BF, Van Jaarsveld AS, Chown SL, Kshatriya M, Wessels KJ. Vulnerability of South African animal taxa to climate change. Glob Change Biol. 2002;8:679-693. http://dx.doi.org/10.1046/j.1365-2486.2002.00502.x [ Links ]
61. Hannah L, Midgley G, Hughes G, Bomhard B. The view from the Cape: Extinction risk, protected areas, and climate change. BioScience. 2005;55:231-242. http://dx.doi.org/10.1641/0006-3568(2005)055[0231:TVFTCE]2.0.CO;2 [ Links ]
62. Altwegg R, West A, Gillson L, Midgley GF. Impacts of climate change in the Greater Cape Floristic Region. In: Allsopp N, Colville JF, Verboom GA, editors. Fynbos: Ecology, evolution, and conservation of a megadiverse region. Oxford: Oxford University Rress; 2014. p. 299-320. http://dx.doi.org/10.1093/acprof:oso/9780199679584.003.0013 [ Links ]
63. Midgley G, Hannah L, Millar D, Rutherford M, Rowrie L. Assessing the vulnerability of species richness to anthropogenic climate change in a biodiversity hotspot. Global Ecol Biogeogr. 2002;11:445-451. http://dx.doi.org/10.1046/j.1466-822X.2002.00307.x [ Links ]
64. Botts EA, Erasmus BF, Alexander GJ. Methods to detect species range size change from biological atlas data: A comparison using the South African Frog Atlas Project. Biol Conserv. 2012;146:72-80. http://dx.doi.org/10.1016/j.biocon.2011.10.035 [ Links ]
65. Botts EA, Erasmus BF, Alexander GJ. Observed range dynamics of South African amphibians under conditions of global change. Austral Ecol. 2015;40(3):309-317. http://dx.doi.org/10.1111/aec.12215 [ Links ]
66. Bomhard B, Richardson DM, Donaldson JS, Hughes GO, Midgley GF, Raimondo DC, et al. Potential impacts of future land use and climate change on the Red List status of the Proteaceae in the Cape Floristic Region, South Africa. Glob Change Biol. 2005;11:1452-1468. http://dx.doi.org/10.1111/j.1365-2486.2005.00997.x [ Links ]
67. Foden WB, Butchart SHM, Stuart SN, Vié J-C, Akçakaya HR, Angulo A, et al. Identifying the world's most climate change vulnerable species: A systematic trait-based assessment of all birds, amphibians and corals. RLoS One. 2013;8, e65427. http://dx.doi.org/10.1371/journal.pone.0065427 [ Links ]
68. Hof C, Araújo MB, Jetz W, Rahbek C. Additive threats from pathogens, climate and land-use change for global amphibian diversity. Nature. 2011;480:516-519. http://dx.doi.org/10.1038/nature10650 [ Links ]
69. Parmesan C. Ecological and evolutionary responses to recent climate change. Annu Rev Ecol Evol Syst. 2006;37:637-669. http://dx.doi.org/10.1146/annurev.ecolsys.37.091305.110100 [ Links ]
70. Williams R Hannah L, Andelman S, Midgley GF, Araújo MB, Hughes G, et al. Planning for climate change: Identifying minimum-dispersal corridors for the Cape Proteaceae. Conserv Biol. 2005;19:1063-1074. http://dx.doi.org/10.1111/j.1523-1739.2005.00080.x [ Links ]
71. Thomas CD, Cameron A, Green RE, Bakkenes M, Beaumont LJ, Collingham YC, et al. Extinction risk from climate change. Nature. 2004;427:145-148. http://dx.doi.org/10.1038/nature02121 [ Links ]
72. D'Amen M, Bombi P. Global warming and biodiversity: Evidence of climate-linked amphibian declines in Italy. Biol Conserv. 2009;142:3060-3067. http://dx.doi.org/10.1016/j.biocon.2009.08.004 [ Links ]
73. Holness SD, Biggs HC. Systematic conservation planning and adaptive management. Koedoe. 2011;53:34-42. http://dx.doi.org/10.4102/koedoe.v53i2.1029 [ Links ]
74. Egoh BN, Reyers B, Carwardine J, Bode M, O'Farrell RJ, Wilson KA, et al. Safeguarding biodiversity and ecosystem services in the Little Karoo, South Africa. Conserv Biol. 2010;24:1021-1030. http://dx.doi.org/10.1111/j.1523-1739.2009.01442.x [ Links ]
75. Gallo JA, Pasquini L, Reyers B, Cowling RM. The role of private conservation areas in biodiversity representation and target achievement within the Little Karoo region, South Africa. Biol Conserv. 2009;142:446-154. http://dx.doi.org/10.1016/j.biocon.2008.10.025 [ Links ]
76. Tolley KA, Bowie RCK, Measey GJ, Price BW, Forest F. The shifting landscape of genes since the Pliocene: Terrestrial phylogeography in the Greater Cape Floristic Region. Oxford: Oxford University Rress; 2014. p. 142-163. [ Links ]
77. Cowling RM, Rroche§ ξ, Rartridge TC. Explaining the uniqueness of the Cape flora: Incorporating geomorphic evolution as a factor for explaining its diversification. Mol Phylogenet Evol. 2009;51:64-74. http://dx.doi.org/10.1016/j.ympev.2008.05.034 [ Links ]
78. Kearney M, Porter W. Mechanistic niche modelling: Combining physiological and spatial data to predict species' ranges. Ecol Lett. 2009;12:334-350. http://dx.doi.org/10.1111/j.1461-0248.2008.01277.x [ Links ]
 Correspondence:
Mohlamatsane Mokhatla
Centre of Excellence for Invasion Biology, Department of Botany and Zoology
Stellenbosch University
Matieland 7602, South Africa
Email: m.mokhatla@mail.com
Received: 05 Nov. 2014
Revised: 29 Apr. 2015
Accepted: 20 May 2015

