


Serviços Personalizados
Artigo
 Inglês (pdf)
 Artigo em XML
 Referências do artigo
Indicadores

Links relacionados
-
 Citado por Google
 -
 Similares em Google
Compartilhar

 Permalink
South African Journal of Science
versão On-line ISSN 1996-7489
versão impressa ISSN 0038-2353
S. Afr. j. sci. vol.111 no.9-10 Pretoria Set./Out. 2015
http://dx.doi.org/10.17159/SAJS.2015/20150019
RESEARCH ARTICLE
Systematic land-cover change in KwaZulu-Natal, South Africa: Implications for biodiversity
Debbie JewittI, II; Peter S. GoodmanI, II; Barend F.N. ErasmusII; Timothy G. O'ConnorII, III; Ed T.F. WitkowskiII
IBiodiversity Research, Ezemvelo KZN Wildlife, Pietermaritzburg, South Africa
IISchool of Animal, Plant and Environmental Sciences, University of the Witwatersrand, Johannesburg, South Africa
IIISouth African Environmental Observation Network, Pretoria, South Africa
ABSTRACT
Land-cover change and habitat loss are widely recognised as the major drivers of biodiversity loss in the world. Land-cover maps derived from satellite imagery provide useful tools for monitoring land-use and land-cover change. KwaZulu-Natal, a populous yet biodiversity-rich province in South Africa, is one of the first provinces to produce a set of three directly comparable land-cover maps (2005, 2008 and 2011). These maps were used to investigate systematic land-cover changes occurring in the province with a focus on biodiversity conservation. The Intensity Analysis framework was used for the analysis as this quantitative hierarchical method addresses shortcomings of other established land-cover change analyses. In only 6 years (2005-2011), a massive 7.6% of the natural habitat of the province was lost to anthropogenic transformation of the landscape. The major drivers of habitat loss were agriculture, timber plantations, the built environment, dams and mines. Categorical swapping formed a significant part of landscape change, including a return from anthropogenic categories to secondary vegetation, which we suggest should be tracked in analyses. Longer-term rates of habitat loss were determined using additional land-cover maps (1994, 2000). An average of 1.2% of the natural landscape has been transformed per annum since 1994. Apart from the direct loss of natural habitat, the anthropogenically transformed land covers all pose additional negative impacts for biodiversity remaining in these or surrounding areas. A target of no more than 50% of habitat loss should be adopted to adequately conserve biodiversity in the province. Our analysis provides the first provincial assessment of the rate of loss of natural habitat and may be used to fulfil incomplete criteria used in the identification of Threatened Terrestrial Ecosystems, and to report on the Convention on Biological Diversity targets on rates of natural habitat loss.
Keywords: conservation planning; habitat loss; intensity analysis; legislation; satellite imagery
Introduction
Land-cover change and habitat loss are widely recognised as the major drivers of biodiversity loss in the world.1-3 These changes not only fragment the landscape but alter biogeochemical cycles, climate, ecosystem processes and ecosystem resilience, thereby changing the nature of ecosystem services provision and human dependancies.4-6 These losses and changes pose significant challenges for meeting biodiversity conservation goals and targets.
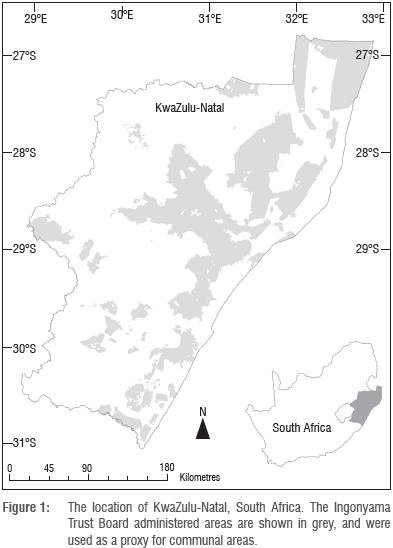
KwaZulu-Natal (KZN), a province situated on the eastern seaboard of South Africa, has a complex landscape, both in terms of its physical and biological diversity,7 and the varied use and ownership of the landscape. The KZN landscape ranges from mountain climes of the Drakensberg escarpment of over 3000 m in the west to the subtropical climes of the Indian Ocean in the east (Figure 1) in an area of 93 307 km2. KZN is the wettest of South Africa's provinces with a mean annual precipitation of 837 mm.8 Consequently, agriculture - consisting primarily of sugar cane, orchards, commercial and subsistence crops, and timber plantations (agro-forestry) - represents major features of the landscape. The species-rich natural vegetation consists of mesic grasslands, savannas, forests and wetlands, and contains portions of the Maputaland-Pondoland-Albany biodiversity hotspot and the Midlands, Maputaland, Pondoland and Drakensberg Alpine centres of endemism.9
KwaZulu-Natal is the second most populous province in the country10 with a mid-year population estimate of approximately 10.8 million people in 201111 (0.9 people per hectare). The province is experiencing a loss of natural habitat,12 which has profound ecological consequences for this species-rich area. Similarly, the loss of natural capital and environmental degradation has socio-economic consequences for the many, mainly rural, inhabitants reliant on natural resources for fuel, fibre, food and medicine.13 Many rural communities live on communally owned land, for which the drivers of change may differ from those on privately or state-owned land. It is thus important to quantify and understand the processes driving land-use and land-cover change (LULCC) in the province, and across different land tenure systems.
The availability of remotely sensed imagery has facilitated the monitoring of LULCC worldwide. In South Africa, two national land-cover (NLC) maps have been developed from satellite imagery based on circa 1994 (NLC 94)14 and 2000 (NLC 2000)15 conditions, but they are not directly comparable. Ezemvelo KZN Wildlife, the provincial conservation authority, has facilitated the development of three KZN land-cover maps based on 2005,16,17 200818,19 and 201 120,21 conditions as part of its biodiversity monitoring mandate. These provincial data sets are valuable because they were developed using similar methodology, have similar legend categories and are mapped at the same resolution (20 m), making temporal comparisons more precise than less standardised land-cover maps. This series of five land-cover maps offers a valuable long-term period of 17 years within which to analyse land-cover change and rates of habitat loss within the province.
Understanding the patterns, processes and impacts of LULCC is essential in order to plan effectively for biodiversity conservation, especially in the face of other agents of global change such as climate.22 Common methods of analysing land-cover change involve computing transition matrices between two points in time.23 However, this method does not adequately account for category persistence, which tends to dominate the landscape. Failure to account for category persistence may mask important signals of land change.24 The static state of the landscape between two time periods means that the signal of change is small in light of the overwhelming signal of persistence. Similarly, a lack of net change in a traditional analysis does not necessarily mean a lack of change on the landscape, because there could be location changes or swapping among categories. Thus an analysis that considers transitions of categories in terms of gains, losses, net change and swapping is insightful about patterns and processes of landscape change. Pontius et al.24 developed a framework to account for these deficiencies. Further improvements to this method of analysis were developed in the Intensity Analysis framework23 which was designed to analyse several points in time for the same study area. For each time interval, the method investigates the extent and speed of change and categorical gains and losses, whilst specifically considering the size and intensity of those changes and determining the intensity and variation of landcover transitions from the categories available for the transitions. The framework thus identifies the underlying processes of the landscape transformations.
Given the complex nature of KZN, it is essential to understand the drivers, patterns and processes of change for biodiversity conservation as the nature of the changes will have different management and policy implications. Using a quantitative method that addresses known inadequacies of conventional LULCC analyses and specifically assists in identifying the underlying processes of landscape change, and using the unique land-cover data set now available, should markedly improve our understanding of LULCC in KZN for conservation planning. Consequently, we have used the Intensity Analysis framework to characterise the systematic land-cover changes occurring in KZN using the three provincial land-cover maps (2005, 2008 and 2011). Differences in the pattern, rates and intensities of change are compared between land tenure systems (communal versus private and state-owned areas). In addition, the extent and rate of natural habitat loss are determined (from 1994 to 2011).
Methods
Communally owned lands
The historical legacy of the country has created three major land tenure systems in the province: communal, private and state-owned properties. The Ingonyama Trust was established in 1994 (KwaZulu Ingonyama Trust Act No. 3 of 1994) to hold land in title for members of communities in the province. The Ingonyama Trust Board (KwaZulu-Natal Ingonyama Trust Amendment Act No. 9 of 1997) administers the affairs of the Trust and the trust land and oversees the development of approximately 2.8 million hectares of communally owned land. The Ingonyama Trust Board (ITB) jurisdictional area was used as a proxy for communally owned land. Land-cover change differences were investigated between the ITB areas and the other land tenure systems (non-ITB).
Land-cover maps
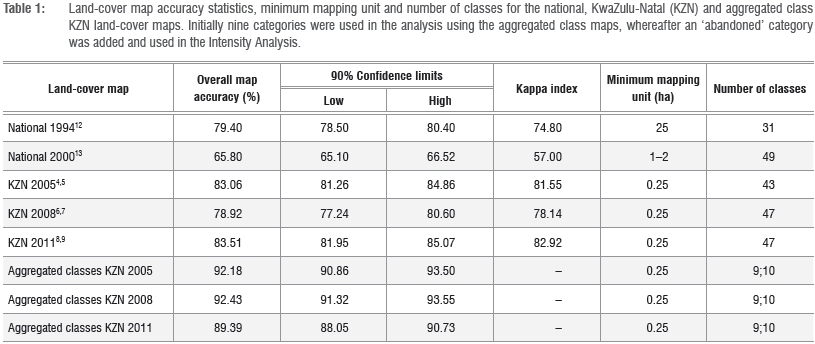
Five land-cover maps were used in the analysis of land-cover change (Table 1). The details of methods used to develop these maps are dealt with in their associated documentation.1416,18,20 The methods in brief are as follows:
- The 1994 land-cover map was manually digitised from hard copy Landsat Thematic Mapper imagery based on 1994-1995 conditions, at a 1:250 000 scale but incorporating smaller features wherever feasible.14
- The 2000 land-cover map was classified from multi-temporal Landsat 7 Enhanced Thematic Mapper imagery based on 2000-2003 conditions, although KZN formed part of phase 1 which used the earlier dated imagery.15
- The 2005 KZN land-cover map was developed from SPOT 2/4 imagery.16,17 Certain post-classification modifications were made to improve the map, including the use of externally sourced data and expert edits.
- The 200818,19 and 201120,21 KZN land-cover maps were developed from SPOT 5 imagery. These maps represented temporal updates to the 2005 land-cover map.
The map accuracies ranged from 65.8% for the NLC 2000 to 83.5% for the provincial 2011 land-cover map (Table 1). Aggregating the classes of the provincial maps used for the change analysis significantly improved the map accuracies - up to 92.43% for the aggregated 2008 KZN land-cover map. The Kappa index for the provincial maps was high with the strength of classification agreements deemed 'substantial' and 'almost perfect' as per accepted benchmarks.25 The aggregation of all five maps into only two categories for the long-term rate of habitat loss analysis would similarly significantly improve the accuracy statistics. Thus confidence was placed in accurately detecting change rather than error in this analysis. The imagery used to develop the provincial land-cover maps was provided as part of the South Africa Government/ SANSA/SPOT IMAGE Agreement to supply annual SPOT imagery for the country.26
Data analysis
Detailed provincial analysis 2005-2011
The three provincial maps were analysed for land-cover change between 2005 and 2011 using IDRISI Selva.27 The maps excluded the highly dynamic coastal sand and rock category and were standardised to the 2008 vegetation extent of the seashore line. The provincial boundary for this analysis includes the currently disputed Matatiele region in the southwest which is currently administered by the Eastern Cape but which was previously administered by KZN, and is included here for planning purposes only. Minor corrections were made to known dam and mine category errors. The maps were reclassified into 9 aggregated categories (Table 2; Supplementary figure 1 online) from the initial 43-47 land-cover categories and the associated aggregated accuracy statistics calculated from the accuracy assessment contingency tables (Table 3). The users' accuracy exceeded 91% in almost all cases, but some categories had lower statistics in specific years. Aggregation of the categories served to improve the accuracy of the maps by eliminating errors among the more detailed land-cover categories (Table 1).

Based on initial analyses that detected changes, swapping and persistence24 of categories in the landscape, an additional 'abandoned' category was created that specifically tracked changes of non-natural vegetation classes back into a semi-natural state at a future time point. It is imperative for conservation planning that these changes be tracked as this category does not hold the same biodiversity value as primary natural vegetation. Hence 10 categories were used in the Intensity Analysis.
The land-cover changes were examined using the modified transition (cross-tabulation) matrix and the hierarchical Intensity Analysis framework which uses statistical methods to identify the most important transitions and the signals of systematic processes related to the patterns of land change.23,24 The relevant papers detail the methods used, hence they are not repeated in this paper but the equations and notation used are provided in the online supplementary material for ease of reference. These matrices were used to calculate the extent of gains, losses and swapping between categories. The Intensity Analysis considers the size of the category concerned and analyses the data at three levels of analysis, namely time interval, category gains and losses and transition intensities across available categories. The interval analysis determines the annual rate of change compared with a uniform change level across the temporal period of the analysis, and may be classed as slow or fast in comparison to the uniform change level. The category analysis investigates each time interval's intensities of gains and losses per category and the categorical changes can be classed as dormant or active changes in comparison with the uniform intensity level. The transition analysis investigates transitions between particular gaining and correspondingly losing categories and vice versa to examine how the size and intensity of the transition varies. The transitions can be classed as targeted or avoided by comparing the observed intensity of each transition with a uniform intensity level.
Longer-term analysis of the rates of habitat loss
In addition to the provincial maps, the earlier national land-cover maps were used to investigate the amounts and rates of habitat transformation since 1994. In order to render the legend categories congruent, two categories were created across all five land-cover maps, namely untransformed (natural features and vegetation) and transformed (anthropogenically altered landscapes such as built infrastructure, cropland, plantations, mining and dams). Once an area had become transformed it was not permitted to become a natural category again at a future time point, effectively excluding the 'abandoned' category and thereby identifying primary natural areas best suited for biodiversity conservation. Data was resampled to a 500-m pixel size associated with the minimum mapping unit of 25 ha of the NLC 94, the coarsest level of mapping detail. A logarithmic regression curve was fitted to the temporal sequence of estimated remaining natural habitat in an attempt to best describe past pattern, and forecast the most likely state in 2050.
Results
Detailed provincial analysis 2005-2011
The percentage landscape change in KZN was 7.74% between 2005 and 2008, but slowed to 2.69% between 2008 and 2011 (Table 4, Figure 2). The greatest losses occurred in natural vegetation with a net loss of 721 733 ha (7.6%) since 2005. The greatest gains were made by agriculture with a net gain of 496 152 ha (5.2%) over the analysis period. Natural vegetation and agriculture were involved in the largest changes in the landscape in part because they accounted for a large part of the landscape. Importantly the agriculture and natural vegetation categories displayed high levels of swapping in the landscape (1.28% and 0.99%, respectively, between 2005 and 2008), i.e. changing to or from various categories over time. Commercial agriculture increased from 7.7% to 9.0% of KZN, driven primarily by dryland cropping, whilst subsistence agriculture increased from 3.3% to 7.4% in extent over the analysis period. The built environment had a net gain of 111 485 ha (1.2%) followed by plantations with 46 157 ha (0.5%).

Between 2005 and 2008 agriculture gained the most, followed by the built environment and plantations. Similarly, in the second time period (2008-2011), the major gains were made by agriculture and the built environment, but the gain in plantations slowed significantly. The natural vegetation category always showed the greatest losses. Figures 3 and 4 depict the annual size of the gain or loss, respectively, of a category on the left-hand side of the graph whilst the right-hand side indicates the intensity of the category gain and loss percentages relative to uniform change intensity across the landscape in general across the analysis period. Examining the intensity of the category gains and losses, which also considers the size of the category concerned, reveals that dams, mines and erosion were actively gaining categories in both time periods. The number of dams in the province increased from approximately 14 455 in 2005 to over 20 980 in 2011, representing a 45% increase in the number and a 26% increase in the extent of dams. Mining extent increased by 90% and erosion by 44%. In terms of losses, plantations was consistently a dormant category. The water and sand/rock categories were dynamic in nature.


Examination of the category transitions (Supplementary tables 2 and 3) reveals the abandoned category targeted agriculture, mines, built and dynamic natural categories such as erosion, sand and water. Agriculture targeted natural vegetation and erosion initially, but thereafter the abandoned, water, built and mine categories. The built areas targeted agricultural areas, but despite claiming an average of 7247 ha per annum of natural vegetation, cannot be said to have actively targeted this category, because of the large size and relative persistence of natural vegetation in the landscape. Erosion consistently targeted natural and abandoned vegetation and mines. Dams consistently targeted water, mines and erosion. Mines targeted natural and abandoned vegetation and dams.
The patterns of change in the communal (ITB) and non-communal (non-ITB) areas of the province followed similar patterns to those of KZN in that the rate of change slowed significantly in the second time period for both land tenure areas (Supplementary figures 2-7). A greater portion of the landscape changed in the ITB areas (10.84% and 3.41%) than in the non-ITB areas (6.45% and 2.39%) for both the first and second time periods, respectively. The major landscape differences between the ITB and non-ITB areas were that the communal areas practised a far greater degree of subsistence agriculture than commercial agriculture (30:1 versus 1:3 in non-ITB areas in 2008 with an increasing trend of subsistence agriculture). The ITB areas had a threefold higher proportion of low density settlements than high density settlements compared with non-ITB areas and the proportion of degraded natural vegetation was 50% higher in ITB areas than in non-ITB areas. The rate of increase in the built category was similar for both land tenure areas.
The ITB areas consistently gained in the abandoned, mining, agriculture, erosion and plantation categories, and the major losses stemmed from natural vegetation. The amount of swapping in the ITB landscape was 1.06% and 1.11%, respectively, in the first and second time periods. The non-ITB areas consistently gained in the agriculture, abandoned, built, dams, mining and erosion categories, and major losses stemmed from natural vegetation. The amount of swapping in the non-ITB landscape was 1.26% and 0.74%, respectively, in the first and second time periods.
Longer-term analysis of the extents and rates of habitat loss
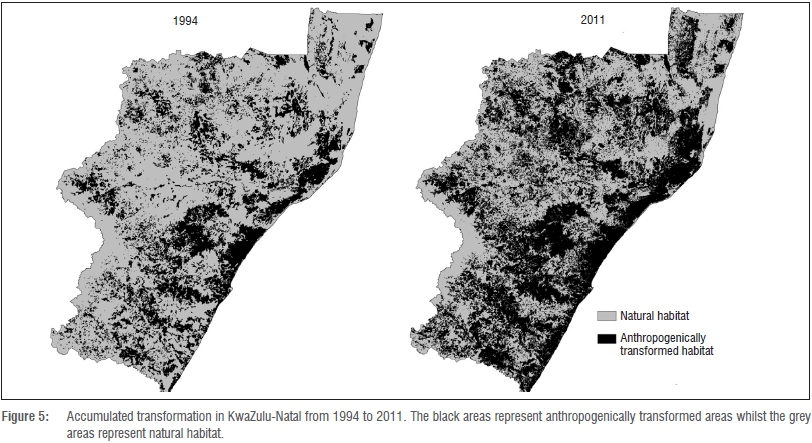
In 1994, 73% of KZN was in a natural state. By 2011 this portion had decreased to 53% (Figure 5). The annual change percentage of the landscape decreased in each successive time period: 1.88% for 1994-2000, 1.05% for 2000-2005, 0.82% for 2005-2008 and 0.24% for 2008-2011. The average rate of habitat loss was 1.2% per annum between 1994 and 2011. A logarithmic regression function fitted the data well (adjusted β2=0.98). Assuming habitat transformation continues in the same manner, it is estimated that by 2050, 45% of the landscape will remain in a natural state (Figure 6). Initially, the ITB areas had relatively more natural habitat than non-ITB areas; however, given the higher rate of change in the ITB areas, they are predicted to have less natural habitat remaining by 2050 than non-ITB areas.

Discussion
Biodiversity implications of land-cover changes Landscape changes
The main drivers of change in the landscape were agriculture, timber plantations, built environments, mines and dams. Apart from the direct loss of natural habitat, these land covers all pose additional negative impacts for biodiversity remaining in these or surrounding areas. These effects may be direct (e.g. loss of habitat or extraction of water), indirect (e.g. pollution transported downstream), induced (e.g. associated industries and settlement) or cumulative (e.g. collective impacts on water quality and quantity).28
Land-cover change dynamics differed between ITB and non-ITB areas. The communal areas of the province experienced a proportionately greater degree of landscape change and development than private and state-owned areas. The ITB areas are predicted to have less natural habitat remaining than non-ITB areas in future which is problematic in that these communities rely heavily on natural resource use. Given the reliance on natural resources, the opportunity exists to promote the use of indigenous food and medicinal crops, which would benefit both biodiversity and lower the dependence on expensive agricultural inputs such as fertilisers. Low density settlement actively increased in ITB areas, posing challenges for service provision. Plantations actively increased in these areas compared with those in privately owned areas. There was a proportionally greater increase in the number of dams in the privately owned areas of the province.
Extensive land-use swapping occurred in the landscape, in particular between the agricultural and natural categories. Likely reasons for this swapping include agricultural field rotation common in subsistence farming and the abandonment of lands because of urbanisation, farm security issues, soil nutrient depletion, agricultural pests and diseases, invasive alien plants and economic factors. The transition analysis elucidated interesting change dynamics in the landscape, including, for example, swapping from built environments back to a natural environment, which is initially counter-intuitive. However, for diverse reasons, dwellings are often abandoned or become vandalised to the extent that vegetation overgrows the building foundations and it appears natural in later satellite images (Supplementary figures 8-22).
Agriculture
The average cultivated area per person in South Africa in 1960 was approximately 0.55 ha but this figure decreased to 0.3 ha by 1993.29 In KZN in 2011, the commercial and subsistence agriculture equated to 0.14 ha per person, representing a significant decline over time despite a significant increase in agricultural extent. Increasing human populations will lower this ratio. Higher yields are possible from improved cultivars, irrigation, pesticide, herbicide and fertiliser use,30 which may explain the smaller area required per person, but these inputs have negative impacts for biodiversity.
Agricultural expansion was pronounced prior to the 1960s. Policy instruments such as agricultural subsidies and minimum selling prices, were thought to have encouraged cultivation on marginal lands29 which were later abandoned when subsidies were withdrawn. These old cultivated lands are still evident in the province but they are declining in extent, reverting primarily to agricultural use, in particular to subsistence and dryland cropping. However, these marginal areas are more prone to crop failure. The old croplands have altered soil structure, organic matter content and differing soil nutrient levels31 and lack the full complement of native species, especially geophytic plants and those plants which rely on soil mycorrhizal associations, for example terrestrial orchids. It is not known how long it takes previously cultivated fields to return to a compositionally complete rangeland equivalent to primary rangelands, but it is estimated to be in excess of several decades.32 This topic is worthy of further research.
Plantations
Timber plantations occur primarily in the grassland and Indian Ocean Coastal Belt biomes. The extent of plantations has not increased significantly with a 46 000 ha increase in the first time period and a stabilisation in the second time period. The slowdown in the expansion of timber plantations in the second time period is most likely as a result of a reduction in the allocation of licences from the Department of Water Affairs and Forestry in terms of the National Water Act No. 36 of 1998, or because of economic factors associated with the industry. Indeed, certain catchments have been closed to new applications and a moratorium has been placed on others, pending further investigations on associated run-off reductions (Thambu D 2014, written communication, August 7). Plantations create acidic soils and an increase in available nitrate,33 a situation for which many indigenous plant species are not adapted. Shading effects may promote shade-loving or forest species, but these species will be lost during rotational harvesting practices.34
Built environment
The built environment increased by 1.2% in KZN between 2005 and 2011. In particular there was an increase of the built environment in rural areas. Much of the province's biodiversity resides outside of protected areas in the rural landscape. Hence expansion in these areas poses threats for the remaining biodiversity. Sprawling urbanisation should be contained by the encouragement of higher-density settlements and the definition of an urban edge. An increase in the number of roads in rural areas is promoting development in remote areas, facilitating greater natural resource extraction and enhancing landscape fragmentation effects. Development in these areas reduces the opportunity for conserving large open spaces - which is one of the criteria used in protected area expansion plans.
Hydrological implications
The massive increase in the number of dams in the province is of significant concern for aquatic biodiversity and river health. The cumulative impacts of small dams reduces discharge, increases dissolved salts and alters macro-invertebrate indices.35 Flow levels are reduced during dry periods, which causes hydromorphic grasslands to dry out and large trees to die back.36 Larger dams and inter-basin transfer schemes significantly alter flow regimes and may lead to a dominance of livestock pest species.37 Water extraction and pollution further negatively impact the ecosystem services that rivers and wetlands provide.
Mining
Mining extent almost doubled during the analysis period. The dominant form of mining affecting the change dynamics in the landscape is dune mining of titanium, iron, rutile and zircon, which occurs along the coast. The mobile nature of this form of mining creates a 'snail-trail' along the dune corridors with associated erosion, dam and abandoned category swapping. Mining impacts biodiversity principally via habitat loss, the alteration of ecological processes, pollution and the introduction of alien invasive species.28
Soil conservation
The extent of erosion is increasing in the province and creating degraded landscapes. Differing land-use practices may alter soil chemical and physical properties.33 Ploughing, heavy grazing and burning deplete soil organic matter which affects soil water infiltration, retention and nutrient supply.38 Dryland cropping, which is increasing in KZN, results in significant losses of soil organic matter. Lower soil organic matter results in lower water stable aggregates which are required to prevent soil erosion.39 Future climate predictions suggest greater intensity of rainfall events and longer intervals between events.40 Concomitant with the steep topography of KZN, soil erosion is thus likely to be exacerbated. Soil erosion has implications for biodiversity conservation, food security, soil conservation and water quality in terms of sedimentation and suspended sediment concentrations. Initiatives to prevent further soil erosion and degradation of natural vegetation are urgently required.
The implications of habitat loss Extents and thresholds of habitat loss
This study highlighted the extensive loss of natural habitat occurring in the province, a massive 7.6% in only 6 years, which is of concern for biodiversity conservation and raises the question of whether this level of habitat loss is sustainable. At a national level the extent of transformed land in 2005 was 15.7%.41 In KZN the picture is entirely different with 43% of land transformed in 2005, increasing to 46.4% by 2011. The changes in land cover, loss of habitat and the resulting fragmentation of the landscape have resulted in the loss of biodiversity and species population declines.42 These losses will continue as more of the landscape is transformed by anthropogenic use as habitat is a finite resource, thus conservation efforts should focus on habitat preservation. As more natural habitat is lost, the opportunity costs associated with adding to the protected area estate increase. Certain areas in the landscape are unlikely to be transformed from their natural state because of, for instance, steep topography, protected areas or legislated development exclusion areas. Thus protected area expansion should focus on the areas most likely to experience a change to an anthropogenic category.
Flather and Bevers43 identified a persistence threshold that exists once natural habitat is reduced below 50% of the total landscape for low degrees of patch aggregation. Beyond this level of transformation there is a rapid decline in the probability of landscapes supporting viable populations of organisms and a decline in habitat connectivity. The amount of natural habitat remaining in KZN is rapidly approaching this threshold. A target of no more than 50% of habit loss should be adopted to adequately conserve biodiversity in the province. Loss of habitat leads to a loss of ecological resilience and habitat specialist species.44 This loss is of particular concern in this species-rich province and in the face of climate change for which ecological resilience is of paramount importance. A fragmentation threshold exists once 20-30% of natural habitat remains, whereafter the spatial configuration of habitat patches becomes important for maintaining population persistence.
Transformation of the landscape is creating 'islands' of protected areas in a matrix of anthropogenically transformed areas. This transformation is despite the province having good systematic conservation plans and data, which demonstrate that much of the biodiversity resides outside of protected areas. This situation calls into question the effectiveness of current conservation strategies and processes related to environmental authorisations. In light of extensive calls for further development in the province, a major rethink is required in order to determine how this development should be implemented. Effective management of the matrix is critical for the persistence of a vast majority of species that utilise these areas for breeding, foraging or migration.45 New efforts to mainstream biodiversity into various land-use sectors are to be encouraged and supported.46
The science-policy interface
The Convention on Biological Diversity, to which South Africa is a signatory, has a target of halving (or where feasible bringing close to zero) by 2020, the rate of loss of natural habitat and significantly reducing degradation and fragmentation. The rates of habitat loss have declined in the province, but, given the recent global economic recession, caution needs to be exercised in interpreting the slowing rates as an achievement towards this target. Drivers such as changes in the economy, legislation, technological advances or even social resistance are likely to alter the rate of habitat transformation.
Some of the criteria used in the identification of Threatened Terrestrial Ecosystems (according to the National Environmental Management:
Biodiversity Act No. 10 of 2004 and the National List of Ecosystems that are Threatened and in Need of Protection Act No. 1002 of 2011) are incomplete because of data constraints. Specifically, criteria B - which examines the rate of loss of natural habitat - is not defined. Our data set and method of analysis provides the first provincial assessment of the rate of loss of natural habitat, and together with the Convention on Biological Diversity targets, could be used to fulfil this criterion of the legislation.
The main drivers of land-cover change are human responses to economic opportunities which are mediated by institutional factors.6 Markets and policies constrain or encourage land-use change. Thus it is essential that decision- and policymakers are cognisant of the full implications that decisions and policy development may have on the rates of habitat loss. It is critical that a longer-term decision and planning framework, that is cognisant of constitutional and international agreements, be adopted. It is essential that conservation officials actively lead the way in biodiversity conservation, as stated eloquently by Noss et al.47:
The pro-growth norms of global society foster timidity among conservation professionals, steering them toward conformity with the global economic agenda and away from acknowledging what is ultimately needed to sustain life on Earth.
Conclusions
The development of three directly comparable land-cover maps by Ezemvelo KZN Wildlife has permitted the first time-series analysis of LULCC in the province. The analysis elucidated the drivers, patterns and processes of land-cover change in KZN. The Intensity Analysis framework explicitly revealed change dynamics that other LULCC approaches would not have been able to do, by examining change at different levels of detail and considering category sizes and intensity of changes. This framework allowed a deeper understanding of systematic transitions in the province.
The challenge of conserving biodiversity in KZN is becoming increasingly difficult because natural habitat continues to be lost and the associated negative impacts and habitat degradation related to the identified landcover drivers further threaten biodiversity. The provincial trends in habitat loss unfortunately follow global trends, but should this province, and South Africa, wish to lead the way in biodiversity conservation, some very important and difficult policy and legislative decisions need to be made now.
Acknowledgements
We are grateful to the anonymous reviewers for their valuable comments and suggestions. Ezemvelo KZN Wildlife is thanked for providing a study bursary. B.F.N.E. is supported by Exxaro. B. Naidoo and H. Snyman are thanked for their assistance with the graphs and maps, and J. Craigie and G. Nanni are thanked for their assistance with the accuracy assessment flights.
Authors' contributions
D.J. was the project leader, researcher and wrote the manuscript; P.S.G., B.F.N.E., T.G.O.C. and E.T.F.W. made conceptual and editorial contributions.
References
1. Vitousek PM. Beyond global warming: Ecology and global change. Ecology. 1994;75(7):1861-1876. http://dx.doi.org/10.2307/1941591 [ Links ]
2. Millenium Ecosystem Assessment. Ecosystems and human well-being: Biodiversity synthesis. Washington DC: World Resources Institute; 2005. [ Links ]
3. Jetz W, Wilcove DS, Dobson AP. Projected impacts of climate and land-use change on the global diversity of birds. PLoS Biol. 2007;5(6):1211-1219. http://dx.doi.org/10.1371/journal.pbio.0050157 [ Links ]
4. Verburg PH, Neumann K, Nol L. Challenges in using land use and land cover data for global change studies. Glob Chang Biol. 2011;17:974-989. http://dx.doi.org/10.1111/j.1365-2486.2010.02307.x [ Links ]
5. Chapin FS, Zavaleta ES, Eviner VT, Naylor RL, Vitousek PM, Reynolds HL, et al. Consequences of changing biodiversity. Nature. 2000;405:234-242. http://dx.doi.org/10.1038/35012241 [ Links ]
6. Lambin EF, Turner BL, Geist HJ, Agbola SB, Angelsen A, Bruce JW, et al. The causes of land-use and land-cover change: Moving beyond the myths. Glob Environ Change. 2001;11:261-269. http://dx.doi.org/10.1016/S0959-3780(01)00007-3 [ Links ]
7. Jewitt D, Goodman PS, O'Connor TG, Witkowski ETF. Floristic composition in relation to environmental gradients across KwaZulu-Natal, South Africa. Austral Ecol. 2015;40(3):287-299. http://dx.doi.org/10.1111/aec.12213 [ Links ]
8. Schulze RE, Lynch SD, Maharaj M. Annual precipitation. In: Schulze RE, editor. South African atlas of climatology and agrohydrology. Water Research Commission report 1489/1/06, Section 6.2. Pretoria: Water Research Commission; 2006. [ Links ]
9. Mucina L, Rutherford MC. The vegetation of South Africa, Lesotho and Swaziland. Pretoria: South African National Biodiversity Institute; 2006. [ Links ]
10. Statistics South Africa. Census 2011: Provinces at a glance. Report no. 03-0143. Pretoria: Statistics South Africa; 2012. [ Links ]
11. Statistics South Africa. Mid-year population estimates 2011. Statistical release P0302. Pretoria: Statistics South Africa; 2011. [ Links ]
12. Jewitt D. Land cover change in KwaZulu-Natal. Environment. 2012;10:12-13. [ Links ]
13. Shackleton CM, Shackleton SE, Cousins B. The role of land-based strategies in rural livelihoods: The contribution of arable production, animal husbandry and natural resource harvesting in communal areas in South Africa. Dev South Afr. 2001;18(5):581-604. http://dx.doi.org/10.1080/03768350120097441 [ Links ]
14. Fairbanks DHK, Thompson MW, Vink DE, Newby TS, Van den Berg HM, Everard DA. The South African land-cover characteristics database: A synopsis of the landscape. S Afr J Sci. 2000;96(2):69-82. [ Links ]
15. Van den Berg EC, Plarre C, Van den Berg HM, Thompson MW. The South African national land-cover 2000. Report no. GW/A/2008/86. Pretoria: Agricultural Research Council - Institute for Soil, Climate and Water; 2008 [unpublished report]. [ Links ]
16. GeoTerraImage. KZN Province land-cover mapping (from SPOT2/4 satellite imagery circa 2005-06): Data users report and metadata (version 2). Pietermaritzburg: Ezemvelo KZN Wildlife; 2008 [unpublished report]. [ Links ]
17. Ezemvelo KZN Wildlife. KwaZulu-Natal land cover 2005 v3.1 (clp_KZN_2005_ LC_v3_1_grid_w31.zip) [GIS coverage]. [ Links ] Pietermaritzburg: Biodiversity Conservation Planning Division, Ezemvelo KZN Wildlife; 2011.
18. GeoTerraImage. 2008 KZN Province land-cover mapping (from SPOT5 satellite imagery circa 2008): Data users report and metadata (version 1). Pietermaritzburg: Ezemvelo KZN Wildlife; 2010 [unpublished report]. [ Links ]
19. Ezemvelo KZN Wildlife. KwaZulu-Natal land cover 2008 v2 (clp_KZN_2008_ LC_v2_grid_w31.zip) [GIS coverage]. [ Links ] Pietermaritzburg: Biodiversity Research and Assessment, Ezemvelo KZN Wildlife; 2013.
20. Ezemvelo KZN Wildlife, GeoTerraImage. 2011 KZN Province land-cover mapping (from SPOT5 satellite imagery circa 2011): Data users report and metadata (version 1d). Pietermaritzburg: Ezemvelo KZN Wildlife; 2013 [unpublished report]. [ Links ]
21. Ezemvelo KZN Wildlife. KwaZulu-Natal land cover 2011 v1 (clp_KZN_2011_LC_v1_grid_w31.zip) [GIS coverage]. [ Links ] Pietermaritzburg: Biodiversity Research and Assessment, Ezemvelo KZN Wildlife; 2013.
22. Heller NE, Zavaleta ES. Biodiversity management in the face of climate change: A review of 22 years of recommendations. Biol Conserv. 2009;142:14-32. http://dx.doi.org/10.1016/j.biocon.2008.10.006 [ Links ]
23. Aldwaik SZ, Pontius RG. Intensity analysis to unify measurements of size and stationarity of land changes by interval, category, and transition. Landscape Urban Plan. 2012;106(1):103-114. http://dx.doi.org/10.1016/j.landurbplan.2012.02.010 [ Links ]
24. Pontius RG, Shusas E, McEachern M. Detecting important categorical land changes while accounting for persistence. Agric Ecosyst Environ. 2004;101:251-268. http://dx.doi.org/10.1016/j.agee.2003.09.008 [ Links ]
25. Landis JR, Koch GG. The measurement of observer agreement for categorical data. Biometrics. 1977;33(1):159-174. http://dx.doi.org/10.2307/2529310 [ Links ]
26. Van den Dool R. Exploring options for the national mosaic. PositionIT. 2011;(July):53-55. [ Links ]
27. Eastman JR. IDRISI Selva [computer program]. [ Links ] Worcester, MA: Clark University; 2012.
28. Mining and biodiversity guideline: Mainstreaming biodiversity into the mining sector. Pretoria: Department of Environmental Affairs, Department of Mineral Resources, Chamber of Mines, South African Mining and Biodiversity Forum, South African National Biodiversity Institute; 2013. [ Links ]
29. Biggs R, Scholes RJ. Land-cover changes in South Africa 1911-1993. S Afr J Sci. 2002;98:420-424. [ Links ]
30. Fresco LO. Some thoughts about the future of food and agriculture. S Afr J Sci. 2014;110(5/6), Art. #a0066, 2 pages. http://dx.doi.org/10.1590/sajs.2014/a0066 [ Links ]
31. Cramer V Hobbs R, Standish R. What's new about old fields? Land abandonment and ecosystem assembly. Trends Ecol Evol. 2008;23(2):104-112. http://dx.doi.org/10.1016/j.tree.2007.10.005 [ Links ]
32. Roux ER. Plant succession on Iron Age I sites at Melville Koppies (Johannesburg). S Afr J Sci. 1970;66:48-50. [ Links ]
33. Mills AJ, Fey MV. Declining soil quality in South Africa: Effects of land use on soil organic matter and surface crusting. S Afr J Sci. 2003;99:429-436. [ Links ]
34. O'Connor TG. Influence of land use on plant community composition and diversity in Highland Sourveld grassland in the southern Drakensberg, South Africa. J Appl Ecol. 2005;42:975-988. http://dx.doi.org/10.1111/j.1365-2664.2005.01065.x [ Links ]
35. Mantel SK, Hughes DA, Muller NWJ. Ecological impacts of small dams on South African rivers. Part 1: Drivers of change - Water quantity and quality. Water SA. 2010;36(3):351-360. [ Links ]
36. O'Connor TG. Effect of small catchment dams on downstream vegetation of a seasonal river in semi-arid African savannah. J Appl Ecol. 2001;38:1314-1325. http://dx.doi.org/10.1046/j.0021-8901.2001.00680.x [ Links ]
37. Mantel SK, Muller NWJ, Hughes DA. Ecological impacts of small dams on South African rivers. Part 2: Biotic response - Abundance and composition of macroinvertebrate communities. Water SA. 2010;36(3):361-370. [ Links ]
38. Du Preez CC, Van Huyssteen CW, Mnkeni PNS. Land use and soil organic matter in South Africa 1: A review on spatial variability and the influence of rangeland stock production. S Afr J Sci. 2011;107(5/6), Art. #354, 8 pages. http://dx.doi.org/10.4102/sajs.v107i5/6.354 [ Links ]
39. Du Preez CC, Van Huyssteen CW, Mnkeni PNS. Land use and soil organic matter in South Africa 2: A review on the influence of arable crop production. S Afr J Sci. 2011;107(5/6), Art. #358, 8 pages. http://dx.doi.org/10.4102/sajs.v107i5/6.358 [ Links ]
40. Intergovernmental Panel on Climate Change (IPCC). Summary for policymakers. In: Solomon S, Qin D, Manning M, Chen Z, Marquis M, Avery KB, et al, editors. Climate change 2007: The physical science basis. Contribution of Working Group I to the fourth assessment report of the Intergovernmental Panel on Climate Change. Cambridge/New York: Cambridge University Press; 2007. Available from: http://www.ipcc.ch/publications_and_data/publications_ipcc_fourth_assessment_report_wg1_report _the_physical_science_basis.htm [ Links ]
41. Schoeman F, Newby TS, Thompson MW, Van den Berg EC. South African national land-cover change map. S Afr J Geomatics. 2013;2:94-105. [ Links ]
42. O'Connor TG, Kuyler P. Impact of land use on the biodiversity integrity of the moist sub-biome of the grassland biome, South Africa. J Environ Manage. 2009;90:384-395. http://dx.doi.org/10.1016/j.jenvman.2007.10.012 [ Links ]
43. Flather CH, Bevers M. Patchy reaction-diffusion and population abundance: The relative importance of habitat amount and arrangement. Am Nat. 2002;159(1):40-56. http://dx.doi.org/10.1086/324120 [ Links ]
44. Pardini R, Bueno AdA, Gardener TA, Prado PI, Metzger JP. Beyond the Fragmentation Threshold Hypothesis: Regime shifts in biodiversity across fragmented landscapes. PLoS ONE. 2010;5(10):e13666. [ Links ]
45. Franklin JF, Lindenmayer DB. Importance of matrix habitats in maintaining biological diversity. Proc Natl Acad Sci USA. 2009;106(2):349-350. http://dx.doi.org/10.1073/pnas.0812016105 [ Links ]
46. Huntley BJ. Good news from the South: Biodiversity mainstreaming - A paradigm shift in conservation? S Afr J Sci. 2014;110(9/10), Art. #a0080, 4 pages. http://dx.doi.org/10.1590/sajs.2014/a0080 [ Links ]
47. Noss RF, Dobson AP, Baldwin R, Beier P, Davis CR, Dellasala DA, et al. Bolder thinking for conservation. Conserv Biol. 2012;26(1):1-4. http://dx.doi.org/10.1111/j.1523-1739.2011.01738.x [ Links ]
 Correspondence:
Debbie Jewitt
Biodiversity Research, Ezemvelo
KZN Wildlife, PO Box 13053,
Cascades 3202
South Africa
Email: debbie.Jewitt@kznwildlife.com
Received: 20 Jan. 2015
Revised: 31 Mar. 2015
Accepted: 25 Apr. 2015
Note: This article is supplemented with online only material.

