


Servicios Personalizados
Articulo
 Inglés (pdf)
 Articulo en XML
 Referencias del artículo
Indicadores

Links relacionados
-
 Citado por Google
 -
 Similares en Google
Compartir

 Permalink
South African Journal of Science
versión On-line ISSN 1996-7489
versión impresa ISSN 0038-2353
S. Afr. j. sci. vol.111 no.9-10 Pretoria sep./oct. 2015
http://dx.doi.org/10.17159/SAJS.2015/20140170
RESEARCH ARTICLE
Estimation and monitoring of aboveground carbon stocks using spatial technology
Adolph NyamugamaI, II; Vincent KakemboI
IDepartment of Geosciences, Nelson Mandela Metropolitan University, Port Elizabeth, South Africa
IIAgricultural Research Council - Institute for Soil, Water and Climate, Pretoria, South Africa
ABSTRACT
Monitoring temporal changes of aboveground carbon (AGC) stocks distribution in subtropical thicket is key to understanding the role of vegetation in carbon sequestration. The main objectives of this research paper were to model and quantify the temporal changes of AGC stocks between 1972 and 2010 in the Great Fish River Nature Reserve and its environs, Eastern Cape Province, South Africa. We used a method based on the integration of remote sensing and geographical information systems to estimate AGC stocks in a time series framework. A non-linear regression model was developed using Normalised Difference Vegetation Index values generated from SPOT 5 High Resolution Geometric satellite imagery of 2010 as an independent variable and AGC stock estimates from field plots as the dependent variable. The regression model was used to estimate AGC stocks from satellite imagery for 1972 (Landsat TM), 1982 (Landsat 4 TM), 1992 (Landsat 7 ETM), 2002 (Landsat ETM+) and 2010 (SPOT 5) satellite imagery. AGC stocks for the respective years were compared by means of change detection analysis at the subtropical thicket class level. The results showed a decline of AGC stocks in all the classes from 1972 to 2010. Degraded and transformed thicket classes had the highest AGC stock losses. The decline of AGC stocks was attributed to thicket transformation and degradation, which were attributed to anthropogenic activities.
Keywords: remote sensing; geographical information systems; GIS; subtropical thicket; model development
Introduction
The role of forests as a carbon source and sink has been widely explored. Recent studies have shown that forests store close to 289 919 t of carbon in trees and other vegetation.1 However, the rate of deforestation has become a subject of major concern for many scientists. The global forest deforestation rate has been approximated at -7317% per year between 2000 and 2005.1-3 Approximately 13 million ha of world forest was lost between 2000 and 2010,4 implying an increase in the amount of carbon dioxide into the atmosphere.1,5 Africa's forests are disappearing at a rate approximately four times more than that of the world average.6 A study by the United Nations Environment Programme (UNEP) conducted in 2006 estimated that 70%, 95% and 30% of forests in West Africa, East Africa and the Democratic Republic of Congo, respectively, would be decimated by 2040. Deforestation and forest degradation contribute to atmospheric greenhouse gas emissions through the combustion of forest biomass and decomposition of the remaining plant material.7
The average deforestation rate in the Southern African Development Community (SADC) region is about 0.6%. The main causes of deforestation are conversion of forest land to agriculture and uncontrolled veld fires.8 The subtropical thicket in the Eastern Cape Province of South Africa has suffered different levels of degradation, ranging from moderate to severe.9-11 Land use/cover change activities were singled out as the major causes of degradation of the subtropical thicket. Approximately 60% of the primary subtropical thicket vegetation biome of South Africa has been severely degraded.9,12 The disappearance of Portulacria afra thicket species has been observed in vast areas of the biome.12,13
Different methodological strategies have been employed to estimate aboveground carbon (AGC) stocks. Technological advancements have seen the introduction of remote sensing (RS) and geographical information system (GIS) techniques in this endeavour. It has been demonstrated that RS data in conjunction with ground information acquired at object level can help in the development of national and regional estimates of AGC stocks.14-16 Using RS data, it is possible to monitor terrestrial ecosystems at various temporal and spatial scales. This approach has been widely tested for land-cover mapping and forestry applications. Previous studies have also reviewed the application of RS data for qualitative change detection of deforestation through land use/cover classification and quantification of forest AGC stock changes.17-19
While regression models for AGC stock estimations have been explored, most work has been dedicated to developing models that extrapolate destructive harvest data points to large scales, based on proxies measured from the ground and RS.1,9,20,21 Different attributes are used for AGC stock estimation, depending on major factors such as climate and relief.22-24 Most AGC stock estimations have been performed on a broad scale without analysing specific local conditions. Only a few studies10,23,25,26 have attempted to account for variations in specific biomes. Many developed countries have at least one inventory of all their forest area that can be used as a baseline for further estimation. Conversely, very few developing countries have comprehensive national forest area inventories.24 Against the above background, in this study we sought to estimate the changes in AGC stocks in the Great Fish River Nature Reserve (GFRNR) and its environs from 1972 to 2010. Landsat satellite imagery archives date back to 1972, providing a benchmark for estimating changes in AGC stocks within the 38-year period. A nonlinear regression model was developed to estimate AGC stocks for this area using field plot AGC estimates and satellite imagery from 1972, 1982, 1992, 2002 and 2010.
The study area
The GFRNR, located in the Eastern Cape Province of South Africa (Figure 1), is divided into nature conservation areas which consist of three reserves: the Andries Vosloo Kudu Nature Reserve, the Double Drift Reserve and the Sam Knott Nature Reserve. Its environs include privately owned commercial farms and the highly populated communal villages of Glenmore, Tyefu, KwaNdlambe, Committee Drift, Chisira and Ncabasa. The study area is characterised by semi-arid conditions; both rainfall and temperature vary markedly with the seasons. The summer and winter season minimum and maximum temperatures range from 22 °C to 30 °C and -3 °C to 22 °C, respectively. While winters are dry, the mean annual rainfall of the area, which is about 450 mm, peaks in spring and autumn.25

Materials and methods
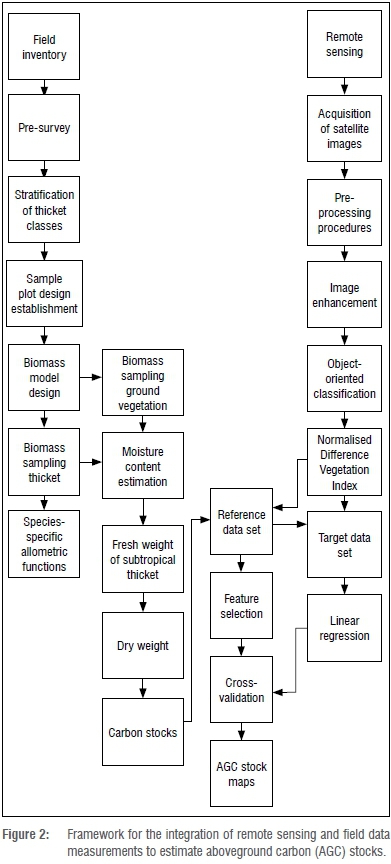
The methods - which entailed field surveys, image analysis, model development and quantifying AGC stocks - are illustrated in Figure 2. These procedures are described in the subsequent sub-sections.
Sampling design
According to the sampling design done prior to fieldwork, the study area was stratified into three subtropical thicket vegetation categories: intact, transformed and degraded thicket. This stratification was performed with the aid of a land use/cover map generated from the 2010 SPOT (HRG) imagery and was undertaken in order to obtain precise estimates of the subtropical thicket vegetation parameters. A large number of plots allowed for the measurement of the spatial variability of AGC stocks, increasing the confidence in AGC estimates. An optimum number of sample plots was selected using the formula below by Fuchs et al.20:

where M is the minimum number of samples required, x is the value associated with specified probability, CV is the coefficient of variance and AE is the allowed error.
During field surveys conducted in February and March 2010, 90 plots of 30 m x 30 m were randomly allocated to the intact, transformed and degraded thicket strata. One subplot of 1 m x 1 m was also randomly selected from each of the 30 m x 30 m plots. The total number of trees was recorded for each plot and coordinates were recorded using a centimetre level precision Ashtech® ProMark2™ Global Positioning System (GPS) receiver. Within 1 m x 1 m subplots, seedlings, herbaceous material and litter were collected, dried to a constant mass and converted from biomass to carbon (tonnes) using a 0.48 conversion ratio.13
Aboveground biomass and AGC estimation
Samples of dominant tree species or guilds were selected in the respective strata. The trees were measured for height, canopy and basal diameter. The dominant plant species in each stratum were sampled and parts of aboveground portions (branches) were harvested and dried in the oven at a constant temperature of 80 °C. The dry mass of the branches was plotted against their canopy diameters and a power function was used to estimate the dry mass of all trees measured in each plot based on their canopy and the formula by Mills and Cowling25 and Lu27.
The use of allometric regression equations has proven to be a reliable and non-destructive method to estimate AGC stocks. The development of allometric equations in this study was based on the subtropical thicket vegetation characteristics present in the study area in conjunction with the ones used by Skowno10, Patenaude et al.12 and Myeong et al.16 However, there are uncertainties associated with the use of allometric equations, such as the variation of vegetation at sites, soil type, climate, stand structure and genetic properties, which are associated with subtropical thicket vegetation. Therefore, in order to account for these uncertainties, only subtropical thicket vegetation guilds found in the study area were considered. A study by Lu27 revealed that the use of general allometric equations results in errors in tree measurements, sampling and representation of plots over large areas. The use of age, leaf area index and hyperspectral RS, which are outside the scope of this study, can be used to improve the estimation of AGC stocks in future studies.
Image processing
Subset images covering the study area were extracted from the respective sets of imagery. The satellite images acquired were captured on 20 November 1972 for Landsat MSS, 20 December 1982 for Landsat 4 TM, 15 December 1992 for Landsat TM, 1 December 2002 for Landsat 7 ETM and 25 December 2010 for SPOT 5 HRG. Clearly distinguishable spectral reflectance patterns of different vegetation surfaces were therefore identifiable, as all imagery sets were captured in the summer rainfall season. Other data sets such as aerial photographs, topographic maps and SPOT 5 at a 10-m resolution were acquired for accuracy assessments. Geometric and radiometric correction were required for reliable change detection analysis using satellite imagery. Orthorectification was used to correct different angles, which are typical of multi-temporal data sets and also to ensure that images overlay perfectly with other GIS data sets. Temporal imagery (Landsat MSS, 4 TM, 7 ETM+ and SPOT 5 HRG) data sets were geo-referenced to a 2-m SPOT mosaic and projected to the Universal Transverse Mercator (UTM) system using World Geodetic Systems, zone 11, 1984 datum. A 20-m digital elevation model was used to correct relief displacement caused by local topography. At least 30 ground control points, evenly distributed on each image, were used in the geo-referencing process.4
Radiometric and atmospheric correction of surface reflectance of the SPOT 5 and Landsat data were conducted using the dark object subtraction option. The equations used for this procedure21 are:
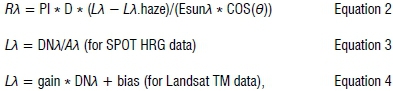
where Lλis the apparent at-satellite radiance for spectral band λ, DNλis the digital number for band λ, Aλis the calibration factor for spectral band λ of the HRG image, Rλis the calibrated reflectance Lλ.haze is path radiance, Esunλ is exo-atmospheric solar irradiance, D is the distance between earth and the sun and θ is the sun zenith angle.
Challenges encountered during the application of satellite imagery of different spatial resolution for change detection are outlined by Buyantuyev and Wu26. Studies done by Singh14 and Im et al.28 revealed that the post-classification approach minimises the problems caused by variation in sensors and atmospheric conditions, as well as vegetation phenology between different dates, because data from different dates are independently classified. Therefore, Landsat MSS, 4 TM, 7 ETM and SPOT 5 HRG images were independently portioned into image objects using Definiens Developer version 7 RS software.
Object-oriented classification
An object-oriented approach was used to independently segment the respective sets of imagery into three land-cover classes, namely intact, transformed and degraded. A fractal net evolution approach embedded in Definiens Developer 7 was used.15 The segments were merged based on their level of similarity. Layer weights, scale, shape factor and compactness were set to 1, 20, 0.3 and 0.5, respectively. These variables were determined by visual interpretation of the results of image segmentation, where objects were considered to be internally homogenous, such that all pixels within a primitive object belong to one cover class.29 Training sites were used for supervised classification in conjunction with the rule-based classification to classify each of the objects into one of the three land-cover classes.15,30,31,32 The post-classification comparison approach was applied to detect the land-cover change classes.15,29,31 The overall accuracies obtained were 0.91, 0.92, 0.88, 0.91 and 0.86 for the 1972, 1982, 1992, 2002 and 2010 imagery, respectively, signifying a high classification accuracy. The accuracy for 2010 SPOT imagery in particular was improved by linking training site GPS positions in the field to their corresponding positions on the satellite image.
Model development and validation
A non-linear relationship between carbon and the Normalised Difference Vegetation Index (NDVl) values was established to develop a regression model for AGC estimation from the 2010 SPOT 5 HRG image.19,33 The 2010 SPOT image was selected because fieldwork was conducted in 2010 as well, during the months that coincided with the December summer. In this case, the NDVI was used as the independent variable, while AGC was the dependent variable.
The model was validated using sets of data obtained from field sites. A total of 20 sets of AGC stock estimates from field plots were compared with AGC stocks predicted by the model from the satellite image. AGC stocks for the GFRNR and environs were independently estimated.
The root mean square error (RMSE) was used to check the accuracy of the model using the equation by Canty et al.18
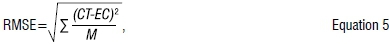
where RMSE is the root mean square error, CT is the carbon predicted by the model, EC is the estimated carbon and M is the number of observations.
The non-linear regression (quadratic) equation was chosen instead of a simple linear regression because it produced higher correlations: R2=0.975 for intact thicket, R2=0.812 for transformed thicket and R2=0.725 for degraded thicket. These values are comparable to the results obtained by Myeong et al.16, Hirata21, Buyantuyev and Wu26 and Lu27 who established allometric relationships between thicket trees using attributes such as crown cover area, basal area and height, while Chubey et al.31 established relationships between the crown and diameter, breast and height. It is noteworthy, however, that the natural conditions in which subtropical thicket vegetation grows do not follow linear relationships between diameter, crown area, basal area and height.34,35
Mapping AGC stock changes between 1972 and 2010
The validated non-linear regression model was used to map AGC stocks in subtropical classes for the entire study area in 2010. This model was also used to estimate and map the aboveground carbon stocks for the respective years. Mapping AGC stocks was then carried out for the three thicket classes (intact, transformed and degraded thicket). The nonlinear regression model used for AGC stocks estimation in the study area was:
AGC = 108.2e(NDVI10.0184), Equation 6
where AGC is the above ground carbon stocks (kg C/pixel) and NDVI is the SPOT NDVl value.19
After applying this model to estimate the AGC stocks, stock amounts were upscaled to t/ha.
Results
NDVI trends
The NDVI range for intact, transformed and degraded thicket between 1972 and 2010 is illustrated in Figure 3. A decreasing trend in the NDVl range for intact and degraded thicket is noticeable. The overall range for intact thicket declined from 0.53-0.77 to 0.38-0.62 between 1972 and 2010. This decline is particularly pronounced between 2002 and 2010. The range for degraded thicket also deteriorated from -0.05 - -0.04 in 1972 to -0.60 - -0.045 in 2010. These findings reflect tremendous changes in vegetation status, which have serious implications for AGC stocks, as explained in the subsequent sub-sections.
Model validation and AGC stock quantification
To validate the AGC stocks, model data sets obtained from the 90 field plots were plotted against the AGC stocks predicted from the imagery. A model validation result of ß2=0.960, which is quite significant at the 0.05 level, was obtained. This result implies a strong correlation between predicted AGC stocks and AGC stocks calculated in the field. The RMSE value of the model was 0.21, suggesting the model was highly accurate.
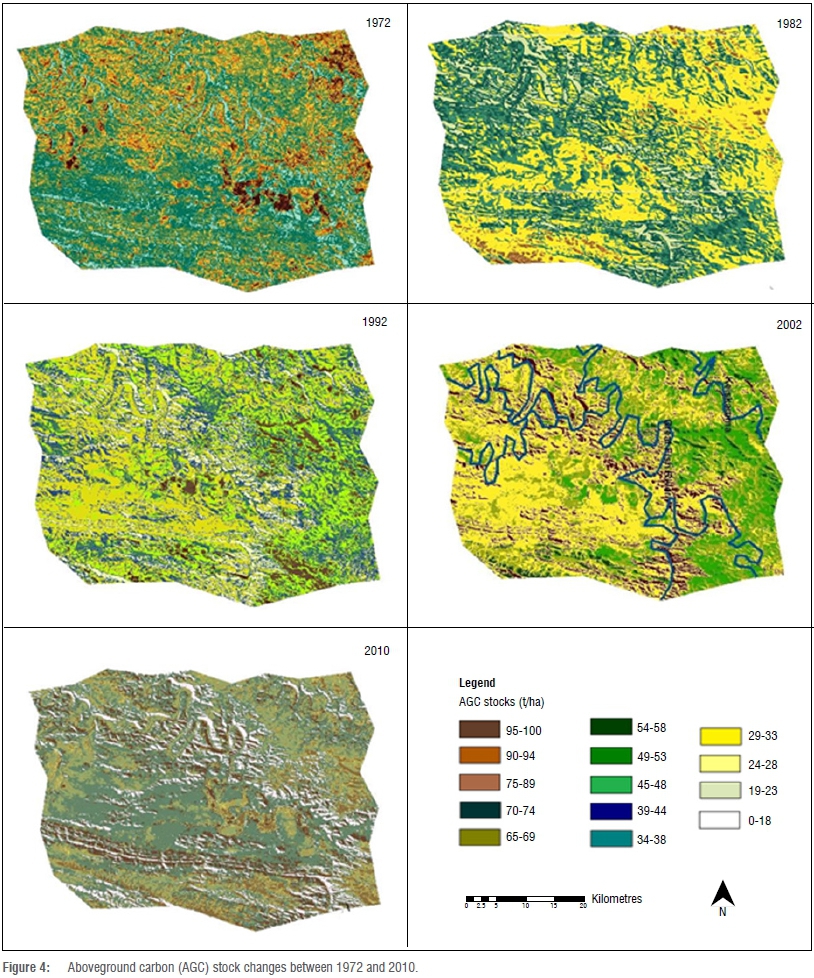
The validated non-linear regression model was applied to estimate the amount of AGC stocks for the entire study area, for the rest of the imagery sets. The models developed for the GFRNR and environs were used for the estimation, quantification and mapping of AGC stocks per class for the respective dates. Figure 4 illustrates the temporal changes of AGC stocks from 1972 to 2010 in the study area. AGC stock changes per subtropical thicket class in the GFRNR and environs are shown in Table 1.

Temporal changes of AGC stocks
Change in mean AGC stocks in tonnes between 1972 and 1982 illustrates that intact, transformed and degraded thicket classes decreased by 15 t/ha, 15 t/ha and 5 t/ha, respectively. The decreases were quite considerable for all the classes, as reflected by the percentage change (Table 1). It can be noted that intact and transformed thicket had the highest decrease in AGC stocks (15 t/ha each). Between 1982 and 1992, the decrease in mean AGC stocks for intact and degraded thicket
was tremendous, as indicated by 12.5% and 37%, respectively, while there was no change in transformed thicket stocks.
The period between 1992 and 2002 registered the lowest decrease in mean AGC stocks (Table 1). Conversely, mean AGC stock losses were highest between 2002 and 2010, coinciding with the pronounced decline in the NDVI range pointed out earlier. Overall, a high percentage of net mean AGC stock losses of 15 t/ha, 15 t/ha and 35 t/ha for intact, transformed and degraded thicket, respectively, was registered between 1972 and 2010.
Discussion
The object-oriented classification produced a classification of subtropical thicket vegetation classes, which enabled the accurate estimation of the area covered by each of the subtropical thicket classes.
The temporal changes that occurred within the subtropical thicket classes are a prerequisite for AGC stock change assessments.18,23 The temporal analysis of the stocks from 1972 to 2010 shows a drastically decreasing trend in the three subtropical thicket classes. Degraded and intact thicket had the highest AGC stock losses. There were high losses in AGC between 2002 and 2010 in all three thicket classes. The considerable thicket degradation processes taking place, particularly in the communal rangelands and villages, could explain the temporal losses in AGC stocks. Thicket degradation was noted to vary with land tenure systems.13 Communal lands are characterised by overgrazing and severe soil erosion forms related to land abandonment.
Rainfall trends between 1972 and 2010, analysed by Nyamugama35, reveal the oscillatory nature of precipitation in the study area. For instance, despite the fact that more precipitation was received in 2010 than in 2002, a considerable deterioration in thicket condition and reduction in AGC stocks was identified. This finding suggests that precipitation had little effect with regard to vegetation and AGC stock trends. By implication, anthropogenic factors could have played an overriding role in the deterioration of thicket and AGC stocks during this period.
The AGC stock estimates for 2010 are comparable with the estimates carried out by Mills et al.36 in the GFRNR and in the Sundays River spekboom37. These results are also comparable with the findings of Palmer et al.38 in Baviaanskloof Mega Reserve, South Africa, who observed that the intact subtropical thicket class had higher AGC stocks than the transformed and degraded thicket classes. By implication, thicket transformation and degradation trends as identified in the present study translate into enormous losses of AGC. The decline in the area under intact subtropical thicket has led to high losses of AGC stocks from 1972 to 2010. The implications of this decline for climate change are tremendous.
The main challenge encountered related to similarities in spectral signatures of subtropical thicket vegetation NDVI with some other vegetation surfaces. Therefore, extensive sampling was done in those areas in order to separate subtropical thicket vegetation classes on the 2010 SPOT image. The challenge was, however, greater with the Landsat MSS, TM and ETM images. Despite these challenges, the results obtained in this research are valid, as borne out by comparison with similar studies in other areas covered by subtropical thicket. A study by Copping et al.39 revealed the challenges encountered in longterm change detection, as a result of constraints related to vegetation phenology and variations in interannual vegetation productivity. Although the role of vegetation phenology variation is known, the postclassification techniques employed in this study compensated for the inter-date phenological variations, as each classification was done independently.32 Each classification was then used to characterise the land use/cover changes.15,16
Conclusions
The results of this study confirm that GIS and RS can be reliably used to model spatial and temporal changes in AGC stocks. It is possible to estimate, quantify and map AGC stocks over space and time, with changes in various subtropical thicket classes. A general decline in AGC stocks from 1972 to 2010 was identified in all the subtropical thicket classes. Degraded and transformed subtropical thicket classes had the highest losses, while the intact subtropical thicket class showed the lowest decline. The high losses of AGC stocks in subtropical thicket classes are attributed mainly to anthropogenic activities such as overgrazing, indiscriminate wood collection for fuel and other injudicious land-use practices. The results of this study can be used to retrospectively estimate AGC losses and thus carbon emissions in the past and to predict future scenarios. The methodology used in this study can be applied to estimate AGC stocks at national and regional levels, which can assist in carbon reporting for the country as per the Kyoto Protocol requirements. The average AGC stocks for each subtropical thicket class can therefore be applied to satellite-based subtropical vegetation maps to estimate regional subtropical thicket forest emissions.
Acknowledgements
We thank the National Research Foundation (South Africa) for funding this project and the South African National Space Agency for providing satellite imagery. We are also thankful to Mr N. Ndou, Mr B. Mazeka and Ms J. Smith for their assistance during fieldwork. We acknowledge the contributions of the anonymous reviewers, who added much value to the manuscript.
Authors' contributions
A.N. was the lead researcher, performed all the experiments and wrote the manuscript. V.K. gave technical input into the field research and the writing of the manuscript.
References
1. Food and Agriculture Organization (FAO). Global forest resources assessment. Report no. 163. Report published at Biennial Meeting of the FAO Committee on Forestry and World Forest. Rome: FAO; 2010. p. 22-30. [ Links ]
2. Gibbs HK, Brown SO, Niles J, Foley JA. Assessing and estimating tropical forest carbon stocks: Making REDD a reality. Environ Res Lett. 2007;2(4), Art.# 045023. http://dx.doi.org/10.1088/1748-9326/2/4/045023 [ Links ]
3. Intergovernmental Panel on Climate Change. Expert meeting on detection and attribution related to anthropogenic climate change. Report no. 94. Cambridge: Cambridge University Press; 2007. p. 540-560. [ Links ]
4. Gibbs HK, Brown S. Geographical distribution of woody biomass carbon stocks in tropical Africa. Oak Ridge, TN: Carbon Dioxide Information Center, Oak Ridge National Laboratory; 2007. [ Links ]
5. Fearnside PM, Laurance WF. Tropical deforestation and greenhouse-gas emissions. Manaus: National Institute for Research in the Amazon (INPA); 2004. p. 129-150. [ Links ]
6. Gibbs HK, Brown S, Niles JO, Foley JA. Monitoring and estimating tropical forest carbon stocks: Making REDD a reality. Environ Res Lett. 2007;2(4), Art. #045023. http://dx.doi.org/10.1088/1748-9326/2/4/045023 [ Links ]
7. Ramankutty N, Gibbs HK, Achard F, DeFries R, Foley JA, Houghton RA. Challenges to estimating carbon emissions from tropical deforestation. Glob Change Biol. 2007;13:51-66. http://dx.doi.org/10.1111/j.1365-2486.2006.01272.x [ Links ]
8. Houghton JT, Ding Y Griggs DG, Noguer M, Van der Linden PJ, Dai X, et al., editors. Climate change: The scientific basis. Contribution of Working Group I to the third assessment report of the Intergovernmental Panel on Climate Change. Cambridge: Cambridge University Press; 2001. http://dx.doi.org/10.4337/9781781950715.00018 [ Links ]
9. Lechemere-Oertel RG, Kerley GIH, Cowling R. Patterns and implications of transformation in semi-arid succulent thicket, South Africa. J Arid Environ. 2005;62:459-174. http://dx.doi.org/10.1016/j.jaridenv.2004.11.016 [ Links ]
10. Skowno AL. Indirect biomass estimation in subtropical thicket vegetation in the Eastern Cape Province, South Africa. Report for the conservation farming project. Cape Town: National Botanical Institute; 2003. p. 25-30. [ Links ]
11. Volk JHJ, Euston-Brown DIW. The patterns within and ecological processes that sustain the subtropical thicket vegetation in the planning domain of the subtropical thicket ecosystem planning (STEP) project. Report no 40. Port Elizabeth: Terrestrial Ecology Research Unit, University of Port Elizabeth; 2002. p. 20-10. [ Links ]
12. Patenaude G, Milne R, Dawnson PT. Review synthesis of remote sensing approaches for forest carbon estimation reporting to the Kyoto Protocol. J Environ Sci Policy. 2005; 8:161-178. http://dx.doi.org/10.1016/j.envsci.2004.12.010 [ Links ]
13. Zhou W, Huang G, Troy A, Cadenarzo L. Object-based land cover classification of shaded areas in high spatial resolution imagery of urban areas a comparison study. Remote Sens environ. 2009;8:1769-1777. http://dx.doi.org/10.1016/j.rse.2009.04.007 [ Links ]
14. Singh A. Digital change detection techniques using remotely- sensed data. Int J Remote Sens. 1989;10:989-1003. http://dx.doi.org/10.1080/01431168908903939 [ Links ]
15. Sanchez-Azofeifa GA, Castro-Esau WA, Kurz A, Joyce J. Monitoring carbon stocks in the tropics and the remote sensing operational limitations: From local to regional projects. Ecol Appl. 2009;19:480-494. http://dx.doi.org/10.1890/08-1149.1 [ Links ]
16. Myeong S, Nowak DJ, Duggin MJ. A temporal analysis of urban forest carbon storage using remote sensing. Remote Sens Environ. 2006;101:277-282. http://dx.doi.org/10.1016/j.rse.2005.12.001 [ Links ]
17. Alhern FJ, Cahoon D, French NH, Kasischke ES, Michael JL. Forest fire monitoring and mapping: A component of global observation of forest cover. Brussels: Joint Research Centre, European Commission; 2000. p. 170-174. [ Links ]
18. Canty MJ, Nielsen AA, Schmidt M. Automatic radiometric normalization of multitemporal satellite imagery. Remote Sens Environ. 2004;91:4411-4451. http://dx.doi.org/10.1016/j.rse.2003.10.024 [ Links ]
19. Chave J, Condition R, Aguilar S, Hernandez A, Lao S, Perez R. Error propagation and scaling for tropical forest biomass estimates. Philos Trans Roy Soc Lond B. 2004;359:409-420. http://dx.doi.org/10.1098/rstb.2003.1425 [ Links ]
20. Fuchs H, Magdon P Kleinn C, Flessa H. Estimating aboveground carbon in a catchment of the Siberian forest tundra: Combining satellite imagery and field inventory. Remote Sens Environ. 2009;113:518-531. http://dx.doi.org/10.1016/j.rse.2008.07.017 [ Links ]
21. Hirata Y Estimation of stand attributes in Cryptomeria japonica and Chamaecyparis obtusa stands using QuickBird panchromatic data. J Forest Res Jpn. 2008;13(3):147-154. http://dx.doi.org/10.1007/s10310-008-0059-7 [ Links ]
22. Birch NE. The vegetation potential of natural rangelands in the Mid fish river valley, Eastern Cape, South Africa: Towards a sustainable and acceptable management system [unpublished PhD thesis]. [ Links ] Grahamstown: Rhodes University; 2000.
23. Malhi Y Grace J. Tropical forests and atmospheric carbon dioxide. Trends Ecol Evol. 2000;15:332-337. http://dx.doi.org/10.1016/S0169-5347(00)01906-6 [ Links ]
24. Lu D. The potential and challenges of remote sensing based biomass estimation. Int J Remote Sens. 2006;12:2509-2525. http://dx.doi.org/10.1080/01431160500486732 [ Links ]
25. Mills AJ, Cowling RM. Rate of carbon sequestration at two thickets restoration sites in the Eastern Cape South Africa. Austral Ecol. 2006;30:797-804. http://dx.doi.org/10.1111/j.1442-9993.2005.01523.x [ Links ]
26. Buyantuyev A, Wu J. Effects of thematic resolution on landscape pattern analysis. Landscape Ecol. 2007;22:7-13. http://dx.doi.org/10.1007/s10980-006-9010-5 [ Links ]
27. Lu D, Mausel P Brondizio E, Moran E. Assessment of atmospheric correction methods for Landsat TM data applicable to Amazon basin LBA research. Int J Remote Sens. 2002;23:2651-2671. http://dx.doi.org/10.1080/01431160110109642 [ Links ]
28. Im J, Jensen JR, Tullis JA. Object-based change detection using correlation image analysis and image segmentation. Int J Remote Sens. 2008;29(2):399-423. http://dx.doi.org/10.1080/01431160601075582 [ Links ]
29. Benz UC, Hofmann P Willhauck G, Lingenfelder I, Heynen M. Multi-resolution, object oriented fuzzy analysis of remote sensing data for GIS-ready information. ISPRS J Photogramm. 2004;58:239-258. http://dx.doi.org/10.1016/j.isprsjprs.2003.10.002 [ Links ]
30. Muukkonen P Heiskanen J. Estimating biomass for boreal forests using ASTER satellite data combined with standwise forest inventory data. Remote Sens Environ. 2005;99:434-447. http://dx.doi.org/10.1016/j.rse.2005.09.011 [ Links ]
31. Chubey MS, Franklin SE, Wulder MA. Object-based analysis of IKONOS-2 imagery for extraction of forest inventory parameters. Photogramm Eng Rem Sens. 2006;2:383-394. http://dx.doi.org/10.14358/PERS.72.4.383 [ Links ]
32. Llyod JW, Van den Berg EC, Palmer AR. Patterns of transformation and degradation in the thicket biome, South Africa. Port Elizabeth: Terrestrial Ecology Research Unit, Nelson Mandela Metropolitan University; 2002. [ Links ]
33. Kakembo V. Trends in vegetation degradation in relation to land tenure, rainfall and population changes in Peddie District, Eastern Cape, South Africa. Environ Manage. 2001;1:39-46. http://dx.doi.org/10.1007/s002672001 [ Links ]
34. Kakembo VRowntree KM. The relationship between land use and soil erosion in the communal lands near Peddie Town, Eastern Cape, South Africa. Land Degrad Dev. 2003;14:39-49. http://dx.doi.org/10.1002/ldr.509 [ Links ]
35. Nyamugama A. Monitoring carbon stocks in the sub-tropical thicket biome using remote sensing and GIS techniques: The case of the Great Fish River Nature Reserve and its environs, Eastern Cape Province, South Africa [unpublished PhD thesis]. [ Links ] Port Elizabeth: Nelson Mandela Metropolitan University; 2013.
36. Mills AJ, Cowling RM, Fey MVKerley GIH, Donaldson JS, Lechmere Oertel RG, et al. Effects of goat pastoralism on ecosystem carbon storage in semi-arid thicket, Eastern Cape, South Africa. Austral Ecol. 2005;30:797-804. http://dx.doi.org/10.1111/j.1442-9993.2005.01523.x [ Links ]
37. Powell M. Restoration of degraded subtropical thickets in the Baviaanskloof Megareserve, South Africa [unpublished MSc thesis]. [ Links ] Grahamstown: Rhodes University; 2009.
38. Palmer AR, Kakembo VLloyd JW, Ainslie A. Degradation patterns in the succulent thicket. Proceedings of the First Step Forum, Zuurberg. South Africa. Report no. 54. Port Elizabeth: Centre for African Conservation Ecology, Nelson Mandela Metropolitan University; 2006. p .7-17. [ Links ]
39. Copping P Jonckheere I, Nackaerts K, Muys B. Digital change detection methods in ecosystem assessing: A review. Int J Remote Sens. 2004;25:1565-1596. http://dx.doi.org/10.1080/0143116031000101675 [ Links ]
 Correspondence:
Adolph Nyamugama
Agricultural Research Council - Institute for Soil
Water and Climate
Private Bag 0083, Pretoria 0001
South Africa
Email: adolph.nyamugama@gmail.com
Received: 26 May 2014
Revised: 30 Sep. 2014
Accepted: 04 Dec. 2014

