


Serviços Personalizados
Artigo
 Inglês (pdf)
 Artigo em XML
 Referências do artigo
Indicadores

Links relacionados
-
 Citado por Google
 -
 Similares em Google
Compartilhar

 Permalink
South African Journal of Science
versão On-line ISSN 1996-7489
versão impressa ISSN 0038-2353
S. Afr. j. sci. vol.111 no.9-10 Pretoria Set./Out. 2015
http://dx.doi.org/10.17159/SAJS.2015/20140093
RESEARCH ARTICLE
Sectoral electricity elasticities in South Africa: Before and after the supply crisis of 2008
James Blignaut; Roula Inglesi-Lotz; Jaco P. Weideman
Department of Economics, University of Pretoria, Pretoria, South Africa
ABSTRACT
In this paper, we estimate the price elasticity of electricity for various industrial sectors of the South African economy from 2002 to 2011. The data used include sectoral electricity consumption data and electricity tariff data, both courtesy of Eskom as well as output data based on national statistics. The most important contribution this paper makes is that it includes the period after the sharp rises in electricity tariffs in 2007/2008 following a period of load-shedding and insecurity in electricity supply. Previous studies have included data only until 2007 and, for the most part, have found statistically insignificant, positive elasticities. However, for the period post-2007, we found statistically significant and negative elasticities for 9 of the 11 sectors considered. Our results show that the majority of industrial sectors have become much more sensitive to changes in the price of electricity following 2007/2008, indicating to policymakers that tariff restructuring might influence consumer behaviour significantly.
Keywords: electricity tariffs; price elasticity; electricity demand; industrial sectors; structural break
Introduction
Price elasticity measures the sensitivity of consumer behaviour to price (or tariff) fluctuations. (It should be noted that electricity prices in South Africa are administratively set and hence are actually tariffs, but here we use the terms interchangeably.) Understanding such behavioural responses is of strategic and practical importance to policymakers and investors alike within the electricity sector when considering infrastructure development planning, the determination of future electricity tariffs, environmental policies, etc. Being able to determine the most likely behavioural responses to changes in prices in an industrial environment that is continuously becoming more electricity intensive1 is the key to successful policy implementation.
South Africa experienced a severe electricity supply crisis during 2007/2008 with extensive blackouts or loadshedding. The damaging consequences on the economy were vast. The National Energy Regulator of South Africa (NERSA) estimated that approximately ZAR50 billion (approximately USD5 billion) was lost during this crisis.2 Many possible reasons have been given to explain the crisis, such as the lack of capacity for generation and reticulation of electricity3 and the lack of research on electricity topics and energy in general4.
Eskom (the state-owned monopolistic supplier of electricity in South Africa) argued that the rate of economic and population growth in the country increased the mismatch between demand and supply of electricity,5 and thus, only the expansion of power generation capacity would be able to alleviate the problem. Since then, the construction of two additional power plants, Medupi and Kusile, was initiated. These plants will be fully operational only from 2018 onwards, adding an extra 9600 Mw (2 x 4800 MW) to the current power generation capacity.
It has also been argued3,6 that South Africa's historically low electricity tariffs - compared with those of the rest of the world - have been a disincentive for consumers to use energy efficiently, leading to higher electricity consumption levels. Since the crisis, Eskom and NERSA have changed the electricity tariff structure resulting in increases of up to 25% per annum from 2008 to date.
Following these events, many researchers have tried to detach the behaviour of consumers and their reactions -if any - to the past and also to future changes in tariffs.3,6-9 When these studies were published, the available data included information only up to 2007/2008 - a time when electricity tariffs were at historically low levels.3 Hence, the data did not allow for the investigation of the possible impacts of price restructuring beyond 2007/2008 on the South African electricity market nor for any changes in elasticities.
The tariff structures in the country since 2008/2009 might have altered consumer sensitivity to price fluctuations, so an in-depth analysis of this new behaviour has become imperative. From the outset it should also be noted that, given the dynamic nature of the country's economy, it is necessary to update elasticity estimates regularly as they do change over time (see also Inglesi-Lotz6). Moreover, this information is also necessary to estimate the degree of consumer sensitivity to the introduction of any carbon tax or other future price restructuring.
Although we are not the first to ask these questions, this paper is unique in several ways. Firstly, it is the first to incorporate data after the electricity supply crisis in South Africa and the price restructuring of 2008/2009. Previous studies on the South African case only included information pre-energy crisis in the country and hence could not discuss the effects of the crisis and the price changes in consumer behaviour. This study is therefore not just a more updated version, but also provides more relevant and current policy suggestions.
Secondly, ours is the first study conducted for South Africa with such a detailed level of disaggregation. This analysis is not only for sectoral policy implications but will also assist in thoroughly understanding similarities and differences in the behaviour of the various sectors. This understanding allows investigations into whether there are changes and whether these changes are confined purely to certain sectors or are an economy-wide trend.
Literature review
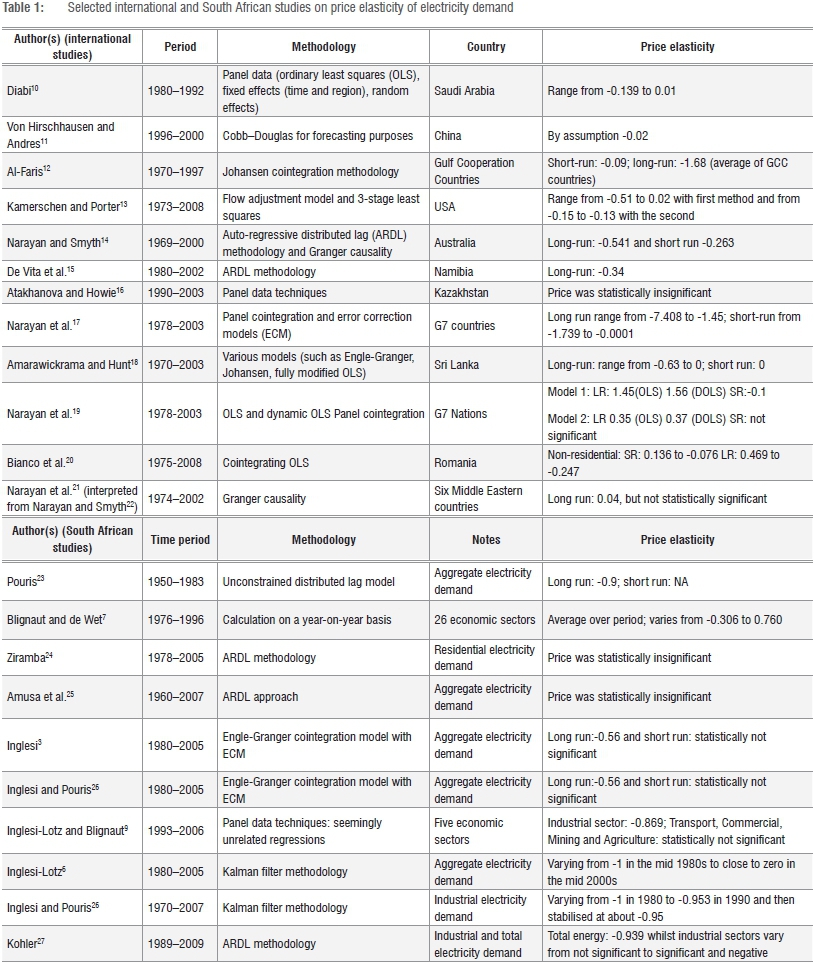
Several studies have been conducted on the issue of electricity prices and price elasticity in South Africa, especially before 2007/2008. The local increase in the interest in price elasticity of electricity is matched by a similar increase internationally. Table 1 lists a selection of studies that deal with the influence of electricity prices on electricity consumption, both locally and internationally.
While this list is not exhaustive, the following salient facts emerge:
- International literature has focused on both developed and developing countries as electricity and its determinants are equally important for the economic growth and development of all countries.
- A large number of different methodologies was used, either in a time-series context looking at only one country at a time or in a panel context examining a group of countries at once.
- None of these studies concluded a certain trend, that is, whether the electricity demand was more or less elastic in the short run than in the long run.
- In some studies, such as Ziramba's24 and Amusa et al.'s25, the price was found to be a statistically insignificant factor in the determination of electricity demand and hence was excluded from the estimations.
- South African studies reported various conclusions from no effect of price on consumption (zero or statistically insignificant elasticities) to highly negative price elasticities.
From these observations, it can be inferred that the sensitivity of consumers to tariff changes is a dynamic process: different among countries and variable depending on the specific conditions of the country's electricity market and economy in its entirety. Beyond the anthropogenic effects, climate also has an impact on electricity demand28 and may affect sectors differently. For these reasons, we aimed to re-examine the sectoral elasticities of electricity demand for South Africa since the tariff increases of 2008 because consumer behaviour towards electricity usage may have shifted.
The direction and magnitude of the behavioural change and adaptation of any particular sector varies highly. However, these changes can be broadly categorised into two outcomes: the industry does not adapt and output is affected, or the industry adapts and output is 'minimally' affected. In terms of what can be done with regard to price changes, a neat case study by Thollander et al.29 exists for the Swedish iron foundry industry. Thollander et al.'s29 findings indicate that electricity price rises could lead to the industry employing 'energy efficiency' measures. The extent of these measures varies, but in another case, also in Sweden, it was found that in the face of price hikes in a chemical wood pulp mill, consumption of electricity could be reduced by up to 50% through efficiency measures.29
If this was the case in South Africa, we would expect to see elasticity remain insignificant and not constrain output for the particular industry under investigation. Industries that may exhibit such qualities to some extent, based on the work of Inglesi-Lotz and Blignaut9, include the agricultural as well as non-ferrous metal sectors. These sectors have shown considerable gains in energy efficiency over the period 1993-2006. Given this historical trend towards efficiency in these two sectors, the price increases of 2008 may ultimately serve as catalysts to accelerate this effect. On the other hand, a sector that may be particularly affected is the iron and steel sector, which showed a large decrease in energy efficiency over the same period.10 Electricity price changes might therefore be very damaging to the output of this sector.
Research methodology
Theoretical approach
In a perfect empirical world in which all information is available and quantifiable, a rather straightforward empirical description of the factors affecting the demand for electricity (qit in Equation 1) exists. The main factors influencing electricity consumption are: (1) sector-level electricity demand characteristics, denoted by X, (2) availability of electricity (supply side factors), denoted by Z and (3) the price of electricity (p). Throughout this study, a panel approach is followed, with the subscript i'=1,...W referring to the individual sector under investigation whilst the subscript t=1,...T refers to the time period under investigation.

Typically, one would expect to estimate the supply side to arrive at an estimation of the supply price, and use the estimate of the supply price in the demand equation. In that structure, Z would not appear directly in the demand estimate, it would rather appear indirectly. However, in a monopolistic set-up such as the South African electricity supply sector, the supply curve is actually the marginal revenue curve, although only that portion thereof that lies above the marginal cost curve. Presumably, this marginal cost curve is (in the short run) flat within the boundary of the capacity constraints.
Electricity tariffs are exogenously determined by the national supplier of electricity, Eskom (as approved by NERSA). The tariffs are not determined through the interaction of supply and demand, but are an administrative charge determined by a national process of consultation and then decided on by the regulator. Consequently, and combined with the fact that electricity supply in the country has a specified ceiling, electricity supply is not considered to be a factor affecting electricity demand.
Based on this scenario, a regression of the following form is estimated following the most used specification in the literature3,6,2430:

where q is the annual electricity consumption per sector; p is the annual average tariff charged to each sector and X is the annual economic output per sector.
Econometric methodology
The data covered a number of sectors in the period 2000-2012, thus forming a panel database. Firstly, unit root tests are used to formally assess whether the panel data set is stationary or not. The tests proposed by Levin et al.31 and Im et al.32 are used to conclude whether the panel data set studied exhibits stationarity attributes. The first tests for the existence of a common unit root process while the second tests for individual unit roots.
If the results of the tests show that the series are stationary, then the analysis proceeds with the estimation of seemingly unrelated regressions (SUR). If not, Pedroni's33,34 panel cointegration test is used to investigate whether the series are cointegrated or not. If the series are cointegrated, then we continue with the SUR estimation as our focus is primarily on the long run. The Pedroni test allows for interdependence between cross sections.

The coefficients ai and § allow for sector-specific fixed effects and deterministic trends, respectively, while sit denotes the estimated residuals representing deviations from the long-run. The null hypothesis is that there is no cointegration (in other words, the residuals are non-stationary). A unit root test is conducted as follows:

The panel tests proposed by Pedroni33,34 use the following four statistics: panel ν, panel ρ, panel Pp and panel ADF-statistic. These can be described as follows:
These statistics pool the autoregressive coefficients across different countries for the unit root tests on the estimated residuals. These statistics take into account common time factors and heterogeneity across countries. The group tests are based on the between dimension approach which includes three statistics: group r, group PP, and group ADF-statistics. These statistics are based on averages of the individual autoregressive coefficients associated with the unit root tests of the residuals for each country in the panel.34(p.657)
Studies that used panel data techniques9,10,16,17 usually first estimated a pooled estimation followed by a fixed effects model to capture cross-sectional heterogeneity. The pooled effects model is, however, considered to be limited for a number of applications, as it does not take into account any cross-section heterogeneity among the sectors. The pooled effects model presents a joint estimation of coefficients as follows:
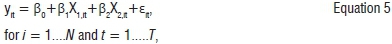
where yit is the dependent variable observed for individual i at time t; X1it and X2it are the time-variant regressors; β0 is the constant; β1 and β2 are the slope coefficients; and sit is the error term. However, 'pooling' has some specific characteristics, such as the increase of the degrees of freedom, hence the potential low standard errors on the coefficients as a result. Also, except for the same slope coefficients, Equation 5 assumes a common intercept. To be able to distinguish between different effects, Equation 5 can be rewritten as:
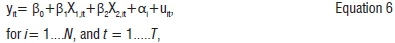
where ai is the unobserved individual effect and uit is the error term.
There are two methods of dealing with the unobserved individual effect: the fixed effect model and the random effects model. The first assumes that α is not independent of X1it and X2it while the latter assumes that ai is independent of X1it and X2it or E(ai | X1it ,X2it ) = 0. However, these estimations assume an average price coefficient for all the cross-sections (economic sectors in this application). Thus, to describe the behaviour of each sector separately and hence capture differences among sectors, SURs are estimated. Equation 6 should be amended (by representing a different coefficient for each i in order to represent a SUR) as follows:
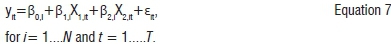
For this specific exercise, Equation 7 is transformed into:
electricity consumptionit=a0i+a1,ipriceit+ a2,ioutputit +uit Equation 8
where, once again, i is 1,...N for each sector; t is 1,....T is the time
period; electricity consumption is the electricity consumption of each sector; price is the tariff charged by Eskom to each of the sectors; output is the economic output of each of the sectors and α0, α1, α2 are the slope coefficients for each of the variables. All the variables are in their natural logarithms.
Data
Industrial sectors
The choice of the sectors to be included was dictated by the availability of data. These industrial sectors are:
- Agriculture: agriculture, forestry and fishing
- Coal mining
- Gold and platinum mining
- Rest of mining
- Iron and steel: basic iron and steel; metal products excluding machinery; and machinery and equipment
- Liquid fuels: coke and refined petroleum
- Non-ferrous metals
- Rest of chemicals: non-metallic minerals; basic chemicals; other chemicals and human-made fibres; rubber products and plastic products
- Rest of manufacturing: food, beverages and tobacco; electrical machinery and apparatus; textiles, clothing and leather; transport equipment; wood and paper; publishing and printing; glass and glass products; and furniture and other manufacturing
- Transport
- Commercial: trade, catering and accommodation services; financial intermediation, insurance, real estate and business services; and community, social and personal services
Given that the analysis is over 11 sectors ranging from 2002 to 2012, the cross-sectional dimension for the panel analysis performed here can be defined as i = agriculture, coal mining...to transport and commercial. In the case of the time variable, t represents any year from 2002 to 2012.
Electricity tariffs
With regard to tariffs, Eskom has a very detailed analysis of their tariffs and the time of use (TOU) structure. The issuing of tariff books started in 1995, resulting in a rich collection of tariff data available. The descriptions of the tariffs that will be used here are as follows:
- Ruraflex35[p. 44-45]: TOU electricity tariff for rural customers with a notified maximum demand (NMD) from 25 kVA.
In our application, Sector 1 (agriculture) falls in this category. Tariffs are different between high-demand and low-demand seasons and among three categories within each season (peak/standard and off-peak). A weighted average tariff for each year was estimated using the consumption level for each TOU slot for each year.
- Megaflex35[p. 20-21]: TOU electricity tariff for urban consumers with a NMD greater than 1 MVA.
In our application, Sectors 2-10 fall in this category. Prices are different between high-demand and low-demand seasons and among three categories within each season (peak/standard and off peak), and a weighted average was estimated for each sector based on the consumption for each TOU slot for each year.
- Businessrate35[p. 26]: Suite of electricity tariffs typically for commercial use and for high-consumption, non-commercial supplies in urban areas with a NMD of up to 100 kVA.
In our application, Sector 11 (Commercial sector) falls in this category. Different charges for different types of business rate are described as well as an extra environmental levy charged per season of the year, with a weighted average estimated for each year based on the consumption levels.
Figure 1 shows the three weighted real averages for Megaflex, Ruraflex and Businessrate (The price series has been deflated using the consumer price index of the South African Reserve Bank.36)
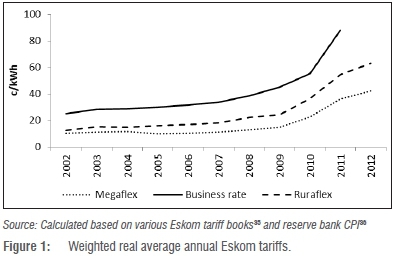
From Figure 1, it can be observed that the real electricity tariffs charged by Eskom were relatively low and stable for the years 2002-2008. As remarked earlier, in 2007/2008, the country experienced a severe electricity supply crisis resulting in prolonged periods of load-shedding with negative consequences for the entire economy. Following that, NERSA approved high increases in tariffs for the next 4 years (approximately 25% per annum).
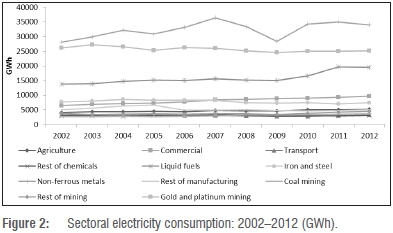
Electricity consumption
The annual electricity consumption data set was provided by Eskom and includes the Eskom national sales directly to each consuming sector. Figure 2 shows the electricity consumption per sector from 2002 to 2012.
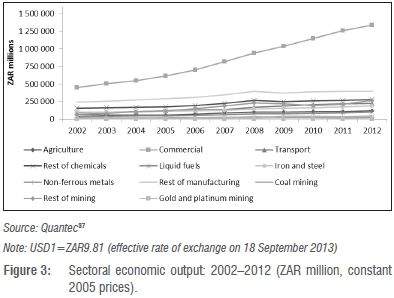
Economic output
The data for the output of the various sectors were obtained from Quantec's South African Standardized Industry Indicator Database and are given in South African rand (ZAR) millions at 2005 constant prices. The data set extends from 1970 to 2012. Figure 3 presents the economic output per sector from 2002 to 2012.
Empirical results
As discussed in the methodology section, the first step of the exercise was to examine the stationarity properties of the variables used in the estimation. The Levin et al.31 and Im et al.32 tests were performed on these series. According to the conclusions for the different specifications, there is evidence that the panel data set exhibits stationarity properties (the results can be made available by the authors upon request).
As the results of the stationarity tests cannot reject the null hypothesis of stationarity, we can continue with the SUR estimation for the different economic sectors, where electricity consumption will be represented here as a function of:
- real economic output whose coefficients are expected to be positive (a priori expectations)
- electricity tariffs whose coefficients are expected to be negative (a priori expectations)
Then based on the price restructuring after 2008, illustrated in Figure 1, the following dummy was used to capture the important changes in the electricity sector since 2008:

The assumption is that the price restructuring might have affected the behaviour of some sectors with regard to their decision on how much electricity to consume. Thus, the final equation to be estimated was as follows (all variables in natural logs):
electricity consumptiont=α0+α1pricet+α2dum*pricet+α3outputt Equation 10
With the use of the dummy, the assumption was that the sectors may behave differently after the price increases of 2008. The a priori expectation is that the tariffs did not play an important role in electricity consumption before 2008, but that they did so thereafter. This assumption is derived from Inglesi-Lotz and Blignaut9, who found price coefficients were statistically insignificant until 2006 (the last year of the sample because of data availability) and Inglesi-Lotz6 who found the price coefficient was close to zero for the last part of the time period (last year was 2005 because of data availability). From 2002 to 2007, the price elasticity was equal to a1 and from 2008 to 2012 was equal to α1 + α2 (where the coefficients are statistically significant).
Table 2 presents the results of the SUR estimation. The output coefficients are all positive and statistically significant, confirming our a priori expectations based on economic theory: the higher the production output of a sector, the higher the electricity usage of the sector.
In order to interpret the price elasticities, we should look at them for two separate periods: 2002-2007 and 2008-2012. As mentioned earlier, before 2008, price elasticity was represented by only the price coefficient but thereafter, it was represented by the sum of the price coefficient and the coefficient of the interaction variable of the dummy with price (for sectors for which the elasticities for both periods were statistically significant). Table 3 presents these coefficients.
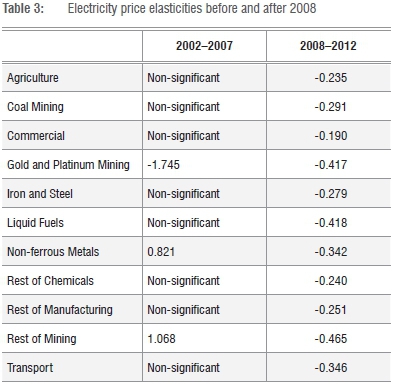
For the period 2002-2007, the majority of the sectors exhibited the same pattern: the price was statistically insignificant, or in other words, did not play a role in the changes in electricity consumption. However, after the price restructuring of 2007/2008, the sectors show a significantly higher sensitivity to price changes, illustrated by the statistically significant coefficients of the interaction of price with the dummy. The lack of importance before 2008 can be attributed to the relatively low and stable level of prices.6 Further evidence in support of this argument is that the majority of the sectors exhibited a structural break around the time that the price increase took effect (Chow test results are available upon request). Of those sectors that did exhibit a structural break, all are sectors that are heavily dependent on energy inputs and can hence be expected to react very quickly to price changes. Some sectors did not exhibit a break, possibly because of the limited number of observations available after the break dates. This limited number of observations means that it will be more difficult for the Chow test to detect more subtle structural changes. It may therefore be advantageous to conduct a more in-depth study on this issue of structural breaks once more data have become available for analysis. However, the results of the Chow test do not detract from the findings presented here, which are all statistically significant and of the a priori expected sign according to economic theory after the year 2008.
In the Commercial sector, the price changes did not seem to affect the electricity usage in the first period and the sector exhibited the lowest price elasticity in absolute values for the second period. That finding can be explained by the fact that the Commercial sector is not among the electricity intensive sectors of the country with the cost of electricity being a small portion of overall cost,1 and hence, tariff fluctuations are not a factor to their small electricity consumption.
The Mining sector is another exception to the norm of the results. The Gold and Platinum Mining sector was found to have reacted negatively to price changes even for the period 2002-2007. This sensitivity dropped after the tariff increases of 2008. This drop may be explained by the platinum mining sector's electricity consumption, which is driven by large increases in output (output coefficient = 3.824, substantially higher than the rest). During the period, the world experienced a platinum 'bubble' and these figures reflect this.
There are only two sectors in which an anomaly is observed: Other Mining (which includes diamonds, quarrying, etc.) and Non-ferrous Metals. The anomaly lies in the price elasticities before the price increases of 2008 - the elasticities were 1.068 and 0.821, respectively. The anomaly did, however, disappear in the period 2008-2012 as the price elasticities during this period were found to be both negative and statistically significant.
Conclusion and discussion
South Africa has seen many studies with respect to price elasticity in the recent past. These studies were conducted either at a national or at a sectoral level and included data prior to 2008. We aimed to examine the price elasticities of electricity demand in South Africa with the purpose of testing whether consumer behaviour changed and by how much after the energy crisis of 2007/2008 and price restructuring of 2008/2009.
The inclusion of further data beyond the energy crisis allowed for a comparison between pre- and post-energy crisis elasticities.
For the period 2002-2007, the estimates for price elasticity were statistically insignificant for the majority of the sectors, indicating that price did not play a role in the changes in electricity consumption. However, after 2008, the sectors showed a significantly higher sensitivity to price changes, illustrated by the statistically significant coefficients of the interaction of price with the dummy. The general trend we found is that those elasticity values which were insignificant before became significant, while those that were significant became more negative.
As in Inglesi-Lotz and Blignaut9, the differences among various sectors' electricity usage to price changes are also noted here. However, the overall trend of becoming more sensitive after the 2008/2009 price restructuring should be considered by policymakers. Future applications for increases in electricity tariffs (or higher environmental levies or carbon taxes) should take into account the fact that this might result in further decreases in electricity consumption. Decreases in consumption can materialise in two ways, with opposite effects. Some consumers will aim to consume energy more efficiently while others will turn to alternative and renewable forms of energy. This improvement and substitution will have a positive impact on environmental concerns. However, with higher prices of electricity, the variable costs for many small- and medium-sized enterprises will, in some cases, be unbearable and cause them to close down, thus putting severe constraints on the economic production of the country. This possibility is echoed by E.ON38 which highlights that using energy prices as a tool to encourage efficiency may damage growth in some sectors. A policy should be employed only for those sectors for which there is opportunity for efficiency gains.38 Prima facie evidence for a sector that would struggle to adapt, as per the current analysis, is the Gold Mining and Platinum Sector.
From a governmental perspective, it may therefore be advantageous to apply differential pricing strategies to the various energy consuming sectors. As noted in Kohler27, policymakers may in fact use energy pricing policy in such a manner as to discourage energy inefficiency within the South African economy by increasing the prices for energy inefficient users by more than those for energy efficient users. In so doing, the cost of inefficiency will rise and users of energy in South Africa will use energy more efficiently, reducing the demand for electricity somewhat in the long run.39 This increased energy efficiency can be further enhanced by combining the differential pricing with subsidies specifically aimed at electricity users that adopt energy efficient technologies.39 In fact, according to research by the Human Sciences Resource Council (HSRC),40 there are numerous opportunities for energy efficiency (or energy savings) even in the most energy-intensive sectors, such as some mining sectors and some manufacturing sectors.40 The HSRC furthermore identified low electricity prices as one of the impediments to the implementation of more efficient technologies.40 Hence, a two-way approach pushing energy users away from inefficiency by making energy costly, as well as a cost-pull towards efficiency in the form of a subsidy, may be the way forward for South Africa, especially given how sensitive many sectors have become to electricity prices.
Acknowledgement
This research is based on work supported in part by the National Research Foundation of South Africa (UID: 83868).
Authors' contributions
J.PW. collected the data and completed the literature review as well as the first draft of the manuscript; R.I-L. conducted the econometric analysis and interpreted the results together with J.B.; R.I-L. and J.B. also prepared the conclusions and policy implications of the study.
References
1. Inglesi-Lotz R, Blignaut JN. Electricity intensities of the OECD and South Africa: A comparison. Renew Sust Energ Rev. 2012;16:4491-4499. http://dx.doi.org/10.1016/j.rser.2012.04.004 [ Links ]
2. Nersa: Power crisis costs South Africa about R50 million. Mail and Guardian [online]. [ Links ] 2008 August 26 [cited 2009 Mar 30]. Available from: http://mg.co.za/article/2008-08-26-nersa-power-crisis-cost-sa-about-r50bn
3. Inglesi R. Aggregate electricity demand in South Africa: Conditional forecasts to 2030. Appl Energ. 2010;87:197-204. http://dx.doi.org/10.1016/j.apenergy.2009.08.017 [ Links ]
4. Pouris A. Energy and fuels research in South African universities: A comparative assessment. Open Inform Sci J. 2008;1:1-9. http://dx.doi.org/10.2174/1874947X00801010001 [ Links ]
5. Bayliss K. Lessons from the South African electricity crisis. Report no. 56. Brasilia: International Policy Centre for Inclusive Growth; 2008. [ Links ]
6. Inglesi-Lotz R. The evolution of price elasticity of electricity demand in South Africa: A Kalman filter application. Energ Policy. 2011;39:3690-3696. http://dx.doi.org/10.1016/j.enpol.2011.03.078 [ Links ]
7. Blignaut JN, De Wet T. Some recommendations towards reducing electricity consumption in the South African manufacturing sector. S Afr J Econ Manag S. 2001;42:359-379. [ Links ]
8. Odhiambo NM. Electricity consumption and economic growth in South Africa: A trivariate causality test. Energ Econ. 2009;31:635-640. http://dx.doi.org/10.1016/j.eneco.2009.01.005 [ Links ]
9. Inglesi-Lotz R, Blignaut JN. Estimating the price elasticity of demand for electricity by sector in South Africa. S Afr J Econ Manag S. 2011;14:449-465. [ Links ]
10. Diabi A. The demand for electric energy in Saudi Arabia: An empirical investigation. OPEC Rev. 1998;22:13-29. http://dx.doi.org/10.1111/1468-0076.00039 [ Links ]
11. Von Hirschhausen C, Andres M. Long-term electricity demand in China - From quantitative to qualitative growth? Energ Policy. 2000;28(4):231-241. http://dx.doi.org/10.1016/S0301-4215(00)00014-8 [ Links ]
12. Al-Faris AR. The demand for electricity in the GCC countries. Energ Policy. 2002;30:117-124. http://dx.doi.org/10.1016/S0301-4215(01)00064-7 [ Links ]
13. Kamerschen DR, Porter DV. The demand for residential, industrial and total electricity, 1973-1998. Energ Econ. 2004;26:87-100. http://dx.doi.org/10.1016/S0140-9883(03)00033-1 [ Links ]
14. Narayan PK, Smyth R. The residential demand for electricity in Australia: An application of the bounds testing approach to co-integration. Energ Policy. 2005;33:467-474. http://dx.doi.org/10.1016/j.enpol.2003.08.011 [ Links ]
15. De Vita G, Endresen K, Hunt IC. An empirical analysis of energy demand in Namibia. Energ Policy. 2006;34:3447-3463. http://dx.doi.org/10.1016/j.enpol.2005.07.016 [ Links ]
16. Atakhanova Z, Howie P. Electricity demand in Kazakhstan. Energ Policy. 2007;35:3729-3743. http://dx.doi.org/10.1016/j.enpol.2007.01.005 [ Links ]
17. Narayan PK, Smyth R, Prasad A. Electricity consumption in G7 countries: A panel co integration analysis of residential demand elasticities. Energ Policy. 2007;35:4485-4494. http://dx.doi.org/10.1016/j.enpol.2007.03.018 [ Links ]
18. Amarawickrama HA, Hunt LC. Electricity demand for Sri Lanka: A time series analysis. Energy. 2008;33(5):724-739. http://dx.doi.org/10.1016/j.energy.2007.12.008 [ Links ]
19. Narayan PK, Smyth R, Prasad A. Electricity consumption in G7 countries: A panel cointegration analysis of residential electricity demand. Energ Policy. 2007;35:4485-4494. http://dx.doi.org/10.1016/j.enpol.2007.03.018 [ Links ]
20. Bianco V, Manca O, Nardini S, Minea MA. Analysis and forecasting of nonresidential electricity consumption in Romania. Appl Energ. 2010;87:3584-3590. http://dx.doi.org/10.1016/j.apenergy.2010.05.018 [ Links ]
21. Narayan PK, Narayan S, Popp S. Does electricity consumption panel Granger cause GDP: A new global evidence. Appl Energ. 2010;87:3294-3298. http://dx.doi.org/10.1016/j.apenergy.2010.03.021 [ Links ]
22. Narayan KP, Smyth R. Multivariate granger causality between electricity consumption, exports and GDP: Evidence from a panel of Middle Eastern countries. Energ Policy. 2009;37:229-236. http://dx.doi.org/10.1016/j.enpol.2008.08.020 [ Links ]
23. Pouris A. The price elasticity of electricity demand in South Africa. Appl Econ. 1987;19:1269-1277. http://dx.doi.org/10.1080/00036848700000073 [ Links ]
24. Ziramba E. The demand for residential electricity in South Africa. Energy Policy. 2008;36:3450-3466. http://dx.doi.org/10.1016/j.enpol.2008.05.026 [ Links ]
25. Amusa H, Amusa K, Mabugu R. Aggregate demand for electricity in South Africa: An analysis using the bounds testing approach to cointegration. Energ Policy. 2009;37:4167-4175. http://dx.doi.org/10.1016/j.enpol.2009.05.016 [ Links ]
26. Inglesi R, Pouris A. Forecasting electricity demand in South Africa: A critique of Eskom's projections. S Afr J Sci. 2010;106(1/2):50-54. http://dx.doi.org/10.4102/sajs.v106i1/2.16 [ Links ]
27. Kohler M. Differential electricity pricing and energy efficiency in South Africa. Energy. 2014;64:524-532. http://dx.doi.org/10.1016/j.energy.2013.11.047 [ Links ]
28. Ahmed T, Muttaqi KM, Agalgaonkar AP. Climate change impacts on electricity demand in the State of New South Wales, Australia. Appl Energ. 2012;98:376-383. http://dx.doi.org/10.1016/j.apenergy.2012.03.059 [ Links ]
29. Thollander P Karlsson M, Söderstrom M, Creutz D. Reducing industrial energy costs through energy-efficient measures in a liberalized European electricity market: Case study of a Swedish iron foundry. Appl Energ. 2005;81:115-126. http://dx.doi.org/10.1016/j.apenergy.2004.07.006 [ Links ]
30. Inglesi-Lotz R. The sensitivity of the South African industrial sector's electricity consumption to electricity price fluctuations. Working paper no. 201215. Pretoria: Department of Economics, University of Pretoria; 2012. [ Links ]
31. Levin A, Lin CF, Chu C. Unit root tests in panel data: Asymptotic and finite-sample properties. J Econometrics. 2002;108:1-24. http://dx.doi.org/10.1016/S0304-4076(01)00098-7 [ Links ]
32. Im KS, Pesaran MH, Shin Y Testing for unit roots in heterogeneous panels. J Econometrics. 2003;115:53-74. http://dx.doi.org/10.1016/S0304-4076(03)00092-7 [ Links ]
33. Pedroni P Critical values for cointegration tests in heterogeneous panels with multiple regressors. Oxford B Econ Stat. 1999;61:653-670. http://dx.doi.org/10.1111/1468-0084.61.s1.14 [ Links ]
34. Pedroni P Panel cointegration: Asymptotic and finite sample properties of pooled time series tests with an application to the PPP hypothesis: New results. Economet Theor. 2004;20:597-627. http://dx.doi.org/10.1017/S0266466604203073 [ Links ]
35. Eskom. Tariff & charges booklet 2012/13. Johannesburg: Eskom; 2013. [ Links ]
36. South African Reserve Bank. Quarterly bulletin time series database: Series KPB7155J. Pretoria: South African Reserve Bank; no date. [ Links ]
37. Quantec. South African standardized industry indicator database [database on the Internet]. [ Links ] No date [cited 2014 Oct 28]. Available from: www.quantec.co.za
38. Madlener R, Bernstein R, Gonzalez MAG. Econometric estimation of energy demand elasticities. E.ON Energy Research Center Series (E.ON.ERC) volume 3 issue 8. Aachen: E.ON Energy Research Center; 2011. [ Links ]
39. Deloitte. Economic impact of electricity price increases on various sectors of the South African economy [document on the Internet]. [ Links ] No date [cited 2014 Oct 28]. Available from: http://www.eskom.co.za/CustomerCare/MYPD3/Documents/Economic_Impact_of_Electrcity_Price_Increases_Document1.pdf
40. Altman M, Davies R, Mather A, Fleming D, Harris H. The impact of electricity price increases and rationing on the South African economy. Pretoria: Human Sciences Research Council Centre for Poverty Employment and Growth; 2008. [ Links ]
 Correspondence:
Jaco Weideman
Department of Economics
Private Bag X20, Hatfield 0028
South Africa
Email: jaco.weideman@outlook.com
Received: 14 Mar. 2014
Revised: 28 Oct. 2014
Accepted: 27 Nov. 2014

