


Services on Demand
Article
 English (pdf)
 Article in xml format
 Article references
Indicators

Related links
-
 Cited by Google
 -
 Similars in Google
Share

 Permalink
South African Journal of Science
On-line version ISSN 1996-7489
Print version ISSN 0038-2353
S. Afr. j. sci. vol.111 n.9-10 Pretoria Sep./Oct. 2015
http://dx.doi.org/10.17159/SAJS.2015/20140354
RESEARCH ARTICLE
Food consumption changes in South Africa since 1994
Lisa-Claire Ronquest-RossI; Nick VinkII; Gunnar O. SiggeI
IDepartment of Food Science, Stellenbosch University, Stellenbosch, South Africa
IIDepartment of Agricultural Economics, Stellenbosch University, Stellenbosch, South Africa
ABSTRACT
Food consumption patterns in South Africa have changed dramatically over the past decades and likely will continue to change over the coming decades. Various food-related studies conducted over the last few decades indicate that food consumption shifts in South Africa have been towards a more Western-orientated diet, with nutritional consequences contributing to increased obesity and other non-communicable diseases. Several sources of data may be used to examine patterns in food consumption over time. Each of these methods has its own merits depending on the desired outcome, but are difficult to compare as each measures different levels of dietary information. As a result of the lack of regular national or comparable food consumption data in South Africa, the objective of this study was to establish, through the use of databases (FAOSTAT food balance sheets and Euromonitor International© Passport), the broad food and beverage consumption shifts in South Africa since 1994. Our findings indicate that food consumption shifts have been towards an overall increase in daily kilojoules consumed, a diet of sugar-sweetened beverages, an increase in the proportion of processed and packaged food including edible vegetable oils, increased intake of animal source foods, and added caloric sweeteners, and a shift away from vegetables. The largest shifts in food consumption were observed for soft drinks, sauces, dressings and condiments, sweet and savoury snacks, meat, and fats and oils. Convenience, health and nutrition, and indulgence were the main drivers of the increase in consumption of packaged foods and beverages. These shifts in food consumption are concerning as relates to their fat, sugar and salt composition and potential effect on public health.
Keywords: food consumption data; food consumption shifts; packaged food; beverages; public health
Introduction
Background to food consumption in South Africa
Food consumption is affected by food availability, accessibility and choice.1 Food intake choices are influenced by factors such as geography, season, education, demography, disposable income, government and other support services, urbanisation, globalisation, marketing, religion, culture, ethnicity, social networks, time and the consumer.1-3 In 1994 certain changes occurred in South Africa which dramatically affected food consumption patterns and will continue to do so, as a result of shifts in food availability, accessibility and choices.4-6 Amongst others, there has been significant growth of supermarkets, which accounted for about 50-60% of retail sales, while rising urbanisation and growing per capita incomes are expected to double the demand for high-value foods such as dairy, meat, fresh fruits, vegetables, and processed, packaged and prepared foods.5-7 Total food expenditure has increased for fruit and vegetables and processed foods such as spaghetti and oven-ready meals, while expenditure on maize and wheat flour has declined.5,6,8 For South African women, who do most of the household grocery shopping, the most important consideration when choosing a food item is price.9,10 Taste, health, nutrient content, safety and hygiene of the food item, and ease of preparation (in descending order) are considered after price. Furthermore, Temple et al.11 showed that a healthier diet can cost as much as 69% more than a typical South African diet and concluded that a healthy diet is largely unaffordable for most South Africans.
Comparative food consumption information is useful in identifying trends in foods and eating patterns nationally or among various sub-populations of interest.1 Knowledge of food consumption patterns is required for nutrient profiling purposes, costing and compiling of typical food baskets, for innovation and trend analysis relevant for the food industry, pricing policies to promote healthier food purchases, addressing food insecurity, and developing and monitoring progress against food-based dietary guidelines.12,13
In the largest and only national food consumption survey conducted in South Africa (in 1999), the most commonly consumed food items of children aged 1-9 years old were maize, sugar, tea, whole milk and brown bread.14 Children's intakes of energy, calcium, iron, zinc, selenium, vitamins A, D, C and E, riboflavin, niacin, vitamin B6 and folic acid were below two-thirds of the Recommended Dietary Allowances.14 Steyn et al.15 concluded that South Africans, on average, primarily consume maize, wheat, vegetables, milk, potatoes and sugar. In a secondary study of dietary surveys by Steyn et al.16, it was determined that the most commonly consumed food items by the South African adult population were maize, sugar, tea, bread (brown and white), non-dairy creamer, brick margarine, chicken meat, full-cream milk and green leaves. In the 1-5 and 6-9-year-old groups, maize porridge, sugar, tea, full-cream milk and white bread were eaten most frequently.16 In 2009, a cross-sectional 24-hour food recall survey revealed that the most commonly consumed food groups for South Africans aged 16 and older, were cereals/roots, meat/fish, dairy and vegetables other than vitamin A-rich vegetables while eggs, legumes, and vitamin A-rich fruit and vegetables were least consumed.17 The most recent South African National Health and Nutrition Examination Survey (SANHANES-1) study indicated a national dietary diversity score of 4.2, which is very close to the cut-off level of 4.0 for dietary adequacy.9
Data sources for assessing food consumption trends
Several data sources can be used to examine food consumption patterns to determine changes over time.1,12 Such data are derived from FAOSTAT food balance sheets (FAOSTAT FBS), household budget surveys or individual dietary surveys.1,12 Each of these methods has its own merits depending on the desired outcome,1 but are difficult to compare as each measures different levels of dietary information.12
Food balance sheets
A food balance sheet provides a comprehensive picture of a country's food supply during a specified period.18,19 For each food item, the food balance sheet indicates the availability for human consumption, which corresponds to the sources of supply and their utilisation.18,19 When describing consumption of foods per capita of a population, FAOSTAT FBS do not represent the actual amount of food consumed and will invariably result in an overestimation in food consumption compared with individual dietary surveys.12,15
Household budget surveys
Household budget survey data are regularly collected in developed countries by the Organisation for Economic Co-operation and Development, Eurostat or national administrations for the population.12 South Africa collects these data for South African households as part of the Income and Expenditure Surveys that Statistics SA coordinate.20 Challenges with household budget surveys are that data collected on food quantities purchased are not necessarily consumed and are expressed as food categories, e.g. seed oils, and not as single food items, e.g. olive oil.12
Individual dietary surveys
In the developed world, many countries conduct nationwide monitoring surveys, which provide valuable data to understand long-term changes in food and nutrient intake.1 These data can be supplemented by smaller surveys, in single locations on smaller numbers of individuals, which often do not use the same methodology.1,12 Many countries, particularly in the developing world, do not have the resources to mount individual level nutrition surveys as these are both prohibitively expensive and labour intensive.1 In fact, only one large-scale study has ever been conducted in South Africa - the National Food Consumption Survey conducted in 1999 for children aged 1-9 years.14,21
Euromonitor International© Passport
Euromonitor International© delivers market research solutions via four different channels: databases, reports, books and consulting (Hartfall R 2013, written communication, February 6). Euromonitor International© Passport packaged food data are a consensus of opinions based on data gathered from trade sources, national statistics and secondary sources. These sources could include trade press, trade association data, company published reports and store checks in a sample of various stores with the bulk collated from trade interviews with market opinion leaders such as manufacturers, retailers, distributors, packaging converters and ingredients players (Hartfall R 2013, written communication, February 6). It covers all retail channels, both formal as well as informal, independent retailers including kiosks and street stalls (Hartfall R 2013, written communication, February 6). Euromonitor International© Passport measures, amongst other items, packaged food and beverages, fresh food and ingredients used in packaged food and beverages.22 Euromonitor International© Passport per capita food consumption data are based on total retail value or volume size in a given year divided by the population in that same year.22
The consequence of food consumption changes in South Africa is a transition towards a more Western-orientated diet as has been reported in various food- and nutrition-related studies conducted at a community or provincial level over the past few decades.9,23-25 In the past 50 years, data have shown that among urban black individuals, fat intake has increased from 16.4% to 26.2% of total energy (a relative increase of 59.7%), while carbohydrate intake has decreased from 69.3% to 61.7% of total energy (a relative decrease of 10.9%).23 Sugar intake as a percentage of total energy intake was 5.9% in rural areas and 12.3% in urban areas for adolescents and adults (aged 10 years and over).26 For urban areas, this value is above the World Health Organization's (WHO) recommendation for the prevention of dental caries.26 South Africans consume salt at levels of 8.1 g/day - nearly double the WHO recommendation of 4-6 g/day.27 South Africans have also shifted to eating on the move. The SANHANES-1 study revealed that almost half (48%) of South Africans reported that they had eaten out before with 28.3% of South Africans eating out weekly.9
Owing to the lack of regular national food consumption surveys or comparable food consumption survey data, the objective of this study was to establish, through the use of two databases (FAOSTAT FBS and Euromonitor Passport), the broad food and beverage consumption shifts amongst South Africans since 1994.
Materials and methods
Euromonitor International© Passport databases and FAOSTAT FBS were selected for this study as they both offer accessible, comprehensive and comparable national data on food items consumed. They are both regularly tracked (annually) and the available data have comparable units of measure, i.e. kilograms per capita per annum. FAOSTAT FBS data were extracted from the FAOSTAT website for South Africa.19 Euromonitor International© Packaged Food and Beverage Consumption (Euromonitor PFBC) was extracted from the Euromonitor International© Passport for the South African geography.22 Both sets of exported data were converted to per capita consumption figures as this takes into account increases in population growth over time. Per capita intake is a crude estimate of consumption as it is the total amount consumed divided by the total population and does not take into account wastage, losses in storage, urban/rural distribution differences or distribution within households.13,15 Therefore, it is comparable for daily intake values for commonly consumed foods, but may differ substantially for foods consumed by a smaller number of respondents.13,15 Intervals of 5 years were compared, from 1994 to 2009 for FAOSTAT FBS data and from 1999 to 2012 for Euromonitor PFBC data, with specific time overlaps in 1999, 2004 and 2009. Euromonitor International© Passport data for South Africa have been recorded only from 1998 and therefore the data overlap starts only in 1999. The food items were grouped into eight food categories: (1) meat, eggs and fish; (2) cereals; (3) vegetables, fruits and nuts; (4) dairy; (5) fats; (6) sugar and stimulants (coffee and tea); (7) packaged foods; and (8) soft drinks.
Data from FAOSTAT FBS and Euromonitor PFBC were compared according to food item per 5-year interval. Each of the eight food category data sets was then compared and analysed to determine the consumption trend of that food category over the specified period. This comparative analysis was also performed to assess the integrity of the data when both FAOSTAT FBS and Euromonitor PFBC data were available. Furthermore, the Euromonitor PFBC data were used to establish consumption trends of packaged food and beverages, as FAOSTAT FBS does not measure packaged foods and beverages specifically.
Results and discussion
Meat, eggs and fish
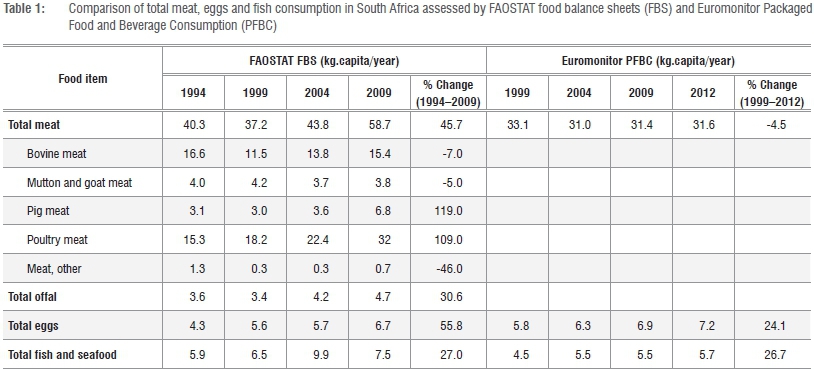
Meat has always been an important part of the human diet and remains central to most meals in developed countries.1 The South African Food Based Dietary Guidelines recommend that either chicken, fish, meat, milk or eggs should be eaten daily.28 Consistent with studies indicating that meat consumption has increased in South Africa,2,6 FAOSTAT FBS data (Table 1) indicate that South Africans consumed 18 kg of meat per annum more in 2009 than they did in 1994. This increase is mainly as a result of significant increases of 109% and 119% from 2009 to 1994 in consumption of poultry meat and pig meat respectively, with beef, mutton and goat meat consumption remaining relatively stable. However, the Euromonitor PFBC data indicate a slight decrease in meat consumption from 1999 to 2012 (Table 1). There was a 4-17 kg difference in absolute meat consumption between the FAOSTAT FBS and Euromonitor PFBC data with the FAOSTAT FBS indicating higher consumption (Table 1). The difference is because the Euromonitor PFBC meat data do not include meat consumption of processed meats such as sausages, canned meat or meat cuts with added ingredients or sauces.29 Therefore, the FAOSTAT FBS are more representative of meat consumption in South Africa. The total data set suggests that value-added processed meat consumption has increased significantly since 1994, as the Euromonitor PFBC data set, which does not include processed meat, showed a decline of 4.5% since 1999 and the FAOSTAT FBS data set, which does include it, showed increases in consumption of processed meat of 45.8% (Table 1).
Egg consumption, consistent across both the FAOSTAT FBS and Euromonitor PFBC data, has increased by 55.8% and 24.1% from 1994 to 2009 and 1999 to 2012, respectively (Table 1). This finding is in line with marked increases in worldwide egg consumption, especially in developing countries.1
Fish is an important source of good quality protein and is low in fat, except for oily fish which is a good source of long-chain polyunsaturated fatty acids.1 Fish consumption increased by more than 26% in both the FAOSTAT FBS and Euromonitor PFBC data sets (Table 1).
Cereals
According to the FAOSTAT FBS data, the largest contributors to total food and cereal consumption for South Africans in 2012 were maize (104 kg.capita/year) and wheat (60.9 kg.capita/year) (Table 2). This result is consistent with those of several food consumption surveys conducted in South Africa.14,16 A slight decrease of 4.6% was seen for maize consumption from 1994 to 2009 (Table 2), which is expected to continue into 2020 as household incomes continue to increase and consumers move towards higher-value food items.2,5 South African wheat consumption, ranging from 59.8 to 60.9 kg.capita/year from 1994 to 2009 (Table 2), is fairly in line with the world consumption rate of 66 kg.capita/year.2 Euromonitor PFBC unfortunately does not measure staple foods such as maize and wheat (Johnson S 2013, written communication, July 10). Euromonitor PFBC records wheat consumption only when wheat is consumed as an ingredient in processed foods (such as baked goods like brown bread) and is therefore significantly lower than that recorded by FAOSTAT FBS, but shows that wheat consumption has increased (Table 2). Only rice and oats showed significant increases in consumption of 48% and 83.3%, respectively, since 1994 (Table 2). Rice consumption data indicated in the Euromonitor PFBC is for packaged rice of all varieties (long grain, basmati etc.) as well as various packaging formats, e.g. ready-to-eat.
Millet and sorghum showed declines in consumption of 66.7% and 21.1%, respectively, but are not significant contributors to total cereal consumption for South Africans (Table 2).
Vegetables, fruits and nuts
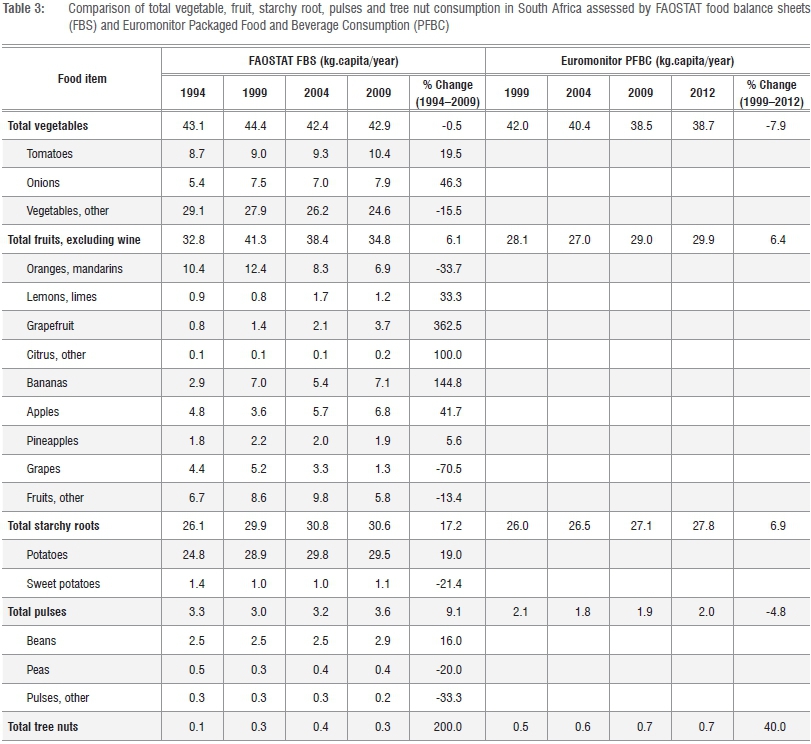
Fruit and vegetable consumption plays a vital role in providing a micronutrient dense diet30 and South Africa's Food Based Dietary Guidelines recommend eating plenty of fruits and vegetables every day and dry beans, peas, lentils and soya regularly.28 However, the recent SANHANES-1 study revealed a low intake of fruits and vegetables (two or fewer portions per day) for 25.6% of South Africans and that people in formal urban areas appeared to consume the most fruit and vegetables.9 This result may be linked to cost and availability.9 Inadequate fruit and vegetable consumption is a problem worldwide1 as well as in South Africa30. South Africans are eating slightly more fruit than in 1994 with both FAOSTAT FBS and Euromonitor PFBC data showing about a 6% increase (Table 3) led mainly by increases in banana, apple and grapefruit consumption. In research conducted by Steyn et al.31 on street food consumption in South Africa, fruit was the most commonly purchased item. Unfortunately, a slight decrease in vegetable consumption can be seen in both sets of data (Table 3). However, tomato and onion consumption increased moderately. Consumption of starchy roots (mainly potatoes) increased according to both sets of data with a corresponding slight decrease in sweet potato consumption (according to FAOSTAT FBS data) (Table 3). The consumption of pulses increased as a result of a moderate increase in bean consumption of 16% with peas and other pulses consumption declining (FAOSTAT FBS data) (Table 3).
Dairy
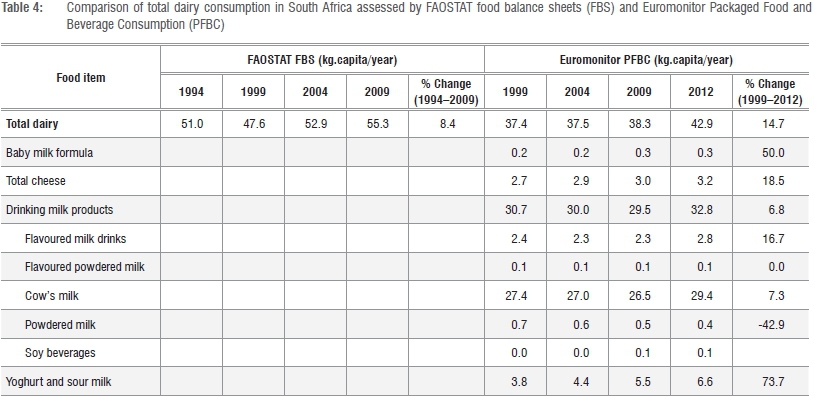
Dairy provides at least 10 essential nutrients including protein, carbohydrates, vitamins (A, B12 and riboflavin) and minerals (calcium, phosphorus, magnesium, potassium and zinc).32 According to the FAOSTAT FBS and Euromonitor PFBC data, dairy consumption increased by 8.4% from 1994 to 2009 and by 14.7% from 1999 to 2012 (Table 4). Some significant shifts, based on the Euromonitor PFBC data, are increases of 18.5% and 6.8% in cheese and drinking milk consumption, respectively, and a more significant increase of 73.7% in yoghurt and sour milk products consumption since 1999 (Table 4).
Cheddar is by far the most popular type of unprocessed cheese in South Africa (31%) followed by Gouda (20%) and mozzarella.33,34 In terms of consumption of drinking milk products, cow's milk consumption increased by 7.3% with a larger increase of 16.7% in value-added flavoured milk products over the same period (Table 4). Soy beverage consumption only became evident in 2009 at 100 mL.capita/year (Table 4) as soy is seen as a healthier alternative to dairy for those individuals who are lactose intolerant or have high cholesterol.35 A significant reduction of 42.9% in powdered milk consumption occurred over the same period (Table 4); consumers are moving away from powdered milk and towards ultrahigh temperature (or UHT) milk because it is more affordable.35
Yoghurt and sour milk consumption increased by a dramatic 73.7% to 6.6 kg.capita/year from 1999 to 2012 (Table 4). Danone Southern Africa led the category in 2012 with a value share of 44% through effective marketing of their leading yoghurt and sour milk brands over the last decade.36-38
Fats
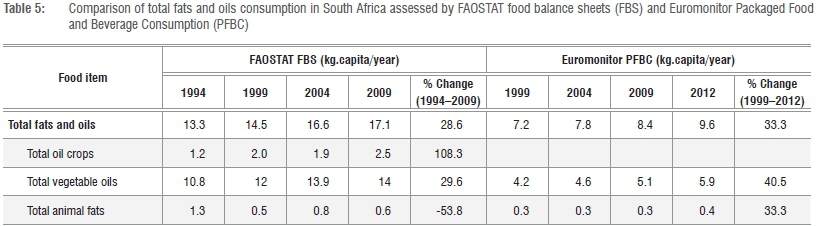
South Africa's Food Based Dietary Guidelines recommend eating fats sparingly.28 However, as with studies indicating increases in fats and oils consumption in South African and other developing countries,1,23,39 both FAOSTAT FBS and Euromonitor PFBC data indicated increasing trends (Table 5). Increases were greater than 28.5% according to both FAOSTAT FBS and Euromonitor PFBC data (Table 5). These increases are significant considering the high energy that fats and oils contribute to the diet and are mainly related to increases in vegetable oils (>29.6% for both FAOSTAT FBS and Euromonitor PFBC) and oil crops consumption (108.3%, FAOSTAT FBS data), coupled with a decrease in animal fat consumption of 53.8% (FAOSTAT FBS data specifically) (Table 5). The Euromonitor PFBC data refer to butter consumption only as it relates to animal fats. FAOSTAT FBS showed a marked decline in animal fats consumption in South Africa (Table 5), which has also been observed worldwide.1 However, butter consumption specifically has increased from 0.3 to 0.4 kg.capita/year (33.3%) from 1999 to 2012 with margarine consumption increasing by 13.6% to 2.5 kg.capita/year from 1999 to 2012 (Table 6). Olive oil consumption only became measureable in 2012 with 0.1 kg.capita/year (Table 6).

Sugar and stimulants
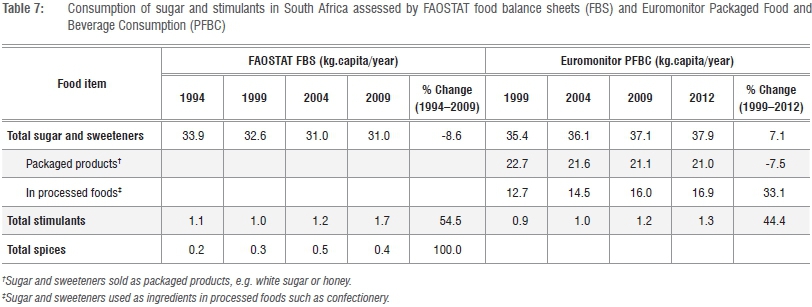
A positive trend in food consumption shifts since 1994 is that consumption of sugar and sweeteners as raw sugar or natural sweeteners (e.g. honey) declined by at least 7.5% according to both data sets (Table 7). However, the Euromonitor PFBC data indicated an overall increase in consumption of 7.1% as this data set includes intake of sugar and sweeteners when used as ingredients in processed foods (Table 7). There has been a large increase of 33.1% in consumption of sugar and sweeteners through consumption of processed foods which use sugar and sweeteners as ingredients e.g. confectionery and soft drinks (Table 7).
Apart from water, tea is the most consumed beverage in the world.40 Consumption of stimulants (coffee and tea) in South Africa has increased by 54.5% and 44.4%, according to the FAOSTAT FBS and Euromonitor PFBC data, respectively (Table 7). The total South African tea market is divided into black tea (80% of the market) with, rooibos and speciality tea making up the remainder.41 For centuries, herbs and spices have played an important role in our nutrition for both their culinary and healing value.42,43 Consumption of spices has doubled since 1994 (Table 7).
Packaged foods
Simple, convenient food solutions is a major global food trend and one that packaged foods address in many ways.2 In recent years, there has been an increase in sales of almost all categories of packaged foods and beverages in South Africa,29,44 resulting in a vibrant packaged food and beverage sector. According to the Euromonitor International© 2012 report on the South African Packaged Food sector, this sector has grown by 57% from ZAR91 billion to ZAR143 billion and by 15% in volume from 4.515 k tons to 5.202 k tons from 2007 to 2012.29 In fact, from 2000 to 2009, the food and beverage manufacturing sector outgrew the manufacturing sector at 32.6% compared to 8.7%.45
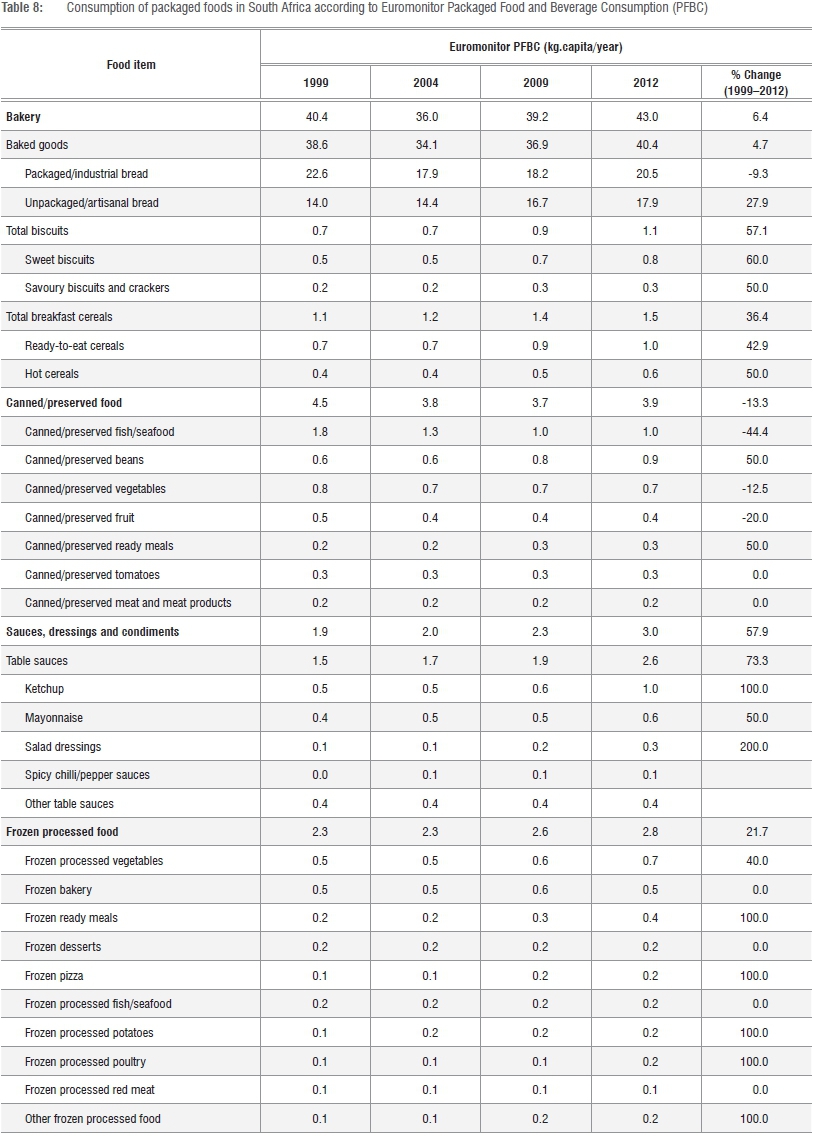
The largest category in packaged food in terms of per capita consumption is the bakery sector, which contributed 43 kg.capita/ year in 2012 (Table 8). Total consumption of items in this category increased slightly by 6.4% (Table 8). With respect to 'baked goods', of which bread consumption is the largest contributor, a slight increase of 4.7% was observed, mainly as a result of an increase of 27.9% in 'artisanal or unpackaged bread' consumption (Table 8). At the same time, conventional/industrial bread consumption decreased by 9.3% (Table 8). Innovation in value-added breakfast cereals and lower income consumers choosing maize as a more affordable carbohydrate are some of the reasons for conventional/industrial bread decline.46 White bread remained the most popular bread type in 2012 at 49% value share because of its appeal with lower income consumers.46 However, brown bread increased in popularity with its share reaching 42% in 2012.46 A number of new speciality breads have been launched in South Africa.46,47 Consumption of 'biscuits', both 'savoury and cracker type biscuits' as well as 'sweet biscuits' increased by more than 50% (Table 8). 'Savoury and cracker type biscuits' appeal to higher income groups who entertain at home.48 Plain 'sweet biscuits' accounted for nearly 50% of overall value sales in 2012 as a result of lower income consumers' attraction to strong brands with lower price point offerings.48,49 Consumption of 'breakfast cereals', both 'hot' and 'ready-to-eat', has increased by more than 42.9% since 1999 (Table 8). 'Breakfast cereal' consumption is fairly low in South Africa and price-sensitive consumers either switch out of cereals to cheaper carbohydrates such as bread or maize or between brands based on promotional prices, different pack sizes or cheaper variants.50,51
The next largest category in packaged food in terms of consumption was 'canned/preserved food' at 3.9 kg.capita/year in 2012 (Table 8). A decline of 13.3% in consumption from 1999 to 2012 was observed in this category (Table 8), in line with global declines in consumption of canned foods.52 Even though canned goods are considered household essentials as they are perceived to offer value for money, consumer perception is that they do not meet requirements for fresh, quality ingredients, convenience and eco-friendliness.52,53 Main category declines in consumption are seen in 'canned/preserved fish/seafood' (-44.4%), 'canned/preserved fruit' (-20%) and 'canned/preserved vegetables' (-12.5%) (Table 8). Consumers appear to be attracted to 'frozen processed vegetables' rather than 'canned/preserved vegetables' because of perceived freshness and lower costs.53,54 The only two categories in canned/preserved foods that grew in consumption (by 50%) were 'canned/preserved beans' and 'canned/preserved ready meals' such as spaghetti in sauce, meat in sauce and soup (Table 8).
The third largest category at 3 kg.capita/year in 2012, increasing from 1.9 kg.capita/year in 1999, was 'sauces, dressings and condiments' (Table 8). This category experienced a significant growth of 57.9% with 'table sauces' driving most of the consumption increases at 73.3% growth from 1999 to 2012 (Table 8). Consumption of 'tomato sauce/ketchup' and 'salad dressings' has more than doubled since 1999 (Table 8) and consumption of 'mayonnaise' grew by 50%. A new category - 'spicy chilli/pepper sauces' - emerged around 2004 (Table 8). The trend towards home dining to save money as well as the 'braaing' or barbequing culture in South Africa are some of the reasons for increased consumption.55
The fourth largest category contributing to per capita consumption of packaged foods, at 2.8 kg.capita/year, was 'frozen processed foods' (Table 8). The 'frozen processed foods' category grew by 21.7% from 1999 to 2012, with consumption in some sub-categories, such as 'frozen ready meals', 'frozen pizza', 'frozen processed potatoes' (e.g. frozen potato chips) and 'frozen processed poultry', even doubling (Table 8). Convenience is the driver of the increase56 as the number of consumers with freezers is increasing.54
Total 'confectionery' consumption has grown by 13% to 2.6 kg.capita/year since 1999 (Table 8). This growth is as a result of increasing consumption of 'chocolate confectionery' (12.5%), mainly from 'tablets' (Table 8). Chocolate 'tablets' or 'slabs' are the most popular chocolate confectionery type in South Africa and hold over 50% market share.57 Plain milk chocolate is still preferred over dark chocolate, but the ratio is changing because of the health benefits associated with dark chocolate.58,59 Consumption increases (16.7%) in 'sugar confectionery' are mainly as a result of 'boiled sweets', 'pastilles, gums, jellies and chews' (Table 8).
'Chilled processed food' consumption grew with a modest 9.5% to 2.3 kg.capita/year when compared to growth in consumption of other packaged foods (Table 8). 'Chilled ready meals' was the only category in 'chilled processed foods' that experienced increased consumption, with new categories, 'chilled pizza' and 'chilled/fresh pasta' appearing in 2004 and 2009, respectively (Table 8).
'Sweet and savoury snacks' consumption, also at 2.3 kg.capita/year, experienced significant growth of 53.3% between 1999 and 2012 with both 'chips/crisps' and 'extruded snacks' experiencing increases in consumption of more than 33% (Table 8). Potato and corn chips dominate with innovative local flavours such as Mrs Balls Chutney and Sweet Chilli leading, rather than entirely new products.60 Consumer drivers for this increase in consumption are busy lifestyles, snacking between meals, the launch of healthier alternatives (low in salt for example) and new flavours.61
Soft drinks
Consistent with the results of other studies, South Africans are increasing their consumption of soft drinks, especially in urban areas.16,31,44 Soft drinks were second to fruit, the most commonly purchased street food item.31 The high prevalence of soft drink consumption is concerning in terms of its association with obesity and non-communicable diseases.31 A recent study conducted in the USA concluded that added sugar intake from sugar-sweetened soft drinks is associated with an increase in cardiovascular disease mortality and recommended that calorie intake from added sugar be limited.62
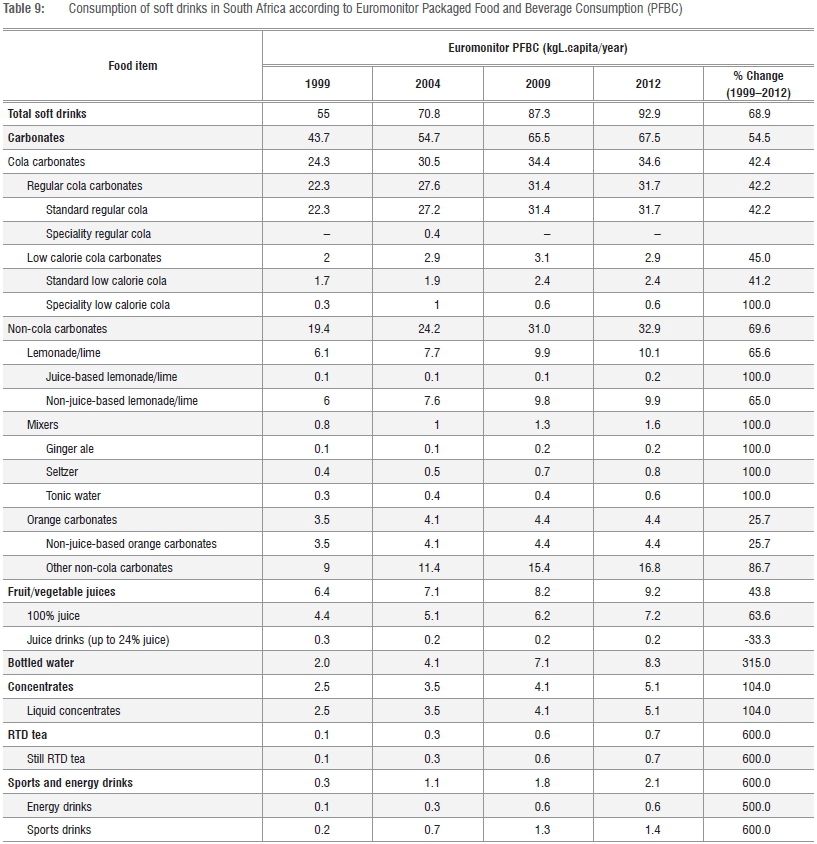
'Total soft drink' consumption increased by a dramatic 68.9% from 55 L. capita/year in 1999 to 92.9 L.capita/year in 2012, with all categories experiencing significant growth (Table 9). South Africa's annual per capita consumption of Coca-Cola products (including regular, low-calorie and no-calorie, sparkling beverages, ready-to-drink (RTD) juices and juice drinks, RTD coffees and teas, sports drinks, energy drinks, dairy, waters and enhanced waters) is 260 8-ounce servings (equivalent to a 237-mL serving), which is significantly higher than the worldwide average of 94 (22.3 L.capita/year).63 This equates to 61.6 L.capita/year in 2012 for Coca-Cola products in South Africa and is a significant increase of 80% from 144 8-ounce servings or 34 L.capita/year in 1992.63
The largest category of soft drinks is 'carbonates', which contributes a significant 67.5 L.capita/year (Table 9). Consumption across all 'carbonates' increased (from 41.2% to 100%) between 1999 and 2012 (Table 9). 'Low calorie/kilojoule cola carbonates' consumption increased by 45% (Table 9), but unfortunately remains a small contributor to the overall 'carbonates' consumption at <4.3% of total carbonates in 1999 and 2012. Better education among consumers about nutrition is affecting consumer preferences towards healthier options such as bottled water, nectars (25-99% juice), RTD tea, low-calorie cola carbonates and non-cola carbonates.64-66 The second largest category, contributing 9.2 L.capita/year to 'total soft drinks' consumption in 2012, is 'fruit/vegetable juice', which grew by 44% between 1999 and 2012 (Table 9). The largest growth in consumption was observed in '100% juice' offerings (Table 9), which remained the most popular juice type, followed by nectars and fruit drinks.64
'Bottled water' has become a substantial global business and consumption continues to increase rapidly, even in countries with available, safe potable tap water.67,68 There are many consumer considerations for this finding, such as dissatisfaction with tap water taste, demographics, perceived quality or safety of the water source, branding and marketing influences and overall convenience.66-68 'Bottled water' in South Africa, similar to the rest of the world, experienced a dramatic growth of 315% after 1999 to contribute 8.3 L.capita/year in 2012 (Table 9). However, a consumption of 8.3 L.capita/year still is significantly lower than the 2003 global average of 22.7 L.capita/year.68
Since 1999, 'concentrates' consumption has doubled to 5.1 L.capita/year in 2012 through consumption of liquid concentrates (Table 9). Two new categories that have experienced a dramatic 600% growth from 1999 to 2012 are 'sports and energy drinks' (from 0.3 to 2.1 L.capita/year) and 'RTD tea' (from 0.1 to 0.7 L.capita/year), albeit amongst a small population (Table 9). 'RTD tea' contains approximately 30% less sugar/calories than many 'carbonates'.40 For this reason there is an increased consumption as consumers move away from 'carbonates' to healthier alternatives.66
In terms of 'sports and energy drinks' consumption, even though consumption has grown significantly since 1994 to 2.1 L.capita/year, it is still low compared to that of developed countries. For example, Germany's per capita consumption of 'sports and energy drinks' is 5.3 L.capita/year and Austria's is 11.1 L.capita/year.69
As mentioned above per capita consumption data, as a measure, is a crude estimate and generally an overestimate, especially for food items consumed by a smaller portion of the population. For commodity food items, a data 'integrity-check' could be done to verify the reliability and accuracy of the two data sources (FAOSTAT FBS and Euromonitor PFBC). However, Euromonitor International© Passport was the only available source for packaged food and beverage data and therefore could not be verified against other sources.
Conclusions
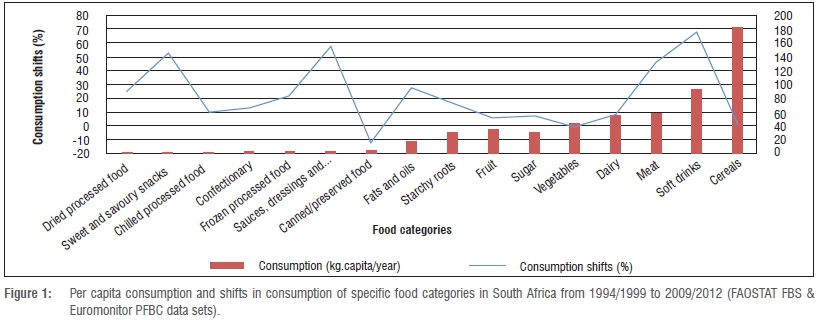
The most significant shifts (>30% increases) in food items consumed from 1994 to 2012 (Figure 1) were observed in these food and beverage categories: meat, fats and oils, sauces, dressings and condiments, sweet and savoury snacks, and soft drinks.
A significant increase was observed in meat consumption (Figure 1), with chicken being the most consumed animal protein. South Africans are consuming significantly more fats and oils coupled with a decrease in animal fat consumption. Packaged foods and beverages have seen the most dramatic shift (>50%) in soft drinks, sauces, dressings and condiments, and sweet and savoury snacks, which is typical of an upwardly mobile consumer (Figure 1). Convenience, health and wellness, and indulgence were the main consumer drivers for the increase in consumption of packaged foods since 1994.
In conclusion, the food consumption changes in South Africa observed in this study caused a shift towards a diet of:
- sugar-sweetened beverages
- increased proportions of processed and packaged food including edible vegetable oils
- increased intake of animal source foods
- added caloric sweeteners
- decreased vegetable consumption
These shifts in food choices are concerning for public health because of selected food items contributing to fat, sugar, salt and total kilojoule intake. These consumption shifts are in keeping with various food- and nutrition-related studies conducted at community or provincial level over the past few decades.9,23-25 As indicated in these studies, the nutritional consequence of these food consumption shifts has contributed to increased obesity and other non-communicable diseases.23,24,70 This problem is further exacerbated by the fact that a healthy diet is largely unaffordable for most South Africans11, especially when considering that price is the most important factor taken into consideration when selecting food items9.
Locally, and globally, the fast food, bottled soft drink and multinational food companies are often implicated in the increase in non-communicable diseases.24,71,72 The South African Department of Health has therefore targeted the food and beverage industry with regulations in an attempt to improve public health. Further regulations related to food composition and/or labelling as well as consumer demand for healthier, affordable products will require advances and/or the application of science and technology developments by the South African food and beverage industry.
Acknowledgements
We thank Rosalind Hartfall and Susie Johnson from Euromonitor International© Passport for their support in the use and interpretation of Euromonitor data; Johan Visser and Anee Sieberhagen at Nampak Research & Development for providing access to their extensive library; and Mars Africa for providing time and financial assistance.
Authors' contributions
L.C.R-R. was the project leader and was responsible for data collection and analysis and the write-up of the manuscript. G.O.S. was the supervisor and made editorial contributions. L.C.R-R., G.O.S. and N.V. were responsible for the project design.
References
1. Kearney J. Review: Food consumption trends and drivers. Philos Trans R Soc London B. 2010;365:2793-2807. http://dx.doi.org/10.1098/rstb.2010.0149 [ Links ]
2. Bureau for Food and Agricultural Policy (BFAP). The South African agricultural baseline [homepage on the Internet]. [ Links ] c2011 [cited 2012 Feb 19]. Available from: http://www.bfap.co.za/documents/baselines/BFAP_Baseline_2011
3. Wenhold F, Annandale J, Faber M, Hart T. Water use and nutrient content of crop and animal food products for improved household security: A scoping study. WRC Report no. 2012TT 537/12. Pretoria: Water Research Commission; 2012. [ Links ]
4. Anonymous. Rising sophistication. Food & Beverage Reporter. 1999 Nov/Dec; 6. [ Links ]
5. World Wide Fund (WWF). Agriculture: Facts and trends South Africa [document on the Internet]. [ Links ] c2012 [cited 2012 Dec 21]. Available from: http://awsassets.wwf.org.za/downloads/facts_brochure_mockup_04_b.pdf
6. Bureau for Food and Agricultural Policy (BFAP). The South African agricultural baseline [homepage on the Internet]. [ Links ] c2013 [cited 2013 Nov 04]. Available from: http://www.bfap.co.za/documents/baselines/BFAP_Baseline_2013
7. Reardon T, Gulati A. The supermarket revolution in developing countries policies for "competitiveness with inclusiveness". International Food Policy Research Institute (IFPRI) Policy Brief 2. East Lansing, MI: Michigan State University; 2008. [ Links ]
8. Statistics South Africa. Income and expenditure of households 2005/2006. Statistical release P0100 [document on the Internet]. [ Links ] c2008 [cited 2014 Apr 03]. Available from: http://www.statssa.gov.za/publications/P0100/P01002011
9. Shisana O, Labadarios D, Rehle T, Simbayi L, Zuma K, Dhansay A, et al. South African National Health and Nutrition Examination Survey (SANHANES-1). Cape Town: HSRC Press; 2013. [ Links ]
10. Nielsen. South Africans are cautious, price-sensitive grocery shoppers [homepage on the Internet]. [ Links ] c2012 [cited 2014 Feb 11]. Available from: http://foodstuffsa.co.za/food-trends-mainmenu-119/food-trends-2012/2316-south-africans-are-cautious-price-sensitive-grocery-shoppers
11. Temple NJ, Steyn NP Fourie J, De Villiers A. Price and availability of healthy food: A study in rural South Africa. Nutrition. 2011;27(1):55-58. http://dx.doi.org/10.1016/j.nut.2009.12.004 [ Links ]
12. Serra-Majem L, MacLean D, Ribas L, Brulé D, Sekula W, Prattala R, et al. Comparative analysis of nutrition data from national, household, and individual levels: Results from a WHO-CINDI collaborative project in Canada, Finland, Poland, and Spain. J Epidemiol Commun H. 2003;57:74-80. http://dx.doi.org/10.1136/jech.57.1.74 [ Links ]
13. Faber M, Wenhold FAM, MacIntyre UE, Wentzel-Viljoen E, Steyn NP Oldewage- Theron WH. Presentation and interpretation of food intake data: Factors affecting comparability across studies. Nutrition. 2013;29:1286-1292. http://dx.doi.org/10.1016/j.nut.2013.03.016 [ Links ]
14. Labadarios D, Steyn NFP Maunder E, MacIntryre M, Gericke G, Swart R, et al. The National Food Consumption Survey (NFCS): South Africa, 1999. Public Health Nutr. 2005;8(5):533-543. http://dx.doi.org/10.1079/PHN2005816 [ Links ]
15. Steyn NP Abercrombie R, Labadarios D. Food security - An update for health professionals. South Afr J Clin Nutr. 2001;14(3):98-102. [ Links ]
16. Steyn NP, Nel JH, Casey A. Secondary data analyses of dietary surveys undertaken in South Africa to determine usual food consumption of the population. Public Health Nutr. 2003;6(7):631-644. http://dx.doi.org/10.1079/PHN2003482 [ Links ]
17. Labadarios D, Steyn NP Nel J. How diverse is the diet of adult South Africans? Nutr J. 2011;10(33):1-11. http://dx.doi.org/10.1186/1475-2891-10-33 [ Links ]
18. Kelly A, Becker W, Helsing E. Food balance sheets. In: Becker W, Helsing E. Food and health data: Their use in nutrition policy-making. World Health Organization Regional Publications European Series No. 34. Copenhagen: WHO Regional Office for Europe; 1991. p 39-47. [ Links ]
19. FAOSTAT. Food balance sheets [homepage on the Internet]. [ Links ] c2013 [cited 2013 Jul 26]. Available from: http://faostat3.fao.org/faostat-gateway/go/to/download/FB/*/E
20. Statistics South Africa. Statistics by theme/Living condition [homepage on the Internet]. [ Links ] c2014 [cited 2014 Apr 03]. Available from: www.statssa.gov.za
21. Faber M, Wenhold F. Food intake and sources of food of poor households in rural areas of South Africa. In: Water use and nutrient content of crop and animal food products for improved household food security: A scoping study. WRC Report no. TT 537/12. Pretoria: Water Research Commission; 2012. p. 24-57. [ Links ]
22. Euromonitor International© Passport [homepage on the Internet]. [ Links ] c2013 [cited 2013 Nov 05]. Available from: http://www.portal.euromonitor.com/Portal/Default.aspx
23. Bourne LT, Lambert EV, Steyn K. Where does the black population of South Africa stand on the nutrition transition? Public Health Nutr. 2002;5(1A):157- 162. http://dx.doi.org/10.1079/PHN2001288 [ Links ]
24. Kruger HS, Puoane T, Senekal M, Van Der Merwe MT. Obesity in South Africa: Challenges for government and health professionals. Public Health Nutr. 2005;8(5):491-500. http://dx.doi.org/10.1079/PHN2005785 [ Links ]
25. Viljoen AT, Botha P, Boonzaaier CC. Factors contributing to changes in food practices of a black South African community. J Family Ecol Consum Sci. 2005;33:46-62. [ Links ]
26. Steyn NP, Myburgh NG, Nel JH. Evidence to support a food-based dietary guideline on sugar consumption in South Africa. B World Health Organ. 2003;81(8):599-608. [ Links ]
27. Bertram MY, Steyn K, Wentzel-Viljoen E, Tollman S, Hofman KJ. Reducing the sodium content of high-salt foods: Effect on cardiovascular disease in South Africa. S Afr Med J. 2012;102(9):743-745. http://dx.doi.org/10.7196/samj.5832 [ Links ]
28. Vorster HH, Love P Browne C. Development of food-based dietary guidelines for South Africa - The process. S Afr J Clin Nutr. 2001;14(3):S3-S6. [ Links ]
29. Euromonitor International. Packaged food in South Africa [database on the Internet]. [ Links ] c2012 [cited 2014 Oct 12]. Available from: http://www.portal.euromonitor.com/Portal/Default.aspx
30. Lombard M, Labuschagne I, Goosen C. The nutritional value of canned vegetables and fruit within a balanced diet. S Afr Food Review. 2011;38(2):24- 25. [ Links ]
31. Steyn NP, Labadarios D, Nel JH. Factors which influence the consumption of street foods and fast foods in South Africa - A national survey. Nutr J. 2011;10(104):1-10. http://dx.doi.org/10.1186/1475-2891-10-104 [ Links ]
32. Nutrition Australia. Dairy food myths [homepage on the Internet]. [ Links ] c2009 [cited 2014 Mar 04]. Available from: http://www.nutritionaustralia.org/national/resource/dairy-food-myths
33. Rolando R. The big cheese. S Afr Food Rev. 2012;39(1):15. [ Links ]
34. Euromonitor International. Cheese in South Africa [database on the Internet]. [ Links ] c2013 [cited 2014 Oct 12]. Available from: http://www.portal.euromonitor.com/Portal/Default.aspx
35. Euromonitor International. Drinking milk products in South Africa. 2013 February. [ Links ]
36. Cochrane K. The doings of a dairy giant. S Afr Food Rev. 2008;35(11):16-20. [ Links ]
37. Brooks N. Danone developments. S Afr Food Rev. 2010;37(11):21-23. [ Links ]
38. Euromonitor International. Yoghurt and sour milk products in South Africa [database on the Internet]. [ Links ] c2013 [cited 2014 Oct 12]. Available from: http://www.portal.euromonitor.com/Portal/Default.aspx
39. Popkin BM. The nutrition transition: An overview of world patterns of change. Nutr Rev. 2004;62(7):140-143. http://dx.doi.org/10.1301/nr.2004.jul.S140-S143 [ Links ]
40. Unilever. Why tea is an all-time favourite [homepage on the Internet]. [ Links ] c2013 [cited 2014 Mar 12]. Available from: http://www.unilever.co.za/brands-in-action/detail/Why-tea-is-an-all-time-favourite/292030/
41. Durham L. Stir up your hot beverage sales. Supermarket & Retailer. 2011 March; p. 37-40. [ Links ]
42. Rolando R. Super food, the spice of life. S Afr Food Rev. 2010;37(6):25-26. [ Links ]
43. Hyslop G. In good health. S Afr Food Rev. 2012;39(4):25-26. [ Links ]
44. Igumbor EU, Sanders D, Puoane T, Tsolekile L, Schwarz C, Purdy C, et al. "Big food," the consumer food environment, health and the policy response in South Africa. PLOS Med. 2012;9(7):1-7. http://dx.doi.org/10.1371/journal.pmed.1001253 [ Links ]
45. Kupka J. Food and beverage industry performs well. S Afr Food Rev. 2010;37(4):18. [ Links ]
46. Euromonitor International. Baked goods in South Africa [database on the Internet]. [ Links ] c2013 [cited 2014 Oct 12]. Available from: http://www.portal.euromonitor.com/Portal/Default.aspx
47. Hillmann J. Bread makers get creative. S Afr Food Rev. 2007;34(7):21-24. [ Links ]
48. Euromonitor International. Biscuits in South Africa [database on the Internet]. [ Links ] c2013 [cited 2014 Oct 12]. Available from: http://www.portal.euromonitor.com/Portal/Default.aspx
49. Solomon N. Democratising the bakers brand to access sales in the informal sector. Food & Beverage Reporter. 2011 May; p. 7-8. [ Links ]
50. Euromonitor International. Breakfast cereals in South Africa [database on the Internet]. [ Links ] c2013 [cited 2014 Oct 12]. Available from: http://www.portal.euromonitor.com/Portal/Default.aspx
51. Fast-moving Consumer Goods (FMCG). Breakfast cereals in South Africa. c2014 [cited 2014 Mar 10]. [ Links ] Available from: http://www.fastmoving.co.za/brand-category/breakfast-cereals-218
52. Eagle J. Canned foods industry in decline [homepage on the Internet]. [ Links ] c2013 [cited 2013 Jul 09]. Available from: http://www.foodproductiondaily.com/Packaging/Canned-foods-industry-in-decline
53. Euromonitor International. Canned/preserved food in South Africa [database on the Internet]. [ Links ] c2013 [cited 2014 Oct 12]. Available from: http://www.portal.euromonitor.com/Portal/Default.aspx
54. Neall B. The sprouting of nature's choice. S Afr Food Rev. 2006;33(3):11-12. [ Links ]
55. Euromonitor International. Sauces, dressings and condiments in South Africa [database on the Internet]. [ Links ] c2013 [cited 2014 Oct 12]. Available from: http://www.portal.euromonitor.com/Portal/Default.aspx
56. Euromonitor International. Frozen processed food in South Africa [database on the Internet]. [ Links ] c2013 [cited 2014 Oct 12]. Available from: http://www.portal.euromonitor.com/Portal/Default.aspx
57. BMI Research. Confectionery and chocolate: SA marketing insights from BMI [homepage on the Internet]. [ Links ] c2011 [cited 2014 Oct 12]. Available from: http://www.foodstuffsa.co.za/food-trends-mainmenu-119/food-trends-2011/1153-confectionery-and-chocolate-sa-market-insights-from-bmi
58. Anonymous. SA's No. 1 choc supplier. S Afr Food Rev. 2009;36(10):32. [ Links ]
59. Euromonitor International. Chocolate confectionery in South Africa [database on the Internet]. [ Links ] c2013 [cited 2014 Oct 12]. Available from: http://www.portal.euromonitor.com/Portal/Default.aspx
60. Rossouw J. The African snack market - Flavouring the world. S Afr Food Rev. 2010;37(5):21. [ Links ]
61. Euromonitor International. Sweet and savoury snacks in South Africa [database on the Internet]. [ Links ] c2013 [cited 2014 Oct 12]. Available from: http://www.portal.euromonitor.com/Portal/Default.aspx
62. Yang Q, Zhang Z, Gregg EW, Flanders WD, Merritt R, Hu FB. Added sugar intake and cardiovascular diseases mortality among US adults. JAMA Intern Med. 2014;174(4):516-524. http://dx.doi.org/10.1001/jamainternmed.2013.13563 [ Links ]
63. Coca-Cola company. Annual review 2012 [document on the Internet]. [ Links ] c2012 [cited 2014 Mar 12]. Available from: http://www.coca-colacompany.com/annual-review/2012/pdf/TCCC_2012_Annual_Review.pdf
64. BMI Research. An eye on SA beverage trends [homepage on the Internet]. [ Links ] c2011 [cited 2014 Mar 19]. Available from: http://www.foodstuffsa.co.za/food-trends-mainmenu-119/food-trends-2011/1391-an-eye-on-sa-beverage-trends-1
65. Hu C. Soft drinks report 2011. S Afr Food Rev. 2011;38(8):32-36. [ Links ]
66. Euromonitor International. Soft drinks in South Africa [database on the Internet]. [ Links ] c2013 [cited 2014 Oct 12]. Available from: http://www.portal.euromonitor.com/Portal/Default.aspx
67. Doria MF. Bottled water versus tap water: Understanding consumers' preferences. J Water Health. 2006;4(2):271-276. [ Links ]
68. Wilk R. Bottled water - The pure commodity in the age of branding. J Consum Cult. 2006;6(3):303-325. http://dx.doi.org/10.1177/1469540506068681 [ Links ]
69. Hyslop G. Anuga 2013 in Cologne. S Afr Food Rev. 2013;40(9):45-46. [ Links ]
70. Popkin BM. Global nutrition dynamics: The world is shifting rapidly toward a diet linked with noncommunicable disease. Am J Clin Nutr. 2006;84:289-298. [ Links ]
71. Bowman, SA, Gortmaker SL, Ebbeling CB, Pereira MA, Ludwig D. Effects of fast-food consumption on energy intake and diet quality among children in a national household survey. Pediatrics. 2004;113:112-117. http://dx.doi.org/10.1542/peds.113.1.112 [ Links ]
72. Anonymous. Food industry to blame for obesity epidemic. S Afr Food Rev. 2012;39(4):22. [ Links ]
 Correspondence:
Lisa-Claire Ronquest-Ross
Department of Food Science
Stellenbosch University, Private
Bag X1, Matieland 7602
South Africa
Email: lisa.ronquest@effem.com
Received: 12 Oct. 2014
Revised: 11 Dec. 2014
Accepted: 12 Dec. 2014

