


Services on Demand
Article
 English (pdf)
 Article in xml format
 Article references
Indicators

Related links
-
 Cited by Google
 -
 Similars in Google
Share

 Permalink
South African Journal of Science
On-line version ISSN 1996-7489
Print version ISSN 0038-2353
S. Afr. j. sci. vol.111 n.7-8 Pretoria Jul./Aug. 2015
http://dx.doi.org/10.17159/SAIS2015/20140169
RESEARCH ARTICLE
Long-term changes and variability in rainfall and streamflow in Luvuvhu River Catchment, South Africa
John O. Odiyo; Rachel Makungo; Tinyiko R. Nkuna
Department of Hydrology and Water Resources, University of Venda, Thohoyandou, South Africa
ABSTRACT
We investigated long-term changes and variability in daily rainfall and streamflow in the Luvuvhu River Catchment, South Africa. Changes and variability in rainfall and streamflow impact on available water resources and the allocation of these resources. Daily rainfall data for six stations and daily streamflow data for four stations for the period 1920/1921-2005/2006 were grouped into cycles of 5 and 10 years. Daily means and standard deviations were computed for each cycle. Standard deviation was used to define the rainfall and streamflow variability. Linear regression was used to compute trends in 5- and 10-year average rainfall and streamflow and their standard deviations. Paired two-tailed t-tests (significance level of 0.05) were carried out to verify the spatial variability of rainfall and streamflow in the study area. Mann-Kendall and linear regression were used to determine trend analyses based on long-term annual rainfall and streamflow data. All but two rainfall stations showed decreasing trends in 5- and 10-year mean rainfall; 10-year mean daily rainfall showed decadal rainfall fluctuations. Contrasting trends were observed in 5- and 10-year mean streamflow, indicating that other factors such as anthropogenic activities and impoundments could be impacting on streamflow. Trend directions identified from Mann-Kendall and linear regression analyses of long-term annual rainfall and streamflow were similar to those identified by linear regression of 5- and 10-year mean daily rainfall. Results of paired two-tailed t-tests verified the spatial variability of rainfall and streamflow in the study area. We have shown that the variability of rainfall and streamflow has increased in the Luvuvhu River Catchment over the 86-year study period.
Keywords: linear regression; Mann-Kendall; trends; climate change; Limpopo Province
Introduction
Increased pressure on natural water systems and artificial water storage systems as a result of a growing population make southern Africa vulnerable to potential changes in the hydrological cycle as a result of global warming, which could lead to extremely negative impacts on societies within this region.1 Studies on long-term changes and variability in rainfall and streamflow are therefore of immense interest in South Africa.
According to Ampitiyawatta and Guo2, precipitation is a good long-term indicator of changes which impact on water resources. Furthermore, changes in precipitation patterns are very important for water resources managers who deal with water resources planning and management. Several studies have been undertaken on rainfall changes in South Africa, including in the Limpopo Province, in which Luvuvhu River Catchment (LRC) is located. Tyson et al.3 noted discernible but specific regional oscillations of 16-20 and 10-12 years, ubiquity of 3-1-year fluctuations and spatially distinctive occurrences of quasi-biennial oscillations, based on analyses of rainfall data from 157 stations across South Africa for the period between 1880 and 1972. Dyer and Tyson4 observed a 20-year oscillation in rainfall for the northeastern parts of South Africa over the period 1910-1972. Dyer and Gosnell5 noted significant long-term oscillations with a mean wavelength of 19.2 years from 18 of the oldest and most reliable rainfall stations within the South African sugar industry. Neither Nicholson6,7 nor Hulme8 identified any trends in the mean annual rainfall over southern Africa for the periods 1900-1970, 1931-1960 and 1961-1990, respectively. Lumsden et al.9 qualitatively analysed potential changes in hydrologically relevant rainfall statistics to determine where convergence existed amongst the different global climate models with respect to changes in rainfall in South Africa. Hydrologically relevant statistics include annual means and variances of the rainfall scenarios, as well as the distribution of daily rainfall amounts. The results of the global climate models evaluated in the study showed that more rainfall was projected for the east of the region while less rainfall was projected along the west coast and the adjacent interior, with the possibility of a slight increase in interannual variability.9
In studies on historical trends in precipitation over southern Africa, Kruger10 reported significant decreases in annual precipitation in northern Limpopo, northeastern Free State, western KwaZulu-Natal and the southeastern regions of the Eastern Cape, and significant increases in precipitation during the wet season in the northern North West Province and an area over the Northern Cape Province, Western Cape Province and Eastern Cape Province. Lynch et al.11 reported a gradual increase in annual rainfall in the Potchefstroom area from 1925 to 1998. A decrease in median annual rainfall in the Limpopo Province over the latter half of the 20th century was reported by Warburton and Schulze12. Dollar and Rowntree13 did not detect long-term changes in the rainfall pattern over the Bell River Catchment in the Eastern Drakensberg of South Africa, but did find annual, seasonal rainfall cycles with variance peaks every 16-19 years.
There is a limited number of studies on long-term changes and variability in streamflow. Fanta et al.14 investigated the variability of river flow for 502 river flow gauging stations in nine countries of the southern African region, including South Africa, with a view to document the spatial variability of the river flow regimes. They found evidence of declining run-off in parts of Zambia, Angola, Mozambique and the highveld in South Africa.
Grenfell and Ellery15 used the coefficient of variation to determine the interannual variations in rainfall and streamflow in the Mfolozi River, South Africa. They found that rainfall and streamflow were highly variable with coefficients of variation for interannual rainfall and streamflow ranging from 22.6% to 36.6% and 61% to 79%, respectively. Research on southern African rainfall trends has focused on annual data series with little information on seasonal or daily data.13 Thus, long-term daily average changes and variability has not been covered extensively. The same applies to long-term daily streamflow changes and variability. Such investigations have yet to be undertaken in the LRC. Our aim in the current study was to investigate long-term changes and variability in rainfall and streamflow in the LRC and to provide additional information on long-term changes and variability in daily rainfall and streamflow on a local scale.
Study area
The LRC is located in the Luvuvhu/Letaba Water Management Area in the Limpopo Province of South Africa. The LRC is located between longitudes 29°49'46.16"E and 31°23'32.02"E and latitudes 22°17'33.57"S and 23°17'57.31''S (Figure 1). It covers a catchment area of 5941 km2. The Luvuvhu River flows for about 200 km through a diverse range of landscapes before it joins the Limpopo River near Pafuri in the Kruger National Park. The mean annual rainfall is 608 mm and the mean annual run-off is 520x106 m3. Topography varies from 200 m to 1500 m (Figure 1) and greatly influences rainfall and run-off distribution in the catchment. The highest rainfall occurs in the upper reaches where the Soutpansberg Mountains are located, with little rainfall in the lower reaches around the Kruger National Park.
Land-use activities in the LRC include forestry, agriculture and settlements. Forestry plantations cover the upper reaches of the Luvuvhu and Latonyanda Rivers, declining towards the Albasini Dam. Land cover in the southern highlands of the LRC is dominated by exotic tree plantations of pines and eucalyptus. Land use in the LRC includes commercial forestry (4%), commercial dry land agriculture (10%), commercial irrigation agriculture (3%), range land (50%), conservation areas (30%) and urban areas (3%).16 According to Griscom et al.17, notable land-cover changes have occurred in the LRC in the northeastern part of South Africa in the past two decades. These changes are linked to human population growth and may be contributing to observed reductions in winter rivers' base flows and increased events of rivers within the Kruger National Park running dry.
Methodology
Daily rainfall data for six rainfall stations for 1931/1932-2005/2006 were obtained from the South African Weather Service and Lynch's18 rainfall database. Daily streamflow data for four stations covering the period 1920/1921-2005/2006 were obtained from the Department of Water and Sanitation. Figure 1 shows the distribution of rainfall and streamflow stations within the study area. It was essential to select stations that were spatially distributed throughout the study area. Stations were also selected based on availability of long-term rainfall data (>30 years) with minimal or no gaps. The World Meteorological Organization19 recommended a period of 30 years or longer as ideal for studies dealing with long-term changes. The selected stations had data from periods ranging from 40-86 years, with gaps in data of less than 5%.
Each rainfall and streamflow data set was divided into 5-year periods (pentads) and 10-year periods (decades). The mean and standard deviation were computed for each pentad and decade for all the stations in order to show the long-term changes and variability, respectively. The standard deviation is one of the most common statistical parameters used to measure overall dispersion (variation) of data20, and has been widely used to study rainfall and/or streamflow variability (examples include the studies of Singh and Mulye21 and Sanz et al.22). Linear regression was used to estimate trends in daily mean rainfall and streamflow over the study period for both the 5- and 10-year cycles. This method fits a regression line to the time series data and the slope indicates whether the trend is strong or not. The null hypothesis is that the slope of the line is zero. Linear regression has been used in a number of trend analysis studies including those of Suppiah and Hennessy23, Schmidli and Frei24 and Cheung et al.25, amongst others. Paired two-tailed f-tests (with a significance level of 0.05) were used to verify if there was a significant difference between the means of rainfall and streamflow for any two stations. The samples were paired between sites based on their periods of record. This approach was useful in verifying the spatial variation of rainfall and streamflow in the study area.
Mann-Kendall was used for trend analyses based on long-term annual rainfall and streamflow data. Mann-Kendall is a rank-based non-parametric test. The null hypothesis (H0) of the test is that there is no trend (the data is independent and randomly ordered) and the alternative hypothesis (H1) is that there is a trend.26 The Mann-Kendall test is a statistical test widely used for the analysis of trends in climatological and hydrological time series.27 It was used together with linear regression to analyse trends in long-term annual rainfall and streamflow data to show comparability of results with the results of linear regression trend analyses based on 5- and 10-year means. This comparison was aimed at showing that the latter method had merit for trend detection, which was essential for the comparison of trends identified with the Mann-Kendall method for which annual data were used. Furthermore, using more than one method for trend analysis improves on the reasonableness of the results.
Results
Rainfall and sfreamflow frends and variability
The ranges of the 5- and 10-year means and standard deviations for rainfall and streamflow data for all stations are provided in Tables 1 and 2. All the results were organised according to hydrological year (October of one year to September of the following year); for example, years 51-56 refers to the hydrological years in the period 1951/1952- 1955/1956. The ranges of the 5- and 10-year rainfall means and standard deviations for each station are comparable. The ranges of the 5- and 10-year means for streamflow are mostly not comparable, although the standard deviation ranges are comparable. The differences in the ranges of 5- and 10-year means for streamflow may be a result of floods which occurred in the pentads 76-81, 91-96 and 96-01 and in the decades 71-81 and 91-01. The major flood events occurred in the hydrological years 1976/1977, 1995/1996 and 1999/2000. Each flood event occurred towards the end of the decade and was not considered in the computation of the pentad mean streamflow preceded by dry cycles. The standard deviation ranges are generally higher than the means for both rainfall and streamflow data, showing high rainfall and streamflow variability in the study area. Fauchereau et al.28 reported that southern Africa's geographical location, steep topography, contrasted oceanic surroundings and atmospheric dynamics are conducive to great interannual variability in the hydrological cycle.


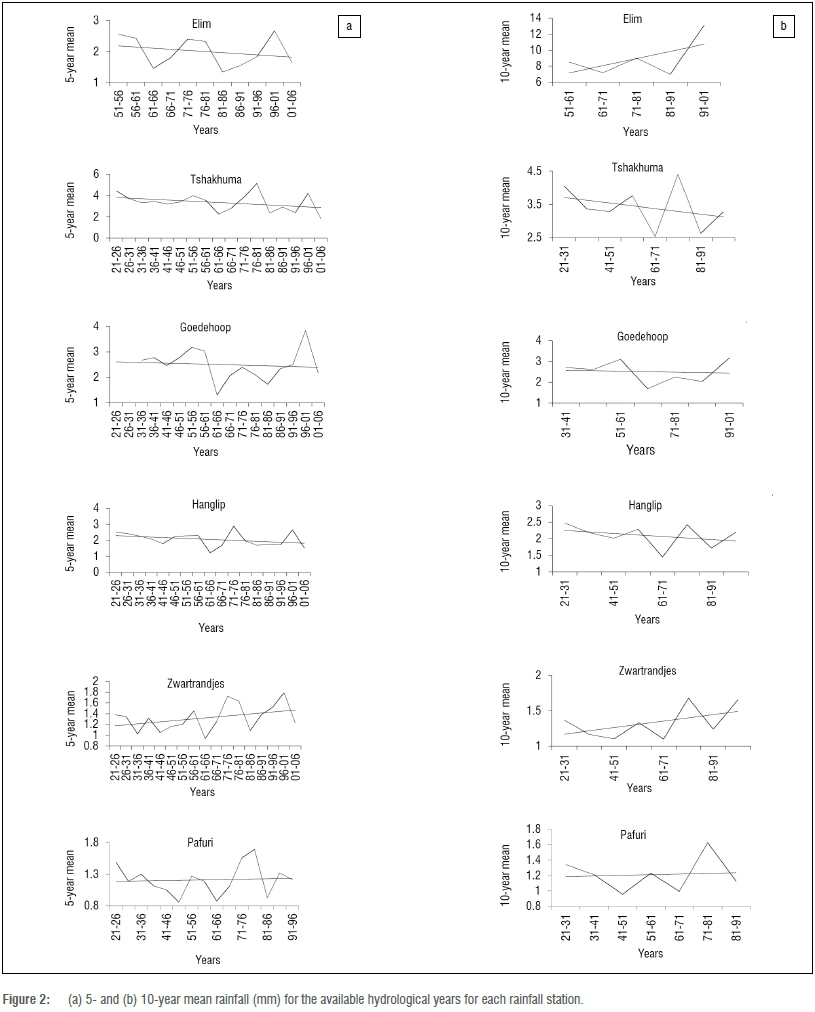
Figure 2 shows the linear regression results for 5- and 10-year rainfall means for Elim, Goedehoop, Hanglip, Tshakhuma, Pafuri and Zwartrandjes rainfall stations. Goedehoop, Hanglip and Tshakhuma rainfall stations show decreasing trends in 5- and 10-year means. Pafuri and Zwartrandjes rainfall stations show increasing trends in 5- and 10-year means. Elim shows a decreasing trend in 5-year mean and an increasing trend in 10-year mean. Trends in rainfall characteristics are likely to be associated with changes in atmospheric circulation patterns,23 which could be impacted by site-specific local effects and contribute to different trends. Others have also attributed changes in African rainfall to Indian Ocean processes and atmospheric features such as the intertropical convergence zone and anticyclones.25 Shongwe et al.29 projected drying rainfall trends in the southern African region, although decade-to-decade rainfall fluctuations were also noted. The 10-year mean daily rainfall shows decadal rainfall fluctuations which is in agreement to that noted by Shongwe et al.29 That droughts are becoming more intense and widespread in South Africa,28 confirms the decreasing trends obtained in this study. Warburton and Schulze12 also reported a decrease in the median annual rainfall over the later half of the 20th century in the Limpopo Province, while Kruger10 noted a significant decrease in annual precipitation in the northern Limpopo Province. Our results are mostly in agreement with these results, despite the fact that trends in the current study were based on mean daily rainfall.
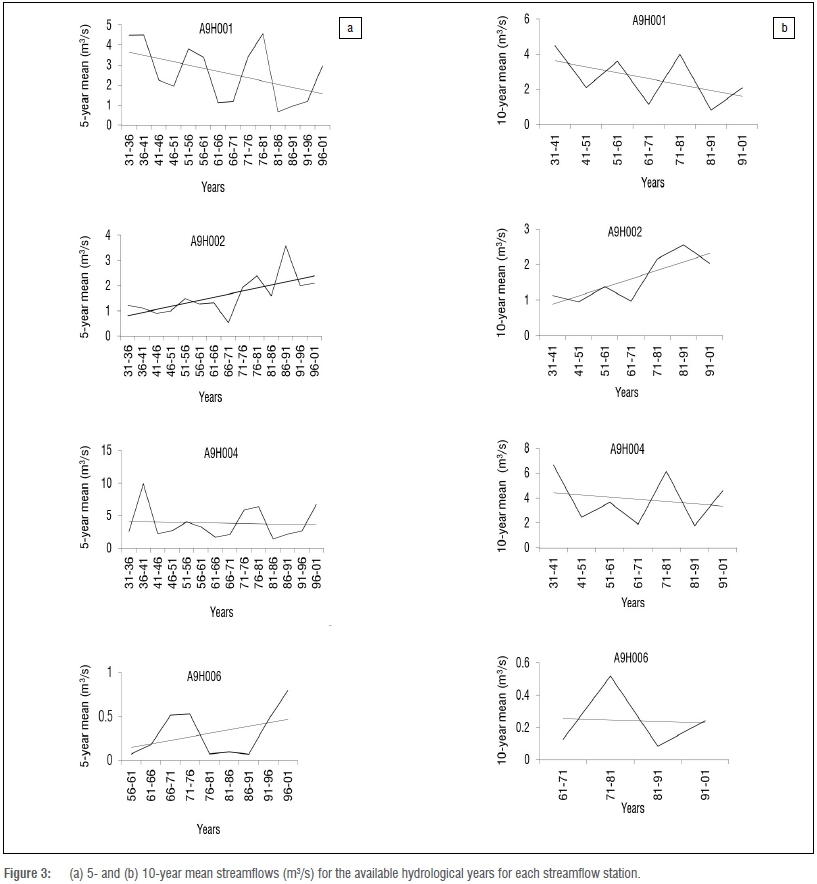
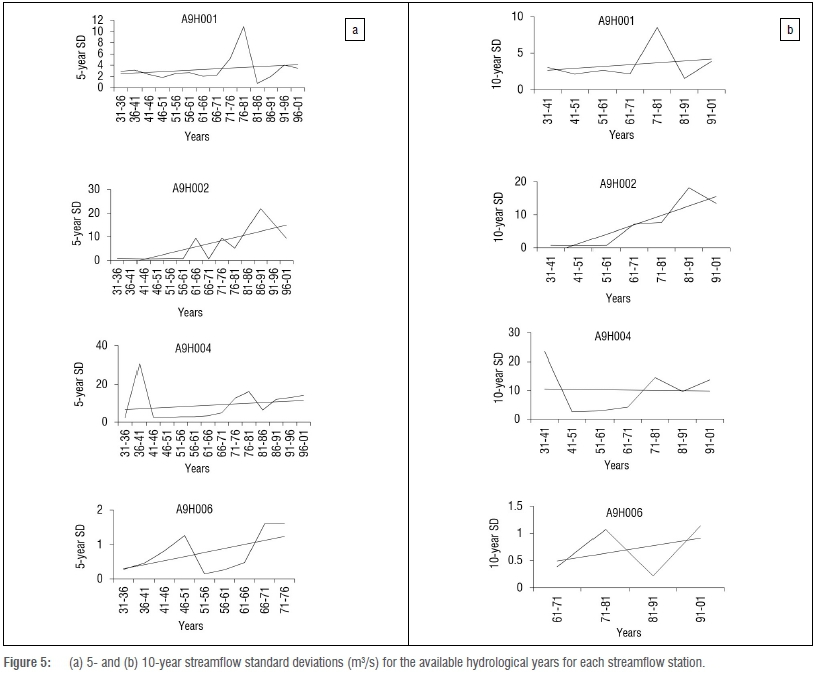
The 5- and 10-year mean streamflows for A9H001, A9H002, A9H004 and A9H006 are provided in Figure 3. A9H001 and A9H004 show decreasing trends in 5- and 10-year mean streamflows, which are associated with decreasing trends in rainfall. A9H002 shows increasing trends in 5- and 10-year means while A9H006 shows an increasing trend in the 5-year mean and almost no trend in the 10-year mean (Figure 3). Contrasting trends in 5- and 10-year mean streamflows indicate that other factors such as anthropogenic activities and impoundments could be impacting on the streamflow. Chunzhen30 noted that detection and attribution of a trend in a hydrological time series are much more difficult because changes in runoff are affected not only by climate factors, but also by non-climate factors, such as increases in water use and water consumption resulting from population growth, economic development, and changes in land use and land cover. These might be the reasons for contrasting trends in streamflow in the study area, as the anthropogenic activities in the area, which include agriculture, afforestation and settlements, occur in the quaternary catchments where each streamflow gauge is located.
Griscom et al.17 reported considerable land-cover changes associated with human population growth and land-use activities such as agriculture, grazing and fuelwood cutting in the LRC. They reported a 12% increase in bare land between 1978 and 2005, which might have resulted in increased streamflows in parts of the catchment. Sambo31 reported a 50% decrease in natural vegetation and a 30% increase in agriculture in the LRC between 1980 and 2010. Irrigation return flows and wastewater discharges into the river may also have increased the streamflows in parts of the river. In 2000, return flows of 5 million and 2 million m3/year from irrigation and urban areas, respectively, were recorded in the LRC. The impact of anthropogenic activities on long-term streamflow changes and trends in the study area requires further investigation. Jewitt et al.32 assessed the hydrological response of nine land-use scenarios in Mutale River quaternary catchment located within the LRC and showed that an increase in forestry to the maximum possible would result in a 7-9% decrease in streamflow. Odiyo et al.33 showed increases in streamflows and their frequency of occurrence in the Luvuvhu River as a consequence of the removal of alien vegetation. The removal of alien vegetation could also have contributed to increased streamflow trends in the LRC. The 10-year mean daily streamflow also shows decadal fluctuations similar to those of mean daily rainfall.
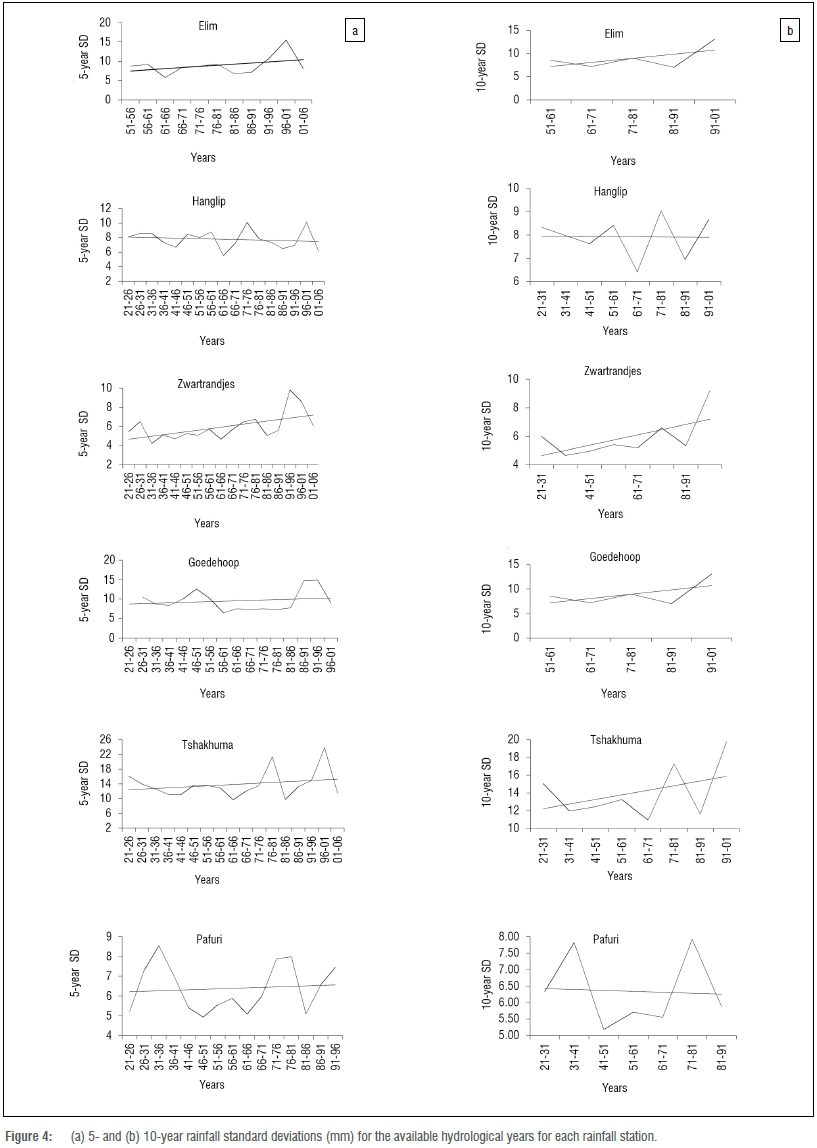
Elim, Goedehoop, Tshakhuma and Zwartrandjes show increases in 5- and 10-year rainfall standard deviations (Figure 4). Hanglip station shows no significant changes in rainfall standard deviations while Pafuri station shows a slight increase and decrease in 5- and 10-year rainfall standard deviations, respectively. All streamflow stations show increasing trends of 5- and 10-year standard deviations, except for station A9H004 which shows a slightly decreasing trend for the 10-year standard deviation (Figure 5). Thus the results mostly indicate increased variability of rainfall and streamflow. Reason and Rouault34 reported the connection of ENSO-like decadal variability in South African rainfall. Figures 2-5 show 10-year cyclic increases and decreases in mean and standard deviation for all rainfall and streamflow stations. These findings show that the decadal or pentad rainfall trends and variations influence decadal or pentad streamflow trends and variations, as rainfall is one of the major drivers of run-off generation in a catchment.
Statistical significance of 5- and 10-year means
The differences in the 5- and 10-year rainfall means for Zwartrandjes station vary from not significant (p>0.05) to extremely significant (p<0.001), with the latter dominating compared with those of all the other stations (Table 3). The difference in 5- and 10-year means for Hanglip and Tshakhuma, and Hanglip and Zwartrandjes stations, is also extremely significant. There is no statistically significant difference in the 5- and 10-year means for Hanglip and Elim stations. The differences in the 5-year means for Goedehoop and Hanglip, and Tshakhuma and Elim are extremely significant (p<0.001), while those of Goedehoop and Tshakhuma, and Goedehoop and Elim are very significant (0.001<p<0.01). The differences in the 10-year means for Goedehoop and Hanglip and Goedehoop and Tshakhuma are significant (0.01<p<0.05) while the difference between the 10-year means of Tshakhuma and Elim stations is very significant (0.001<p<0.01). The significant differences in the 5- and 10-year means for the majority of the stations, some of which are highlighted above, verify the highly variable nature of rainfall in the study area, as do the results of the 5- and 10-year standard deviation comparisons.

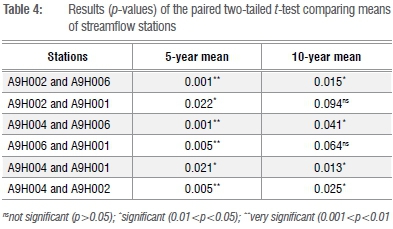
The differences in the 5- and 10-year means for A9H004 and A9H001 and 5-year mean for A9H002 and A9H001 are significant (Table 4). The differences in the 5-year means for A9H002 and A9H006, A9H004 and A9H006, A9H006 and A9H001, and A9H004 and A9H002 are very significant while the 10-year means for A9H002 and A9H006, A9H004 and A9H006, and A9H004 and A9H002 are significant (0.01<p<0.05) (Table 4). There were no statistically significant differences in the 10-year means for A9H002 and A9H001, and A9H006 and A9H001. The results show significant differences in the mean values between different stations in the majority of cases, thus verifying the spatial variability in streamflow. However, the differences in the 5- and 10-year mean streamflows for different stations are not as highly pronounced as those for rainfall, indicating that the spatial variability of rainfall is higher than that of streamflow.
Trends for total annual rainfall and streamflow
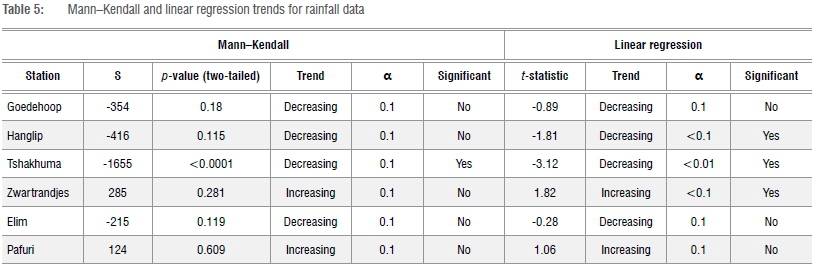
The Mann-Kendall and linear regression trend analysis results for rainfall are shown in Table 5. The Kendall statistic (S) was used to identify the direction of the trend. A positive value of S indicates an upward trend and a negative value of S indicates a downward trend.35 Positive and negative signs of the t-statistic indicate increasing and decreasing trends, respectively.36 Goedehoop, Hanglip, Tshakhuma and Elim showed downward (decreasing) rainfall trends according to both Mann-Kendall and linear regression analyses. However, Zwartrandjes and Pafuri stations showed upward (increasing) trends in rainfall. These results are similar to those obtained by linear regression analysis of 5- and 10-year means, indicating that 5- and 10-year means can be used in trend detection. None of the identified trends is statistically significant except for Tshakhuma - the only station that shows a statistically significant trend based on Mann-Kendall analysis. Based on linear regression analysis, three stations - Hanglip, Tshakhuma and Zwartrandjes - show statistically significant trends.
Table 6 shows Mann-Kendall and linear regression results for streamflow stations. A9H001 and A9H002 show decreasing trends, which are statistically significant, while A9H004 and A9H006 show increasing trends that are not statistically significant. Similarity in trend directions identified from both Mann-Kendall and linear regression methods support the use of 5- and 10-year means, as the results are mostly comparable. Thus, the results obtained from the use of 5- and 10-year means for trend detection are realistic, as they are comparable to those of established scientific or statistical methods.
Conclusion
We investigated long-term changes and variability in rainfall and streamflow in the LRC. The 5- and 10-year long-term means and standard deviations, linear regression and Mann-Kendall were used to show the long-term trends and variability. Most of the rainfall stations show decreasing trends in 5- and 10-year mean rainfall; Zwartrandjes and Pafuri stations show increasing trends. Elim station shows an increasing trend in 10-year mean. In agreement with other studies undertaken in the Limpopo Province, 10-year mean daily rainfall shows decadal rainfall fluctuations.
Streamflow stations show contrasting trends in 5- and 10-year mean streamflows, indicating that other factors such as anthropogenic activities and impoundments could be impacting on streamflow. The impact of anthropogenic activities on long-term streamflow changes and variability in the study area requires further investigation. Chunzhen30 noted that it is important to separate natural climate variability from anthropogenic variability in historical data of hydrometeorological observations for a long-term period. Such a study should be carried out in the current study area. Most rainfall and streamflow stations show increasing trends for 5- and 10-year standard deviations. The results of the study thus, generally, show increased variability of rainfall and streamflow, which increases the variability of the available water resources. The statistically significant differences in the 5- and 10-year means for the majority of the rainfall and streamflow stations verify the highly variable nature of rainfall and streamflow in the study area and hence verify the results of the 5- and 10-year standard deviations. The decadal or pentad rainfall trends and variations influence decadal or pentad streamflow trends and variations as rainfall is one of the major drivers of run-off generation in a catchment. Trend directions identified from long-term annual rainfall and streamflow from Mann-Kendall and linear regression analyses were similar to those identified from linear regression analysis for 5- and 10-year mean daily rainfall, suggesting that the latter approach can be applied for trend analysis.
This simple method based on statistical analysis of available rainfall and streamflow data has clearly demonstrated climate change in the study area. Cheung et al.25 demonstrated how the use of simple statistical analyses of historical rain gauge data can be used to accurately characterise rainfall. The method we used in the current study is therefore highly recommended for trend and variability detection in rainfall and streamflow in situations in which daily long-term data are available.
Acknowledgements
We thank the South African Weather Service and the Department of Water Affairs for providing data used in this study.
Authors' contributions
J.O.O. made conceptual contributions, performed the paired two-tailed t-tests and revised the edited manuscript. R.M. calculated the 5- and 10-year standard deviations, plotted the graphs, performed the linear regression analyses based on the annual data and edited the manuscript. T.R.N grouped daily rainfall and streamflow data into 5- and 10-year cycles, calculated the means and performed the linear regressions for 5- and 10-year cycles and the Mann-Kendall analysis.
References
1. Schulze R, Meigh J, Horan M. Present and potential future vulnerability of eastern and southern Africa hydrology and water resources. S Afr J Sci. 2001;67:150-160. [ Links ]
2. Ampitiyawatta AD, Guo S. Precipitation trends in the Kalu Ganga Basin in Sri Lanka. J Agric Sci. 2009;4(1):10-18. [ Links ]
3. Tyson PD, Dyer TGJ, Mametse MN. Secular changes in South African rainfall: 1880 to 1972. Quart J Roy Meteor. 1975;101:817-833. http://dx.doi.org/10.1002/qj.49710143008 [ Links ]
4. Dyer TGJ, Tyson PD. Estimating above and below normal rainfall period over South Africa 1972-2000. J Appl Meteorol. 1977;16:145-147. http://dx.doi.org/10.117/1520-0450(1977)016<0145:EAABNR>2.0.CO;2 [ Links ]
5. Dyer TGJ, Gosnell JM. Long term rainfall trends in the South African Sugar Industry. Proceedings of the South African Sugar Technologists' Association. 1978:206-213. [ Links ]
6. Nicholson SE. The nature of rainfall variability in Africa south of the equator. J Climatol. 1986;6:515-530. http://dx.doi.org/10.1002/joc.3370060506 [ Links ]
7. Nicholson SE. Long-term changes in African rainfall. Weather. 1989;44:46-56. http://dx.doi.org/10.1002/j.1477-8696.1989.tb06977.x [ Links ]
8. Hulme M. Rainfall changes in Africa: 1931-1960 to 1961-1990. Int J Climatol. 1992;12:685-699. http://dx.doi.org/10.1002/joc.3370120703 [ Links ]
9. Lumsden TG, Schulze RE and Hewitson BC. Evaluation of potential changes in hydrologically relevant statistics of rainfall in southern Africa under conditions of climate change. Water SA. 2009;35(5):646-656. http://dx.doi.org/10.4314/wsa.v35i5.49190 [ Links ]
10. Kruger AC. Observed trends in daily precipitation indices in South Africa: 1910-2004. Int J Climatol. 2006;26:2275-2285. http://dx.doi.org/10.1002/joc.1368 [ Links ]
11. Lynch SD, Zulu JT, King KN, Knoesen DM. The analysis of 74 years of rainfall recorded by the Irwins on two farms south of Potchefstroom. Water SA. 2001;27:459-564. http://dx.doi.org/10.4314/wsa.v27i4.4970 [ Links ]
12. Warburton M, Schulze RE. Historical precipitation trends over southern Africa: A hydrology perspective. In: Schulze RE, editor. Climate change and water resources in southern Africa: Studies on scenarios, impacts, vulnerabilities and adaptation. WRC report no. 1430/1/05. Pretoria: Water Research Commission; 2005. p.326-338. [ Links ]
13. Dollar ESJ, Rowntree KM. Hydroclimatic trends, sediment sources, and geomorphic resources in the Bell River Catchment, Eastern Cape Drakensberg, South Africa. S Afr Geogr J. 1995;77(1):21-32. http://dx.doi.org/10.1080/03736245.1995.9713585 [ Links ]
14. Fanta B, Zaake BT, Kaachroo RK. A study of variability of annual river flow of the southern African region. Hydrolog Sci J. 2001;46:513-524. http://dx.doi.org/10.1080/02626660109492847 [ Links ]
15. Grenfell SE, Ellery WN. Hydrology, sediment transport dynamics and geomorphology of a variable flow river: The Mfolozi River, South Africa. Water SA. 2009;35(3):271-282. [ Links ]
16. Hope RA, Jewitt GPW, Gowing JW. Linking the hydrological cycle and rural livelihoods: A case study in the Luvuvhu catchment, South Africa. Phys Chem Earth. 2004;29:1209-1217. http://dx.doi.org/10.1016/j.pce.2004.09.028 [ Links ]
17. Griscom HR, Miller SN, Gyedu-Ababio T, Sivanpillai R. Mapping land cover change of the Luvuvhu catchment, South Africa for environmental modeling. GeoJournal. 2010;75:163-173. http://dx.doi.org/10.1007/s10708-009-9281-x [ Links ]
18. Lynch SD. Development of a raster database of annual, monthly and daily rainfall for southern Africa. WRC report no. 1156/1/04. Pretoria: Water Research Commission; 2004. [ Links ]
19. World Meteorological Organization (WMO). Technical publication no. 335: Compendium of lecture notes in Climatology for class III meteorological personnel. Geneva: WMO; 1976. [ Links ]
20. An H, Eheart JW, Braatz RD. Stability-oriented programs for regulating water withdrawals in riparian regions. Water Resour Res. 2004;40:W12301. [ Links ]
21. Singh N, Mulye SS. On the relations of the rainfall variability and distribution with the mean rainfall over India. Theor Appl Climat. 1991;44(3&4):209-221. http://dx.doi.org/10.1007/BF00868176 [ Links ]
22. Sanz DB, Sacristan MM, Rubial GC. The natural variability approach, application to five rivers in the Ebro Basin, Spain. Environ Econ. 2011;2(2):107-121. [ Links ]
23. Suppiah R, Hennessy KJ. Trends in total rainfall, heavy rain events and number of dry days in Australia, 1910-1990. Int J Climatol. 1998;10:1141-1164. http://dx.doi.org/10.1002/(SICI)1097-0088(199808)18:10<1141::AID-JOC286>3.0.CO;2-P [ Links ]
24. Schmidli J, Frei C. Trends of heavy precipitation and wet and dry spells in Switzerland during the 20th century. Int J Climatol. 2005;25:753-771. http://dx.doi.org/10.1002/joc.1179 [ Links ]
25. Cheung WH, Senay GB, Singh A. Trends and spatial variation of seasonal and annual rainfall in Ethopia. Int J Climatology. 2008;28:1723-1734. http://dx.doi.org/10.1002/joc.1623 [ Links ]
26. Onoz B, Bayazit M. The power of statistical tests for trend detection. Turkish J Eng Env Sci. 2003;27:247-251. [ Links ]
27. Bawden AJ, Linton HC, Burn DH, Prowse TD. A spatiotemporal analysis of hydrological trends and variability in the Athabasca River region, Canada. J Hydrol. 2014;509:333-342. http://dx.doi.org/10.1016/j.jhydrol.2013.11.051 [ Links ]
28. Fauchereau N, Trzaska S, Rouault M, Richard Y Rainfall variability and changes in southern Africa during the 20th century in the global warming context. Nat Hazards. 2003;29:139-154. http://dx.doi.org/10.1023/A:1023630924100 [ Links ]
29. Shongwe ME, Van Oldenborgh GJ, Van den Hurk BJJM, De Boer B, Coelho CAS, Van Aalst MK. Projected changes in mean and extreme precipitation in Africa under global warming. Part I: Southern Africa. J Climate. 2009;22(13):3819-3897. http://dx.doi.org/10.1175/2009JCLI2317.1 [ Links ]
30. Chunzhen L. Research advances in impacts of natural climate variability and anthropogenic climate change on streamflow. Adv Clim Change Res. 2009;5:47-53. [ Links ]
31. Sambo SP. An investigation of the impacts of land use change on streamflow of the Luvuvhu River Catchment in the Limpopo Province of South Africa [honour's dissertation]. Thohoyandou: University of Venda; 2012. [ Links ]
32. Jewitt GPW, Garratt JA, Calder IR, Fuller L. Water resources planning and modelling tools for the assessment of land use change in the Luvuvhu Catchment, South Africa. Phys Chem Earth. 2004;29:1233-1241. http://dx.doi.org/10.1016/j.pce.2004.09.020 [ Links ]
33. Odiyo JO, Makungo R, Maumela D. Impact of alien vegetation clearance on hydrology of Luvuvhu River Catchment. Paper presented at: 11th WaterNet/ WARFSA/GWP-SA Symposium on Integrated Water Resources Management for National and Regional Integration. 2010 October 27-29; Victoria Falls, Zimbabwe. p. 551-569. [ Links ]
34. Reason CJC, Rouault M. ENSO-like decadal variability and South African rainfall. Geophys Res Lett. 2002;29(13):16-1-16-4. [ Links ]
35. Motulsky H. Prism 5 Statistics Guide Version 5.0. San Diego, CA: GraphPad Software Inc.; 2007. [ Links ]
36. Nury AH, Koch M, Md Alam JB. Analysis and prediction of time series variations of rainfall in North-Eastern Bangladesh. Brit J Appl Sci Technol. 2014;4(11):1644-1656. http://dx.doi.org/10.9734/BJAST/2014/7722 [ Links ]
 Correspondence:
John Odiyo
Department of Hydrology and
Water Resources, University
of Venda, Private Bag X5050
Thohoyandou 0950
South Africa
Email: john.odiyo@univen.ac.za
Received: 23 May 2014
Revised: 21 Sep. 2014
Accepted: 22 Oct. 2014

