


Serviços Personalizados
Artigo
 Inglês (pdf)
 Artigo em XML
 Referências do artigo
Indicadores

Links relacionados
-
 Citado por Google
 -
 Similares em Google
Compartilhar

 Permalink
South African Journal of Science
versão On-line ISSN 1996-7489
versão impressa ISSN 0038-2353
S. Afr. j. sci. vol.111 no.5-6 Pretoria Mai./Jun. 2015
http://dx.doi.org/10.17159/sajs.2015/20140193
RESEARCH ARTICLE
Eutrophication and cyanobacteria in South Africa's standing water bodies: A view from space
Mark W. MatthewsI, II; Stewart BernardII, III
ICyanoLakes (Pty) Ltd., Cape Town, South Africa
IIDepartment of Oceanography, University of Cape Town, Cape Town, South Africa
IIICouncil for Scientific and Industrial Research - Earth Systems Earth Observation, Cape Town, South Africa
ABSTRACT
Satellite remote sensing can make a significant contribution to monitoring water quality in South African standing water bodies. Eutrophication, defined as enrichment by nutrients, and toxin-producing cyanobacteria (blue-green algae) blooms pose a significant threat to the quality of South African surface water bodies. The status and trends of chlorophyll a (chl-a, a proxy for eutrophication), cyanobacterial blooms and cyanobacterial surface scum were determined for South Africa's 50 largest water bodies between 2002 and 2012, using a recently developed algorithm and 10 years of data from the Medium Resolution Imaging Spectrometer (MERIS) satellite. The majority (62%) of the 50 water bodies were highly nutrient enriched or hypertrophic, while 26 had cyanobacterial blooms which posed a high health risk from surface scums. This study is the first of its kind to provide quantitative water quality information for South Africa's water bodies from a time series of satellite remotely sensed data. We demonstrate the pivotal role that satellite remote sensing can play in greatly supplementing in-situ monitoring efforts such as the National Eutrophication Monitoring Programme. The finding that many water supply bodies are severely impacted by eutrophication and cyanobacterial blooms confirms that these remain issues of critical concern for water security and supply in South Africa.
Keywords: water quality; remote sensing; MERIS satellite; turbidity
Introduction
Eutrophication and cyanobacteria in South Africa
Water is a critical resource in South Africa and is of considerable importance for ensuring sustained economic growth and development. Water of sufficient quality and quantity is required to meet basic human needs and also the demands of agriculture, industry and conservational and ecosystem uses. The National Water Act1is the overarching framework setting forth how South Africa's water resources should be distributed, managed and protected. Under the Act, water quality guidelines are promulgated for potable (domestic), industrial, agricultural, recreational and other uses. These guidelines specify the minimum quality requirements to meet the intended use. Water quality can be specified in terms of chemical composition, biological composition (e.g. algae), microbiological composition and physical condition (e.g. clarity or temperature). Poor water quality constitutes a risk to human health and safety through waterborne diseases and reduced visibility, and has negative aesthetic and economic impacts that increase the cost of treatment.2 Poor water quality is 'one of the major threats to South Africa's capacity to provide sufficient water...to meet its needs and ensure environmental sustainability'3. According to South Africa's water policy:
Ongoing monitoring and assessment [is] critical to our ability to manage and protect [water] resources on the basis of sound scientific and technical information and understanding. Adequate information is essential for effective resource management and protection.4
Therefore there is substantial impetus for taking measures to assess, maintain and protect water quality, through using advanced tools such as remote sensing.
South Africa's limited freshwater surface waters are vulnerable to environmental degradation, in particular from eutrophication.5 Eutrophication refers to the process of nutrient enrichment of water primarily from effluent and agricultural sources of nitrogen and phosphorus. The trophic status of water refers to the degree to which it is nutrient enriched. A water body may be classified as 'oligotrophic' (little nourished), 'mesotrophic' (medium nourished), 'eutrophic' (well nourished) or 'hypertrophic' (very well nourished). Eutrophic and hypertrophic waters suffer from a wide range of negative impacts including increased phytoplankton blooms, turbid water conditions, increased cyanobacteria (blue-green algae), taste and odour problems, oxygen depletion (anoxia), increased incidence of fish kills, loss of biodiversity and decreased aesthetic value. Cyanobacteria thrive in eutrophic water and pose a problem for water treatment through dense cell accumulation; some species pose a health risk as a result of the production of intracellular toxins that are fatal when ingested in large quantities by humans or other animals. Dense surface accumulations of cyanobacteria (called surface scums) have significant negative ecological consequences on the diversity and functioning of the plankton community and higher order organisms, and are a high-risk health threat for recreational and other water users.6,7 Surface scums are also an important ecological indicator of over-enrichment and meteorological warming and senescence.8
It has been estimated that eutrophic conditions exist in one in five of 75 major impoundments9 and in 18 of 25 major river catchments10. According to data collected by the National Eutrophication Monitoring Programme (NEMP) of the Department of Water Affairs between April and September 2013, approximately 28% of surface water samples are hypertrophic, 33% are eutrophic, 37% are mesotrophic and only 3% are oligotrophic.11 Cyanobacteria, including Microcystis and Anabaena species, are present in all major impoundments at levels dependent on the trophic state.12-14 Poisonings of domestic and wild animals by cyanobacterial toxins are geographically widespread and occur frequently.15 These toxic blooms are 'a threat to the supply of safe drinking water to the whole population of South Africa'14.
The severity of eutrophication and cyanobacterial blooms is an economic burden on South Africa because of: the costs associated with water treatment; negative effects on water-side property values; recreational and tourism losses as a result of users' negative perceptions of water quality; negative human health impacts from poor water quality including diarrhoea, cholera and waterborne diseases; animal fatalities; poor aquatic ecology negatively affecting ecosystem services; reduced biodiversity and proliferation of invasive species; and the cost of management and control of aquatic macrophytes (e.g. water hyacinth).16 The economic cost of eutrophication is likely to extend to hundreds of millions of rands per year, being borne across all levels of society, but particularly affecting the livelihoods and health of the poor and vulnerable. This estimation is substantiated by studies in the USA and Great Britain in which it was found that the cost of eutrophication was greater than USD2.2 billion per year in 200917, and USD160 million per year in 200318, respectively.
Why satellite remote sensing?
South Africa's national monitoring systems are required to provide information on the quality and health of aquatic ecosystems and to assess compliance with quality objectives and progress of measures for rehabilitation.1 The NEMP collects and analyses surface water samples from around 160 dams, lakes and rivers nationally on a nearly monthly basis. Point samples are analysed for chlorophyll-a concentration, phytoplankton type, chemical parameters nitrogen and phosphorus and the Secchi disk depth. The NEMP success story is under pressure from rising costs of sampling, the need to constantly sample more widespread locations, the uneven geographical distribution and capabilities of laboratories, the high rate of human capital overturn and limited budget allocations. There remain large information gaps regarding the trophic status and presence and severity of cyanobacterial blooms in South African water bodies which constitutes a risk to public health. The very large number of artificial impoundments (497 reservoirs with a capacity larger than one million cubic metres16) makes comprehensive monitoring using conventional methods an almost impossible task.
Satellite remote sensing can substantially contribute to alleviating some of the challenges faced by the NEMP through: supplementing in-situ surface monitoring; maximising the potential of the NEMP database and networks; monitoring geographically widespread locations; streamlining in-situ sampling operations leading to long-term cost savings; and providing retrospective and near-real-time information (Cele S 2014, oral communication, February 12). The integration of satellite remote sensing into the NEMP can enable resources to be more effectively utilised for the management, assessment and monitoring of eutrophication, and also reduce the risks associated with cyanobacterial blooms and surface scums through near-real-time response and warning systems.
Recent advances, new possibilities
Recent advances in space technology and ongoing research on water remote sensing in South Africa have made systematic monitoring of eutrophication and cyanobacterial blooms in small inland water bodies from space a reality.19,20 The Medium Resolution Imaging Spectrometer (MERIS) satellite, which operated from 2002 until April 2012, had a spatial resolution of 260 m by 290 m, an acquisition frequency of 2 to 3 days, and 15 spectral bands ideally positioned for water-related applications. These specifications, not offered by current high spatial resolution satellites (e.g. Landsat or SPOT), coupled with the recent development of novel algorithms for detecting chlorophyll-a (chl-a) and cyanobacteria20 have allowed MERIS data to be exploited for near-real-time monitoring (see http://www.afro-sea.org.za/php/damSearch. php for demonstration system). The most recent research reported on here includes a time series from 2002 to 2012 of eutrophication and cyanobacterial blooms in South Africa's 50 largest water bodies.21 The coming launch of the Sentinel-3 mission in 2015 will ensure that MERIS-equivalent data is freely available from 2016 onwards until at least 2026. These data - along with those from other water-observing satellite missions to be launched in the near future, such as the high spatial resolution Sentinel-2 mission - will make satellite remote sensing an indispensable tool for monitoring small inland water bodies.
Aims and objectives
In this paper, we present additional results from a retrospective study21 using 10 years of MERIS data to assess eutrophication and cyanobacterial blooms in 50 of South Africa's largest water bodies. We present case studies illustrating the usage of MERIS data for monitoring algal blooms, cyanobacterial blooms and surface scums. The robustness of the satellite estimates are demonstrated using a comparison between satellite estimates and data collected in situ through the NEMP. A summary is presented of the status and trends of eutrophication and the occurrence of cyanobacterial blooms and surface scum for the water bodies; and a scoring system is used to identify those water bodies in the most urgent need of management attention. Our intention is to illustrate the power of satellite remote sensing applied to small South African inland water bodies, and the potential application from both past and future satellite instruments.
Methods
Water-quality assessments from satellite remote sensing are restricted to surface water visible from space. Parameters that can be directly retrieved from remote sensing are limited to those that effect a change in the colour of the water in the visible and near infra-red light spectrum. Variables defined in the water-quality guidelines directly retrievable from remote sensing include phytoplankton measured by the concentration of chl-a, the dominant phytoplankton group, water clarity measured by Secchi disk or turbidity, total non-dissolved suspended solids and nuisance plants (macrophytes). These variables are essential for assessing water quality for various uses especially agriculture, recreation and ecological uses.
The 50 largest water bodies by surface area in South Africa were selected for the analysis. The data set excluded water bodies that were too narrow (<600 m) or had prolonged dry periods, and estuaries subject to tidal influence. The MERIS full-resolution data archive (approximately 20 Tb) over southern Africa was acquired. The data were available for the period between 2002 and April 2012 after which MERIS ceased collecting data. The details of the methods used to process the data and perform the time series analysis can be found in Matthews21. The chl-a and cyanobacterial products were computed using an algorithm (called the maximum peak height or MPH algorithm) recently developed for use in small South African inland and coastal waters.20 The algorithm is the first of its kind to provide quantitative chl-a estimates for oligotrophic and hypertrophic waters and to discriminate between cyanobacteria and other phytoplankton blooms. Cases of potential cyanobacterial surface scum formation, which poses a high health risk, were identified by cyanobacteria with 753 nm reflectance peak positions or chl-a concentrations greater than 350 mg/m3. This value is near the minimum at which the typical vegetation-like scum spectra might be observed22; however, scum may exist at even lower biomass. This definition does not include all high-risk cyanobacterial blooms which exist for chl-a concentrations greater than 50 mg/m3.7
The precise time and location of in-situ NEMP chl-a data were not recorded. Therefore satellite data used for comparison with these data were extracted from the position corresponding with the most likely location of sampling using the mean value for ±10 pixels. Only same-day matchups were used. Water bodies that had very few matchups or poor correlations (likely because of spatial mismatch) were excluded.
The 50 water bodies were scored using a classification scheme. The score for chl-a was from 0 to 3, where 0 was for oligotrophic and 3 was for hypertrophic classes (see below for thresholds). Similar classes were determined for cyanobacteria coverage (0 to 1%, 1 to 10%, 10 to 30% and greater than 30%) and scum (0 to 1%, 1 to 5%, 5 to 10% and greater than 10%) and each class was scored between 0 and 3 from least to most impacted. The thresholds were determined after examining the data distributions. While the thresholds of the classes are somewhat arbitrary, they can help in identifying those water bodies which are most impacted by eutrophication, cyanobacterial blooms and surface scum, although the management priority for each of these variables may not be equal. The overall score (between 0 and 9) for each water body was computed as the sum of the scores for the three variables.
Results
A view from space: Case studies
Ceratium hirundinella blooms in Albert Falls Dam
Hart and Wragg23 first reported on the occurrence of C. hirundinella blooms at Albert Falls in 2006. The study included a detailed survey of the lake in October 2006 and January 2007 for which maps of the spatial distribution of chl-a were produced. The satellite imagery shows nearly identical values and spatial distribution of chl-a to the maps produced from interpolating in-situ samples (Figure 1). The clearer conditions that existed in January 2007 towards the main basin of the reservoir are vividly reproduced in the satellite observations, as are the high biomass C. hirundinella blooms towards the inflow in the southeast. The values estimated from the satellite compare closely with those measured in situ, with a maximum value towards the inflow near 200 mg/m3 and satellite lake averages between 7.4 mg/m3 and 19.5 mg/m3 compared to in-situ lake averages for October and January of 11.7 mg/m3 and 16.4 mg/m3, respectively. There is a general correlation between a time series of satellite and in-situ observations for Albert Falls Dam (Figure 2). In particular, the Ceratium bloom events of spring/summer 2004 and winter 2006 are reproduced, as recorded in Hart and Wragg23. The satellite data suggest that Ceratium blooms occur periodically, coinciding with summer.


Winter cyanobacterial blooms in Midmar Dam
Winter cyanobacterial blooms that occurred in Midmar Dam in 2005 were first reported by Oberholster and Botha24. Winter maxima of cyanobacteria are not expected because cyanobacteria are known to generally favour water temperatures greater than 20 °C. However, recent satellite observations have shown that several South African water bodies have winter cyanobacterial blooms.21 The explanation for winter cyanobacterial blooms could be related primarily to increased nutrient availability (nitrogen), tentatively attributed to large populations of waterfowl.24 It is possible that the same explanation might be given for the observation of winter cyanobacterial blooms in perennial lakes in the semi-arid eastern summer rainfall region of South Africa, which serve as a refuge for waterfowl during the dry winter months.25,26 The winter cyanobacterial blooms identified by Oberholster and Botha24 were also identified from MERIS (Figure 3). The cyanobacteria flag was raised for certain pixels (coloured green) towards the shoreline (indicated by arrows). The location of the cyanobacterial detection corresponds closely with the observations of Oberholster and Botha24. This finding demonstrates the great sensitivity of the satellite data for detecting cyanobacterial blooms.
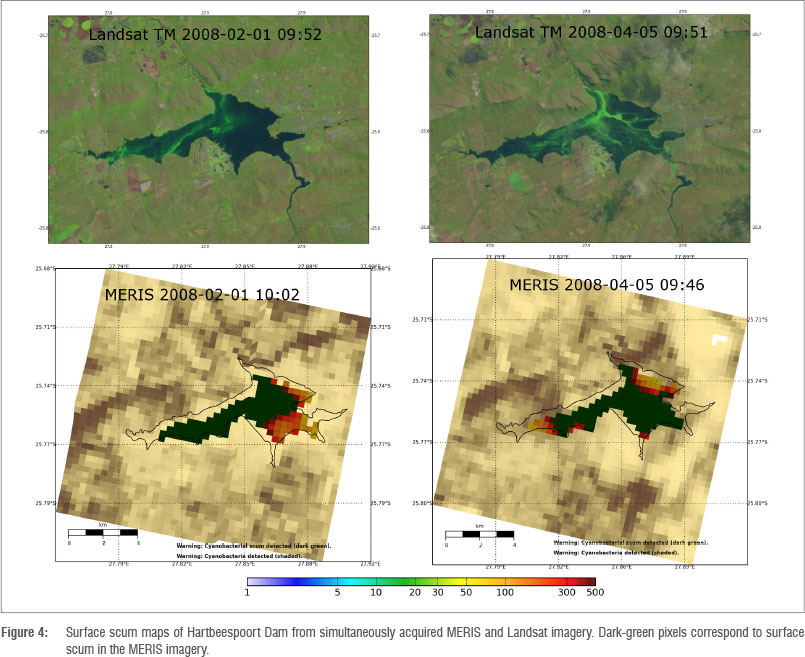
Microcystis surface scum in Hartbeespoort Dam
Hartbeespoort Dam is renowned worldwide for its extremely high biomass blooms of Microcystis aeruginosa cyanobacteria and the formation of surface scums which are often toxic (also called hyperscums27). The optical characteristics of M. aeruginosa blooms have recently been investigated in detail.28 Oberholster and Botha29 usedLandsat satellite imagery to observe these hyperscums and surface scum accumulations. These surface scums were also identified from MERIS21. MERIS data acquired 10 min or less apart from Landsat imagery is used to demonstrate the detection of scum (Figure 4). Surface scums appear as bright green slicks on the water surface in the true colour Landsat imagery,29 and are coloured dark green for pixels in the MERIS scenes. The simultaneously acquired Landsat and MERIS scenes have very similar spatial patterns which verify the accuracy of scum detection from the lower spatial resolution MERIS data.
Comparison with National Eutrophication Monitoring Programme data
Sufficiently good matchup data were found for six water bodies. In general, there is a close similarity between the chl-a estimates from the satellite and those from the NEMP (Figure 2). The magnitudes and periodic occurrence of bloom events are closely reproduced for Hartbeespoort Dam, showing the clearer water periods which occurred in the winter months of 2004, 2005 and 2011. The magnitudes of chl-a determined from satellite data of Midmar Dam are generally slightly lower than those measured in situ. This difference could be a result of the location used to collect samples. The satellite estimates for Inanda Dam closely match the seasonal variability in in-situ measurements of chl-a which have very similar magnitudes. Klipvoor and Bronkhorstspruit Dams typically have blooms with much higher chl-a values which are also observed from the satellite. The values are quite similar, although there may be a slight tendency for the satellite data to overestimate chl-a for these dams. These examples demonstrate that satellite estimates typically match the magnitude and seasonal variability of the NEMP data, and can therefore be treated with confidence. For further matchup analysis see Matthews21.
Ten years of MERIS observations
Status and trends
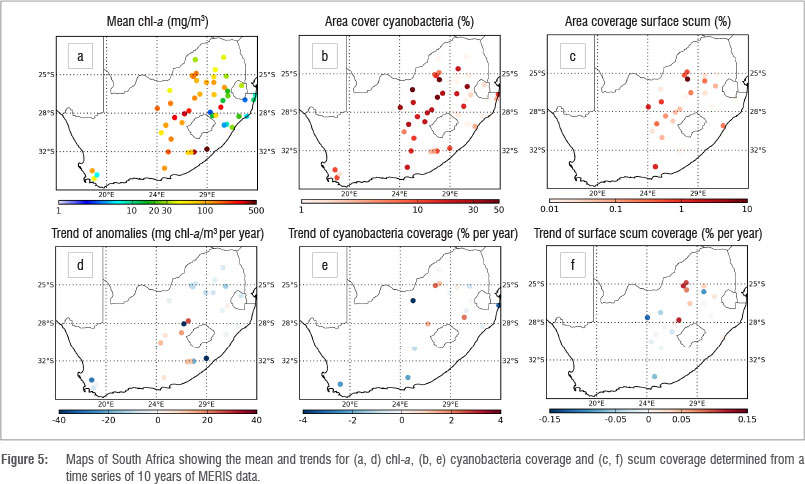
The results of the 10-year time series for 50 water bodies are summarised in Table 1 and Figure 5. Figure 5 shows the average values and trends for chl-a, cyanobacteria area coverage and surface scum between 2002 and 2012. Of the 50 water bodies, 36 were hypertrophic (chl-a greater
than 30 mg/m3), 3 were eutrophic (chl-a of 20-30 mg/m3), 4 were mesotrophic (chl-a of 10-20 mg/m3) and 7 were oligotrophic (chl-a less than 10 mg/m3). Cyanobacterial blooms were identified in all 50 of the water bodies during the time period. Extensive cyanobacterial blooms (greater than 30%) were present in 5 water bodies, 18 had intermediate coverage (10-30%), 13 had little coverage (1-10%) and 14 had insignificant coverage (0-1%). Surface scum was recorded in 26 of the 50 water bodies in varying degrees. The coverage was less than 1% for 23 of these water bodies, indicating that surface scum was an infrequent or rare event. Occasional scum events (1-5% coverage) were found in Spitskop and Darlington Dams, while Hartbeespoort Dam had more than 10% coverage, signalling frequent scum events.
A group of highly turbid reservoirs - including Mthatha, Ncora, Erfenis, Krugersdrift, Ntshingwayo and Allemanskraal Dams - had the highest chl-a values. As mentioned by Matthews21, these high values could be attributed to high turbidity which may cause unexpected operation of the MPH algorithm. These results should be considered preliminary until they can be further validated. Aside from these, the reservoirs most severely impacted by eutrophication were Grassridge, Klipvoor and Bloemhof. The three reservoirs least impacted were Sterkfontein, Pongolapoort and Midmar. The three water bodies most severely impacted by cyanobacterial blooms were Barberspan, Hartbeespoort and Koppies, with an average area coverage greater than 45%. Lake Chrissiesmeer, Spitskop and Vaal Dams were also heavily impacted with close to 30% average coverage. Cyanobacterial blooms and surface scum coverage reached their maximum extents at the end of the summer season in March and April. The high prevalence of cyanobacterial blooms in these water bodies is cause for immediate concern for potable, recreational and agricultural uses.
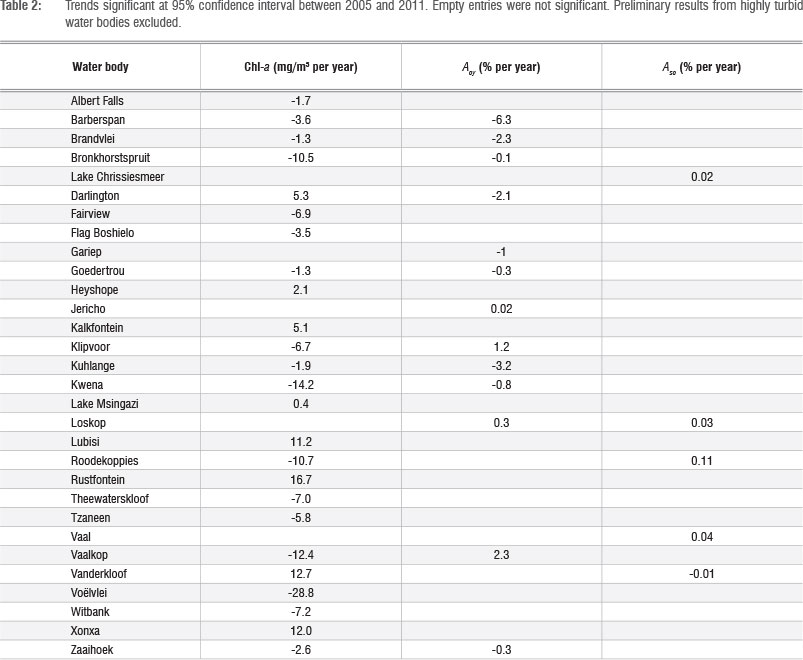
Analysis of the trends between 2005 and 2011 showed that water bodies had considerable variability in terms of the change in trophic status and cyanobacteria occurrence (Table 2, Figure 5). Trends were analysed for significance using a Student's t-test with a 95% confidence interval; only significant trends are reported. There were more negative trends (17) than positive trends (8) for chl-a. Those water bodies most vulnerable to increasing eutrophication were Darlington, Heyshope, Kalkfontein, Lubisi, Rustfontein, Vanderkloof and Xonxa.
In contrast, those water bodies which had the greatest improvement were Bronkhorstspruit, Kwena, Ncora, Roodekoppies, Vaalkop and Voëlvlei. These trends must be treated with some caution as the time period is short (2005 to 2011, because of years with incomplete data) and the data are therefore vulnerable to outliers and anomalous events. There were significant increases in cyanobacteria for Klipvoor and Vaalkop Dams. By comparison, decreased cyanobacterial blooms were recorded in Barberspan, Brandvlei, Darlington and Kuhlange (Kosi Lake). There was a small but significant increase in the occurrence of surface scums in Lake Chrissiesmeer, Loskop, Vaal and Roodekoppies Dams. The occurrence of only one significant decrease for scums signals that these events likely became more common over the time period.
Classification
In terms of the synthesis, the most impacted reservoir was Hartbeespoort Dam which scored a nine (Table 1, Figure 6). According to the data, the reservoir is hypertrophic and heavily impacted by frequent and extensive cyanobacterial blooms and scum events. These findings are corroborated by many studies which indicate the reservoir is one of the most productive in the world and is severely impacted by the toxin-producing M. aeruginosa. Spitskop scored the next highest with seven, and is also affected by severe eutrophication, cyanobacterial blooms and scum events. Darlington, Barberspan, Koppies and Lake Chrissiesmeer scored six and are all heavily impacted by eutrophication and cyanobacterial blooms (although not necessarily scums). Alarmingly, these include South Africa's two largest natural endorheic pans (Barberspan and Chrissiesmeer) which are crucial for biodiversity and avian conservation.

The highest number of water bodies had scores of four or five with common to occasional cyanobacterial blooms. These water bodies should also receive priority from management. There were 12 water bodies with scores of two or less, which indicates oligotrophic or mesotrophic water bodies with infrequent/insignificant cyanobacterial blooms. Although these water bodies are in a favourable state, measures should be taken to maintain their condition.
Conclusion
Satellite remote sensing has been used to assess the condition of 50 of South Africa's largest water bodies with regard to trophic status (chl-a) and the occurrence of cyanobacterial blooms and surface scums. We have shown that the majority of these water bodies are heavily impacted by eutrophication and cyanobacterial blooms. As much as 62% of the water bodies were hypertrophic, cyanobacterial blooms were recorded in all the water bodies, and cyanobacteria surface scum posing a high health risk occurred in 26 (or 54%) of the 50 water bodies. Surface scum events became more common between 2005 and 2011 in four water bodies. Therefore eutrophication and cyanobacterial blooms remain issues of critical concern for water security in South Africa and require urgent and sustained management attention.
In this study, we have demonstrated both the power and efficiency of satellite remote sensing used on a sub-continental (national) scale. We have shown how satellite remote sensing estimates compare closely with in-situ data from the NEMP, and can be used to supplement monitoring programmes to fill information gaps and provide new insights into the occurrence and seasonality of cyanobacterial blooms and surface scum. We recommend that satellite remote sensing be integrated into the NEMP to take advantage of historical data and those data that will become available from future satellite missions, in particular from the Sentinel-3 mission.
Acknowledgements
We thank Andy Rabagliati for assisting with processing of the MERIS data; the Centre for High Performance Computing for use of the DIRISA storage facility; the Department of Water Affairs for supplying in-situ data; Julie Deshayes for advising on time series methods; and three anonymous reviewers for their comments. M.W.M. was funded through PhD scholarships from the CSIR and UCT. Additional funding was provided by the CSIR Safe Waters Earth Observation Systems (SWEOS) internal project; and the Department of Science and Technology. MERIS data was provided by the European Space Agency.
Authors' contributions
This work is based on a PhD thesis by M.W.M. who performed the analysis and wrote the manuscript. S.B. supervised and reviewed the work.
References
1. Republic of South Africa. The National Water Act (36 of 1998). Pretoria; 1998. [ Links ]
2. Department of Water Affairs and Forestry (DWAF). South African water quality guidelines, Volume 2: Recreational use. 2nd ed. Pretoria: DWAF; 1996. [ Links ]
3. Department of Water Affairs and Forestry (DWAF). National water resources strategy. Pretoria: DWAF; 2004. p. 22. [ Links ]
4. Department of Water Affairs and Forestry (DWAF). White paper on a national water policy for South Africa. Pretoria: DWAF; 1997. p. 6.8. [ Links ]
5. Van Ginkel CE. Eutrophication: Present reality and future challenges for South Africa. Water SA. 2011;37(5):693-701. http://dx.doi.org/10.4314/wsa.v37i5.6 [ Links ]
6. Oberholster PJ, Botha A-M, Ashton PJ. The influence of a toxic cyanobacterial bloom and water hydrology on algal populations and macroinvertebrate abundance in the upper littoral zone of Lake Krugersdrift, South Africa. Ecotoxicology. 2009;18(1):34-46. http://dx.doi.org/10.1007/s10646-008-0254-5 [ Links ]
7. Chorus I, Falconer IR, Salas HJ, Bartram J. Health risks caused by freshwater cyanobacteria in recreational waters. J Toxicol Environ Health. 2000;Part B(3):323-347. [ Links ]
8. Paerl HW, Huisman J. Climate change: A catalyst for global expansion of harmful cyanobacterial blooms. Environ Microbiol Rep. 2009;1(1):27-37. http://dx.doi.org/10.1111/j.1758-2229.2008.00004.x [ Links ]
9. Department of Water Affairs and Forestry (DWAF). Trophic status report: Trophic status of impoundments. Pretoria: DWAF; 2003. [ Links ]
10. De Villiers S, Thiart C. The nutrient status of South African rivers: Concentrations, trends and fluxes from the 1970s to 2005. S Afr J Sci. 2007;103(7-8):343-349. [ Links ]
11. Department of Water Affairs. National Eutrophication Monitoring Programme phosphorus and chlorophyll summaries. Pretoria: DWA; 2013. Available from: http://www.dwaf.gov.za/iwqs/eutrophication/NEMP/report/NEMPyears.htm [ Links ]
12. Scott WE. Occurrence and significance of toxic cyanobacteria in southern Africa. Water Sci Technol. 1991;23(1-3):175-180. [ Links ]
13. Van Ginkel CE, Silberbauer MJ, Vermaak E. The seasonal and spatial distribution of cyanobacteria in South African surface waters. Verhandlungen Int Vereinigung für Theor und Angew Limnol. 2000;27:871-878. [ Links ]
14. Van Ginkel CE. A national survey of the incidence of cyanobacterial blooms and toxin production in major impoundments. Report No.: N/0000/00/DEQ/0503. Pretoria: Department of Water Affairs and Forestry; 2004. [ Links ]
15. Oberholster PJ, Botha A-M, Myburgh JG. Linking climate change and progressive eutrophication to incidents of clustered animal mortalities in different geographical regions of South Africa. J Biotechnol. 2009;8(21):5825-5832. [ Links ]
16. Oberholster PJ, Ashton PJ. State of the nation report: An overview of the current status of water quality and eutrophication in South African rivers and reservoirs. Pretoria: CSIR; 2008. p. 1-14. [ Links ]
17. Dodds WK, Bouska WW, Eitzmann JL, Pilger TJ, Pitts KL, Riley AJ, et al. Eutrophication of US freshwaters: Analysis of potential economic damages. Environ Sci Technol. 2009;43(1):12-19. http://dx.doi.org/10.1021/es801217q [ Links ]
18. Pretty JN, Mason CF, Nedwell DB, Hine RE, Leaf S, Dils R. Environmental costs of freshwater eutrophication in England and Wales. Environ Sci Technol. 2003;37(2):201-208. http://dx.doi.org/10.1021/es020793k [ Links ]
19. Matthews MW, Bernard S, Winter K. Remote sensing ofcyanobacteria-dominant algal blooms and water quality parameters in Zeekoevlei, a small hypertrophic lake, using MERIS. Remote Sens Environ. 2010;114(9):2070-2087. http://dx.doi.org/10.1016/j.rse.2010.04.013 [ Links ]
20. Matthews MW, Bernard S, Robertson L. An algorithm for detecting trophic status (chlorophyll-a), cyanobacterial-dominance, surface scums and floating vegetation in inland and coastal waters. Remote Sens Environ. 2012;124:637-652. http://dx.doi.org/10.1016/j.rse.2012.05.032 [ Links ]
21. Matthews MW. Eutrophication and cyanobacteria blooms in South African inland waters: 10 years of MERIS observations. Remote Sens Environ. 2014;155:161-177. http://dx.doi.org/10.1016/j.rse.2014.08.010 [ Links ]
22. Kutser T. Quantitative detection of chlorophyll in cyanobacterial blooms by satellite remote sensing. Limnol Oceanogr. 2004;49(6):2179-2189. http://dx.doi.org/10.4319/lo.2004.49.6.2179 [ Links ]
23. Hart RC, Wragg PD. Recent blooms of the dinoflagellate Ceratium in Albert Falls Dam (KZN): History, causes, spatial features and impacts on a reservoir ecosystem and its zooplankton. Water SA. 2009;35(4):455-468. [ Links ]
24. Oberholster PJ, Botha AM. Use of PCR based technologies for risk assessment of a winter cyanobacterial bloom in Lake Midmar, South Africa. Afr J Biotechnol. 2007;6(15):1794-1805. [ Links ]
25. Petrie SA, Rogers KH. Satellite tracking of white-faced whistling ducks in a semiarid region of South Africa. J Wildl Manage. 1997;61(4):1208-1213. http://dx.doi.org/10.2307/3802118 [ Links ]
26. Herremans M. Waterbird diversity, densities, communities and seasonality in the Kalahari Basin, Botswana. J Arid Environ. 1999;43(3):319-350. http://dx.doi.org/10.1006/jare.1999.0546 [ Links ]
27. Zohary T. Hyperscums of the cyanobacterium Microcystis aeruginosa in a hypertrophic lake (Hartbeespoort Dam, South Africa). J Plankton Res. 1985;7(3):399-409. http://dx.doi.org/10.1093/plankt/7.3.399 [ Links ]
28. Matthews MW, Bernard S. Using a two-layered sphere model to investigate the impact of gas vacuoles on the inherent optical properties of Microcystis aeruginosa. Biogeosciences. 2013;10(12):8139-8157. http://dx.doi.org/10.5194/bg-10-8139-2013 [ Links ]
29. Oberholster PJ, Botha AM. Use of remote sensing and molecular markers to detect toxic cyanobacterial hyperscum crust: A case study on Lake Hartbeespoort, South Africa. Afr J Biotechnol. 2010;9(51):8791-8799. [ Links ]
 Correspondence:
Mark W. Matthews
Department of Oceanography, University of Cape Town
Private Bag X3, Rondebosch 7701
South Africa
Email: mark@cyanolakes.com
Received: 06 June 2014
Revised: 28 July 2014
Accepted: 14 Sep. 2014

