


Servicios Personalizados
Articulo
 Inglés (pdf)
 Articulo en XML
 Referencias del artículo
Indicadores

Links relacionados
-
 Citado por Google
 -
 Similares en Google
Compartir

 Permalink
South African Journal of Science
versión On-line ISSN 1996-7489
versión impresa ISSN 0038-2353
S. Afr. j. sci. vol.111 no.5-6 Pretoria may./jun. 2015
http://dx.doi.org/10.17159/sajs.2015/20140196
RESEARCH ARTICLE
Quantifying the catchment salt balance: An important component of salinity assessments
Richard D.H. BuganI, II; Nebo Z. JovanovicI; Willem P de ClercqII
ICouncil for Scientific and Industrial Research - Natural Resources and the Environmei Stellenbosch, South Africa
IIDepartment of Soil Science, Stellenbosch University, Stellenbosch, South Africa
ABSTRACT
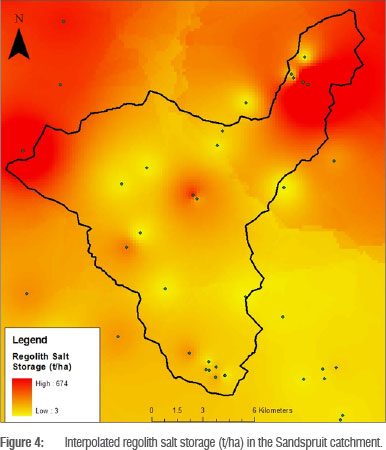
Soil and stream salinisation is a major environmental problem because it reduces the productivity of landscapes and degrades water quality. The Berg River (South Africa) has been exhibiting a trend of increasing salinity levels, which has primarily been attributed to the manifestation of dryland salinity. Dryland salinity occurs as a result of changes in land use (indigenous vegetation to agriculture and/or pasture), which cause a change in the water and salt balance of the landscape, consequently mobilising stored salts. The quantification of salinity fluxes at the catchment scale is an initial step and integral part of developing dryland salinity mitigation measures. The objective of this study was to quantify the salinity fluxes in the Sandspruit catchment, a tributary catchment of the Berg River. This included the quantification of salt storage, salt input (rainfall) and salt output (in run-off). The results of the catchment salt balance computations indicate that the Sandspruit catchment is exporting salts, i.e. salt output exceeds salt input, which may have serious implications for downstream water users. Interpolated regolith salt storage generally exhibited increasing storage with decreasing ground elevation. A salinity hotspot was identified in the lower reaches of the catchment. It is envisaged that the data presented in this study may be used to classify the land according to the levels of salinity present; inform land management decisions; and provide a guide and framework for the prioritisation of areas for intervention and the choice and implementation of salinity management options. The data which were generated may also be used to calibrate hydrosalinity models.
Keywords: Berg River catchment; dryland; salt storage; soil salinity; hydrosalinity modelling
Introduction
Soil and stream salinisation is a major environmental problem and occurs in many parts of the world. It reduces the fertility of landscapes, impacting agricultural activities, and degrades water quality, resulting in water that is unfit for domestic, recreational, agricultural and/or industrial use. These effects result in significant economic losses and water supply issues. The salinisation of soils and water resources may be either a natural phenomenon (primary salinity) or a result of anthropogenic activities (secondary salinity).1 Primary salinity is associated with the release of salts through the weathering of naturally saline rocks and/or deposition by climatic controls (aeolian or rainfall deposition). Climatic controls are largely a function of proximity to the coast.2 Human-induced or secondary salinisation may either be a function of the direct addition of saline water to the landscape and/or water resources, e.g. through industrial effluent and/or saline irrigation water, or it may be a result of a change in the water balance (quantity and dynamics) of a catchment causing the mobilisation of stored salts (dryland/non-irrigated salinity).3-5 Dryland/non-irrigated salinity commonly occurs as a result of changes in land use (indigenous vegetation to agriculture and/or pasture) and management which cause a change in the water and salt balance of the landscape, consequently mobilising stored salts.1
Salinity has long been identified as one of the main water quality problems in South Africa.6 Many rivers exhibit high salinities, which is either a result of the naturally saline geology in which the rivers flow7 or a result of anthropogenic activities. The Berg River, which is located in the Western Cape, is an example of a river which has been exhibiting a trend of increasing salinity levels. The Berg River is a pivotal source of fresh water to Cape Town, the agricultural sector, the industrialised town of Saldanha and the in-stream ecology. Streamflow quality data collected by the Department of Water Affairs8 indicates that the Berg River exhibits a salinity gradient, i.e. it increases from the upstream sections of the catchment towards the mid-stream and downstream sections. The upstream sections exhibit an average electrical conductivity (EC) of 11 mS/m, while the downstream sections (20 km from the estuary) exhibit an average EC of 102 mS/m and a maximum of 730 mS/m.8
Consequently, research projects were initiated to comprehend the cause and dynamics of the salinisation in the catchment. It was reported that, in addition to the occurrence of naturally saline geology, the increase in salinity observed in the Berg River may also be attributed to dryland salinisation.9-11 According to De Clercq et al.11, changes in land use over the last century or more, from extensive pastoral use to intensive cropping, have triggered the same process of salt mobilisation and decantation that is so widespread in Australia.2,5,12,13 The Sandspruit catchment, a tributary of the Berg River, has particularly been impacted by dryland salinity.11 According to Flugel9 the total salt output from the Sandspruit catchment in 1986 was 8052 t, of which a third may be accounted for by atmospheric deposition. The change in land use has changed the water balance in the catchment, resulting in the mobilisation of stored salts.14
The quantification of salinity fluxes at the catchment scale is an initial step and integral part of developing dryland salinity mitigation measures. The catchment salt balance (or salt output/input ratio) is a key indicator for a catchment that is undergoing salinisation,15 that is, it provides an indication of whether the catchment is in a state of salt depletion or accumulation and/or the rates of accumulation or depletion. Additionally, it also provides information pertaining to the salinity trend in the catchment. The salt balance is also an efficient measure through which to encapsulate all of the salinity processes occurring in a catchment.16 The computation of salinity fluxes will also generate data which will facilitate the calibration and validation of salinity management models. Ultimately, however, the salt balance provides an indication of the severity of the salinity problem in an area. The objective of this study was to quantify the salinity fluxes in the 152-km2 Sandspruit catchment, including the quantification of salt storage (in the regolith and underlying shale), salt input (rainfall) and salt output (in run-off). Salt storage was quantified on a spatially distributed basis with the aim of identifying salinity hotspots.
Study area
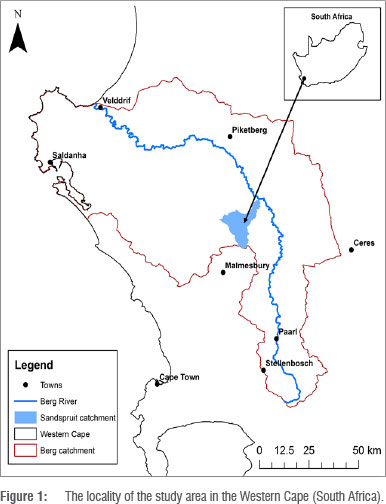
This research was conducted in a significantly saline tributary catchment (a result of dryland salinity) of the Berg River: the Sandspruit catchment (Figure 1). The Sandspruit catchment is located in quaternary catchment G10J in the Western Cape Province of South Africa, approximately 80 km northeast of Cape Town (Figure 1). The Sandspruit catchment is regarded as a medium-sized catchment (152 km2) and is a seasonal stream which generally only flows between the months of June and November.
The climatic conditions evident in the area may be classified as semi-arid, characterised by long, dry summers and cool, wet winters. The annual rainfall in the area is generally 300-400 mm, and is dominated by long-duration and low-intensity frontal rainfall between the months of April and October. All precipitation occurs in the form of rainfall. Winter extreme minimum temperatures vary from 2 °C to 4 °C and summer extreme maximum temperatures vary from 38 °C to 40 °C. Mean annual potential evaporation for the area is approximately 1615 mm, with marked seasonal differences between evaporation losses in summer (250 mm per month) and winter (50 mm per month).11
Geology in the Sandspruit catchment shows minimal variation, being dominated by Table Mountain Group sandstone in the high elevation areas (south) and Malmesbury shale in the mid- to low-elevation parts (north). An alluvium cover is also evident, which increases in thickness towards the lower elevation areas of the catchment.
Land use in the Sandspruit catchment is dominated by cultivated lands and pastures (approximately 145 km2). The catchment falls within the 'bread basket' of South Africa and thus agriculture is dominated by wheat cultivation. However the growing of lupins and canola is not uncommon. Farmers in the area generally follow a 3-year planting rotation, i.e. cultivation only occurs every third year. Lands are left fallow between planting rotations and used for grazing. Soil erosion is minimised through the use of constructed anti-erosion contours, which are evident throughout the catchment.
For a detailed description of the physiography of the Sandspruit catchment, the reader is referred to Bugan et al.17
Methodology
The Sandspruit catchment is located in the mid to lower reaches of the Berg catchment, an area which stores large quantities of soluble inorganic salts in the regolith. The change in land use, from indigenous vegetation to agriculture, has altered the water balance (changes in evapotranspiration and infiltration/recharge dynamics) causing the mobilisation of these salts and the subsequent salinisation of soils, groundwater and streams. Salt output is interpreted to be well in excess of salt input and considered to be mainly mobilised by interflow, as interflow from the soil horizon is the dominant contributor to streamflow (94.68% of streamflow).17 As evapotranspiration exceeds precipitation throughout most of the year, leaching of salts is likely to be limited and soluble salts accumulate in the soil horizon. During rainfall events, the resultant run-off and infiltration periodically flush these salts throughout the landscape and into rivers.
The annual salinity fluxes of the Sandspruit catchment were quantified for the period 2007-2010, thus studying four rainfall seasons. The following components of the catchment salt balance were considered.
Salt input
The main source of salt input to the Sandspruit catchment occurs via rainfall. As dryland farming is mainly practised, the potential for salt input to occur via irrigation with saline water is minimal. Salt input may also occur via dry aeolian deposition, as a result of the proximity to the coast; however, because of the low volumes associated with this mechanism and the complexity of quantifying it, it was not considered in this investigation. Salt input to a catchment from rainfall may be quantified using Equation 118:
TSI = R * CA * SFC, Equation 1
where TSI is the total salt input (kg/catchment), R is the rainfall (mm), CA is the catchment area (km2) and SFC is the salt fall concentration (mg/L).
Results from previous investigations18-20 suggest that a rainfall salinity gradient generally occurs with distance from the coastline, i.e. rainfall salinity decreases with distance from the coastline. Thus, salinity is expected to decrease from west to east across the Sandspruit catchment. Keywood et al.20 reported TSI figures for western regions of Australia of 1.0 kg/ha and 0.8 kg/ha per annum at 615 km and 780 km inland, respectively. The salinity of rainfall was not monitored during this study, which is a limitation. However, data in this regard are available from previous investigations. Flügel9 estimated that the Sandspruit catchment receives approximately 440 mm/year (mean), with a salt concentration of 14-125 mg/L (averaging 37 mg/L). The data exhibit a large range, which may be representative of a rainfall salinity gradient across the catchment, i.e. with distance from the coastline. Sodium and chloride transported by wind from the Atlantic Ocean were the dominant ions. Recent rainfall salinity data are unavailable, but it is assumed that the data presented by Flügel9 are still valid and representative of the catchment average rainfall salinity.
The TSI for the 2007-2010 rainfall seasons was quantified using catchment average rainfall values calculated by Bugan et al.17, and the average rainfall salt concentration derived by Flugel9. The limited data of rainfall chemistry (temporally and spatially) is a limitation to this study.
Soil salinity
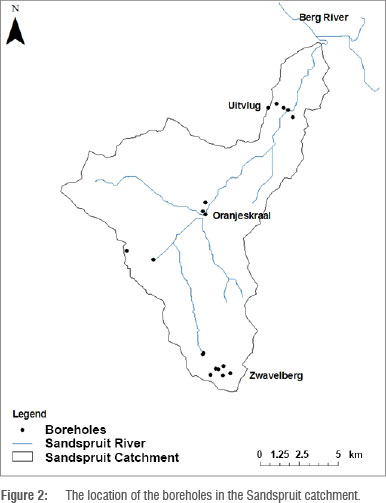
During April-June 2009, 26 boreholes were drilled throughout the Sandspruit catchment (Figure 2). Drilling sites were spatially distributed so as to be representative of geological and topographical variation within the catchment. The rotary percussion method was used to drill the boreholes and collect samples. The depth of drilling was determined by the depth to groundwater and the depth to consolidated hard rock (Malmesbury shale). In some cases, boreholes were drilled deeper so as to investigate whether further water strikes would be intersected within the shale. Borehole site characteristics are summarised in Supplementary table 1 of the online supplementary material.
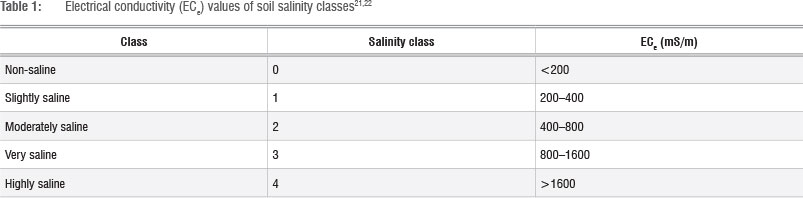
The salinity of soil is generally measured by drawing salts from the soil into solution and measuring the salinity of the solution. During borehole drilling, sediment samples were collected at intervals of 0.5-1 m. The samples were sealed in sampling bags and used to measure soil water content. Sub-samples were subsequently used to prepare 1:5 solid:solution extracts and the resulting solution was used to measure EC15 (mS/m).21 Sampling and testing soil is an accurate method of measuring salt levels and can also determine whether factors other than salinity are affecting an area. The EC15 was then converted to the ECe (EC of the soil extract) using a multiplication factor.22 The multiplication factor is based on the soil texture.14 The salinity of the topsoil (0-0.5 m) was then assessed according to the salinity classes proposed by Richards23 and Van Hoorn and Van Alphen24 (Table 1).
Salt storage
The sediment samples collected during borehole drilling were also used to quantify the salt storage in the regolith across the catchment. The regolith zone, in this instance, is defined by the soil zone and the unsaturated/vadose zone. Infiltration and temporary winter saturated horizons are interpreted to mobilise salts stored within this zone towards lower valley locations and the Sandspruit River. Groundwater, encountered at the interface of the regolith and the Malmesbury shale, is also interpreted to be a significant salt mobilising agent.
Groundwater flow and salt storage within the saturated zone, defined by the regional Malmesbury Group aquifer, was not considered in this study. The contribution from this aquifer to the Sandspruit River is considered to be minimal17 and thus will also have minimal effect on the catchment salt output via streamflow.
The regolith samples were used to prepare 1:5 solid:solution extracts. The EC results of the 1:5 solid:solution extracts are, however, not a true representation of field conditions because of the diluting effect of the added water in the preparation of the 1:5 solid:solution extracts. This diluting effect was accounted for using the following process:
• As the mass of water is five times the mass of soil, the soil sample is said to have a water content of 500% in gravimetric terms. The gravimetric water content is thus 5 g water per 1 g soil.
• The gravimetric water content may then be converted into volumetric water content using the soil bulk density. As disturbed samples were collected, it was not possible to measure porosity, density and hydraulic properties. However, the bulk density of the regolith was measured on drilling cores collected in a catchment adjacent to the Sandspruit exhibiting similar physical conditions.25 The cores exhibited similar geological layering (sequence) to that observed in the Sandspruit catchment. The bulk density of these cores ranged between 1.25 g/cm3 and 1.52 g/cm3.
• A dilution factor may then be obtained for each sample by dividing the volumetric water content of the solid:solution extracts by the actual volumetric water content, calculated as a product of the field measured gravimetric water content and the bulk density values estimated by Samuels25. EC measured on 1:5 solid:solution extracts were then multiplied by this dilution factor to obtain true EC values.
• The total dissolved salts (TDS) was then inferred from the EC using results from regression analysis (R2= 0.90) performed by Bugan26, i.e. TDS (mg/L) = 534.91 * EC (dS/m) - 12.655.
The TDS concentrations of the sediment solution were used to calculate the salt storage in t/ha. These data represented model inputs for the simulation of inorganic salt fluxes as well as allowed the identification of areas of maximum salt storage in the catchment. Salt storage (t/ha) from TDS (mg/L water) may be quantified using Equations 2-4.
Calculate the soil mass (kg/ha)27 as:
M = T*BD*10s Equation 2
where M is the soil mass (kg/ha), T is the thickness of the horizon (cm) and BD is the bulk density (g/cm3).
Calculate the soil salt concentration (mg salt/kg soil) as:
Cs = Cw x GWC, Equation 3
where Cs is the soil salt concentration (mg salt/kg soil), Cw is the water salt concentration (mg/L water) and GWC is the gravimetric water content (kg/kg).
Calculate the salt mass (kg/ha) as:
SC = Cs*M /106 Equation 4
where SC is the salt mass (kg salt/ha), Cs is the soil salt concentration (mg salt/kg soil) and M is the soil mass (kg soil/ha).
Spatial variability in salt storage
Knowledge of the spatial distribution of salt storage in the catchment is essential for salinity management, particulary for the implementation of distributed salt balance models. As salt storage is usually quantified on an area basis and expressed as t/ha, interpolation methods are used to distribute these data across a catchment. Flügel9 suggested that salt distribution in the Sandspruit catchment is a function of the topographic location. Cox et al.28 are also of the opinion that spatial variability in salt storage is predominantly a function of elevation. The topographic wetness index, which combines local upslope contributing area and slope, is also commonly used to quantify topographical controls on hydrological processes.29 Point data of regolith salt storage was correlated with ground elevation and the topographic wetness index to investigate whether this relationship could be used to interpolate the data. According to Bennetts et al.30, elevated groundwater salinity is expected to correlate well with elevated soil salinity. Thus, as a further measure, groundwater EC, which is well defined across the catchment, was also correlated with regolith salt storage. In addition to groundwater EC data collected at boreholes drilled during this study, historical groundwater EC data gathered from the National Groundwater Database of the Department of Water Affairs (now the Department of Water and Sanitation) were also utilised for the interpolation. The National Groundwater Database contains data for 93 boreholes located in quaternary catchment G10J from 1990 to the present. The inverse distance weighted interpolation method was utilised as the procedure is versatile, easy to program and understand, and is fairly accurate under a wide range of conditions.31
In addition to the coefficient of determination, the correlations were also evaluated using Spearman's rank correlation coefficient (Rs).29 Rs is a measure of the statistical dependence between two variables. If there are no repeated data values, a perfect Rs of +1 or -1 occurs when each of the variables is a perfect monotone function of the other. The sign of Rs indicates the direction of association between X (the independent variable) and Y (the dependent variable). If Y tends to increase when X increases, the Rs is positive, and if Y tends to decrease when X increases, the Rs is negative.
Salt output
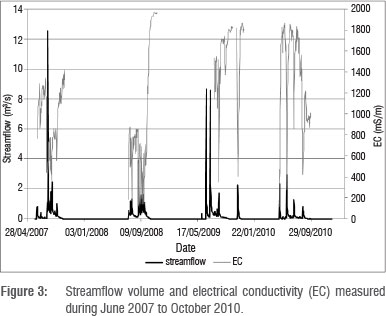
The total salt output from a catchment may be quantified using streamflow quantity and salinity data sets, i.e. the salt load is equal to the product of the streamflow (m3/s) and the corresponding stream water salinity (TDS, mg/L). The salinity of the Sandspruit River was monitored with an electronic EC sensor, hourly, from June 2007 to October 2010. Data for the period 06/06/2009-30/07/2009 are missing as a result of sensor malfunction. The sensor was located at the Sandspruit gauging weir (G1H043), for which streamflow quantity (m3/s) data are available for the period from May 1980 to the present. This station is maintained by the Department of Water Affairs and Sanitation. Periods for which data were missing were filled using a correlation (R2= 0.7) with streamflow, i.e. salt output (t/day) = 169.49 * streamflow (m3/s) + 26.743. The streamflow (m3/s) and logged EC data (mS/m) for the period of observation are shown in Figure 3.
The salt output from the Sandspruit catchment was quantified using Equation 532:
SL = TDS * Q * 1000, Equation 5
where SL is the salt load (kg/s), TDS is the total dissolved solids (mg/L) and Q is the discharge (m3/s). The TDS was inferred from EC using the conversion TDS (mg/L) = EC (mS/m) * 6.5,33 which is commonly used in South Africa.
Catchment salt balance
The salt mass balance is an indicator of the stage of hydrological change after changes in land use and salinity development. Prior to the clearing of indigenous vegetation, the output/input ratio may be considered to be at equilibrium,34 which does not imply that it is equal but that it is stable. Clearing of the indigenous vegetation may result in output exceeding input, or increased output. The rate of migration back to a state of equilibrium is dependent on the leaching rate and the magnitude of the salt stores.35 In catchments with a mean annual rainfall of less than 500 mm, the time required to restore the salt equilibrium is expected to be of the order of hundreds to tens of thousands of years, depending on rainfall, hydrogeological conditions, salt storage, catchment size and the amount of vegetation clearance.35
The salt mass balance approach has been used with some success to predict the effect of upstream catchment land use on salinity. Generally, a favourable salt balance (mass out > mass in) is considered necessary for sustainable agriculture.36 The salt balance may be represented by37:
Min - Mout =(dm/dt), Equation 6
where Min and Mout are the mass per unit time of salt input and output, respectively, and dM/dtis the rate of change in mass in the system. This equation implies that equilibrium, in terms of salt, is achieved when there is no change in the mass of salt in the system, i.e. dM/dtis zero. The salt balance of a system that has a net accumulation or insufficient leaching rates of salt can be considered to be at risk of the salinisation of land and water resources.38
Two additional terms are also used to describe the salt balance: the salt balance index (SBI) and salt export ratio (SER).34,37,38 These similar terms are defined by the salt output from a given hydrological volume and time period, divided by the salt input. The system is in equilibrium when the SBI or SER equals 1. The system is in a state of salt accumulation when the SBI or SER is less than 1, and in a state of salt depletion when the SBI or SER is greater than 1.36
Results
Salt input
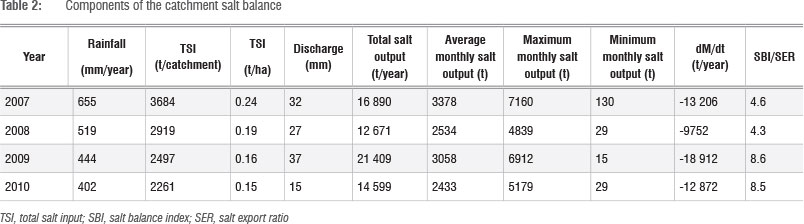
The TSI to the Sandspruit catchment during the period of observation is shown in Table 2. Rainfall was assumed to exhibit a TDS concentration of 37 mg/L. Average catchment rainfall was obtained from Bugan et al.17 The salt input was therefore a function of rainfall amount as variable rainfall chemistry data were not available. The TSI ranged between 2261 t and 3684 t per catchment. The TSI is expected to vary across the catchment, particularly with distance from the coastline.
Soil salinity
The salinity of the topsoil (0-0.5 m) samples collected during borehole drilling (Figure 2) is presented in Table 3. The EC15 was converted to ECe using a multiplication factor,22 which is based on soil textural analysis. The results indicate that the majority of the topsoil samples may be classified as non-saline.24 However, two samples, from the downstream parts of the catchment (Uitvlug, Figure 2), may be classified as very saline.24 This finding may be indicative of the influence of topography on soil salinisation processes.
Salt storage
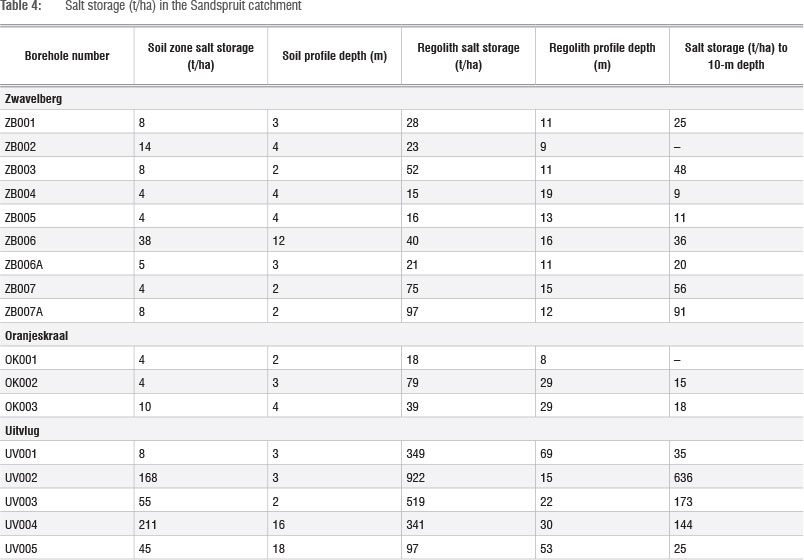
The regolith salt storage measured at each borehole is presented in Table 4. The regolith is defined as the layer of loose, heterogeneous material which overlies hard rock (soil zone and vadose zone).39 The salt storage ranged between 15 t/ha and 922 t/ha. If expressed as the storage within a fixed depth, i.e. 10 m, the salt storage ranged from 9 t/ha to 636 t/ha. The regolith salt storage dominantly depends on the depth of the profile as well as elevation, i.e. the regolith salt storage generally increased with decreasing ground elevation. Profiles located at Uitvlug (downstream in the catchment) exhibited elevated salt concentrations, indicating that a salinity 'hotspot' may be located there. It should, however, be noted that the quantification technique employed here incorporates a degree of uncertainty, which is mainly associated with the bulk density values. The estimates used in this quantification are from a small sample set collected at a different site and at different depths.
Spatial variability in salt storage
Data of regolith storage obtained from point measurements were correlated with ground elevation (mAMSL), the catchment topographic wetness index and groundwater EC to identify relationships with which to interpolate the data. The coefficients of determination of the correlation analysis are presented in Table 5.
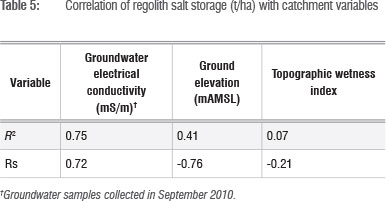
Salt storage did not correlate well with elevation. This result is interpreted to be a consequence of the fact that the borehole locations did not sufficiently account for elevation variations in the catchment, i.e. the borehole transects (Figure 2) were essentially drilled across three elevation zones/bands. Also, as the topographic wetness index incorporates elevation, the inadequate representation of elevation variation affected this correlation. Regolith salt storage correlated well with groundwater EC (mS/m), exhibiting an R2 of 0.75. The correlation between groundwater EC (mS/m) and regolith salt storage (t/ha) may be described by Equation 7:
Salt storage (t/ha) = 0.3269 (groundwater EC mS/m) + 1.429
Equation 7
This correlation was used to interpolate salt storage across the catchment (Figure 4). Interpolated regolith salt storage ranged between 3 t/ha and 674 t/ha. The reduction in the salt storage range from that reported in Table 4 is a result of the interpolation process. The data also indicate that storage increases with decreasing ground elevation, i.e. in a northeasterly direction. Salt storage is expected to be lower in the hilltops, as a result of salt leaching (groundwater recharge/infiltration), and higher in the valleys, as a result of salt accumulation. The spatially averaged regolith salt storage in the Sandspruit catchment is 110 t/ha. Because of the interpolation procedure and the historical nature of the groundwater EC data, these results incorporate uncertainty. They should thus not be considered as absolute values, but rather as estimates of salt storage.
Salt output
The total annual export of salt from the catchment was calculated using the catchment discharge and streamflow salinity data sets (Equation 5). The results are presented in Table 2. During the period of observation, the salt output from the Sandspruit catchment ranged between 12 671 t/year and 21 409 t/year. The average monthly salt output ranged between 2433 t and 3378 t. The maximum monthly salt output was generally observed during July to September, which corresponds to the period of highest discharge. The minimum monthly salt output was observed during October to December, which corresponds to the period of lowest discharge. The increased discharge and salt output observed in 2009 cannot be attributed to increased rainfall as it was below that observed during 2007 and 2008 (Table 2). The spatial distribution of the wheat/fallow fields and rainfall characteristics (intensity and temporal distribution) are interpreted to exert a greater influence on discharge and salt output than the annual rainfall total.
Catchment salt balance
The catchment salt balance, i.e. salt output/input (O/I) ratio, is presented in Table 2. The rate of change in mass of the system (dM/dt) and the SBI/ SER indicate that the Sandspruit catchment is in a state of salt depletion, i.e. salt output exceeds salt input. No previous data pertaining to the salt balance are available for the study area and thus long-term dynamics cannot be evaluated.
Conclusions
The quantification of salinity fluxes at the catchment scale is an initial step and integral part of developing salinity mitigation measures. The objective of this study was to quantify the salinity fluxes in the 152-km2 Sandspruit catchment.
The TSI to the catchment from rainfall ranged between 2261 t and 3684 t per catchment. The salt input was calculated as a function of the rainfall amount as variable rainfall chemistry data were not available. The lack of rainfall chemistry data is a limitation of this study. The acquisition of additional rainfall chemistry data may significantly influence these estimates. Rainfall salinity has been proven to be a function of the distance from the coastline,16,18-20 i.e. the salinity decreases with distance from the coastline. Thus, the rainfall salinity may be higher in the western parts of the catchment than the eastern parts. The optimal method with which to determine the salt input via rainfall would be to utilise coverage of interpolated rainfall and a network of rainfall salinity monitoring stations. The impact of the lack of rainfall chemistry data on the catchment salt balance may, however, only be quantified through the provision of additional data. The lack of similar data in South Africa prevents a quantitative interpretation of the data, that is, whether these values are low or high. Jolly et al.18 reported that the salt input to the Murrumbidgee catchment (155 km2) in Australia ranged between 395 t and 785 t per year. However, the catchment experienced significantly higher rainfall amounts (566 mm to 1060 mm per year) and the distance from the coastline is unknown.
Topsoil samples gathered during borehole drilling may generally be regarded as non-saline, with an ECe<200 mS/m. However, two samples gathered at Uitvlug, which is located in the downstream parts of the catchment (Figure 2), exhibited elevated ECe (800-1600 mS/m) and may thus be classified as very saline. The increased soil salinity in the downstream parts of the catchment provides evidence for the influence of topographic controls on salinisation processes. Increased rainfall, and subsequent infiltration/groundwater recharge in the upper reaches of the catchment, dissolve and mobilise salts towards the lower elevation parts of the catchment. This situation manifests in the appearance of saline scalds - patches in the wheat fields - which become increasingly evident particularly in the lower lying areas of the catchment. These saline scalds are areas in which the wheat is unable to germinate. This investigation provides an initial assessment of the topsoil salinity, which requires further validation through extensive mapping of the soil and soil salinity.
Sediment samples collected during borehole drilling were used to quantify the salt storage in the regolith zone. The salt storage in the regolith ranged between 15 t/ha and 922 t/ha and a salinity 'hotspot' was identified in the lower reaches of the catchment. The point data of regolith salt storage were correlated with ground elevation (mAMSL), the catchment topographic wetness index and groundwater EC to identify relationships with which to interpolate these data. Regolith salt storage correlated well with groundwater EC (mS/m), exhibiting an R2of 0.75. Interpolated regolith salt storage ranged between 3 t/ha and 674 t/ha, exhibiting generally increasing storage with decreasing ground elevation. The average regolith salt storage in the Sandspruit catchment is 110 t/ha. It may also be useful to investigate the potential for mapping/interpolating regolith salt storage through correlations with soil type, slope, lithology or soil depth. Data of a similar nature are not available for South Africa and thus comparisons cannot be made. Even though these results may not be taken as absolute values, the identification of areas of high salt storage holds important implications for water resources management and land use planning. It enables resource managers to make informed decisions in terms of vegetation distribution or planting strategies and the locations for the implementation of salinity management measures.
During the period of observation, the salt output from the Sandspruit catchment ranged between 12 671 t and 21 409 t per year. The salt output was much larger than that reported by Jolly et al.18 for the Murrumbidgee catchment (155 km2) in Australia, which was a mean of 2626 t/year. The salt storage in the Murrumbidgee catchment is, however, unknown. The stream salinity typically decreases during high flow events, as a result of the increased dilution capacity; however, large streamflow events can still deliver considerable salt loads. The export of salts from the Sandspruit catchment has implications for downstream water users of the Berg River.
The results of the catchment salt balance computations indicate that the Sandspruit catchment is exporting salts. This is a function of the development of agricultural lands and the resultant changes in the hydrosalinity dynamics in the catchment. Under natural conditions, in semi-arid to arid areas in which evaporation/evapotranspiration greatly exceeds rainfall, landscapes generally accumulate salts.40 Changes to the catchment hydrology as a result of agricultural or other developments can cause significant changes to the salinity dynamics of a catchment, typically in the form of increased salt exports. The Sandspruit catchment exhibits SBI/SER, which ranges between 4.3 and 8.6. Catchments which mobilise salts are likely to exhibit ratios in excess of 1, and sometimes even as high as 1 5-30.34,35
It is clear that the Sandspruit catchment is exporting significant quantities of salt to the Berg River (most likely driven by changes in land use). A continuation of this trend over the larger Berg catchment is expected to sustain the trend of increasing salinity levels in the Berg River. Because of the scarcity of water in the Western Cape, which may be further exacerbated by the impending impacts of climate change, it is essential that water resource management initiatives be implemented. It is envisaged that this information may be used to classify the land according to the levels of salinity present, inform land management decisions, provide a guide and framework for the prioritisation of areas for intervention, and provide a guide for the choice and implementation of salinity management options. The data gathered during this investigation may also be used as reference data for scenario simulations which aim to evaluate potential changes to the salt balance caused by, for example, water abstractions and inter-basin transfer.
Acknowledgements
We thank the Water Research Commission and National Research Foundation (Applied Centre for Climate and Earth Systems Science) for funding the study, and the Department of Water and Sanitation for funding the drilling and establishment of the boreholes.
Authors' contributions
This work forms part of R.B.'s PhD dissertation; R.B. was thus responsible for formulating the research concept, conducting field work and laboratory analysis, performing calculations and drafting the manuscript. N.J. acted as co-supervisor during the PhD study, assisted with field work and made conceptual contributions to the work, and reviewed the manuscript. W.d.C. acted as supervisor during the PhD study, made conceptual contributions to the work, and reviewed the manuscript.
References
1. Pannell DJ, Ewing MA. Managing secondary dryland salinity: Options and challenges. In: Proceedings of the 4th International Crop Science Congress: New directions for a diverse planet; 2004 Sep 26-Oct 01; Brisbane, Australia. Gosford: The Regional Institute Ltd; 2004. p. 1-12. [ Links ]
2. Clarke CJ, George RJ, Bell RW, Hatton TJ. Dryland salinity in south-western Australia: Its origins, remedies and future research directions. Aust J Soil Res. 2002;40:93-113. http://dx.doi.org/10.1071/SR01028 [ Links ]
3. Greiner R. Catchment management for dryland salinity control: Model analysis for the Liverpool Plains in New South Wales. Lyneham: CSIRO Publishing; 1998. [ Links ]
4. Walker G, Gilfedder M, Williams J. Effectiveness of current farming systems in the control of dryland salinity. Adelaide: CSIRO Publishing; 1999. [ Links ]
5. Acworth RI, Jankowski J. Salt source for dryland salinity - Evidence from an upland catchment on the Southern Tablelands of New South Wales. Aust J Soil Res. 2001;39:12-25. http://dx.doi.org/10.1071/SR99120 [ Links ]
6. Department of Water Affairs and Forestry (DWAF). Management of the water resources of the Republic of South Africa. Pretoria: DWAF; 1986. [ Links ]
7. Lerotholi S. The role of salinity as an abiotic driver of ecological condition in a rural agricultural catchment [MSc dissertation]. Grahamstown: Rhodes University; 2005. [ Links ]
8. Department of Water Affairs (DWA). Resource quality information services [homepage on the Internet]. [ Links ] c2011 [cited 2014 May 13]. Available from: http://www.dwaf.gov.za/iwqs/default.aspx
9. Flügel W. River salinity due to dryland agriculture in the Western Cape Province, Republic of South Africa. Environ Int. 1995;21:679-686. http://dx.doi.org/10.1016/0160-4120(95)00073-T [ Links ]
10. Fey MV De Clercq WP. Dryland salinity impacts on Western Cape rivers. Report No 1342/1/04. Pretoria: Water Research Commission; 2004. [ Links ]
11. De Clercq WP Jovanovic NZ, Fey MV. Land use impacts on salinity in Berg River water. Report No K5/1503. Pretoria: Water Research Commission; 2010. [ Links ]
12. Peck AJ, Hatton T. Salinity and the discharge of salts from catchments in Australia. J Hydrol. 2003;272:191-202. http://dx.doi.org/10.1016/S0022-1694(02)00264-0 [ Links ]
13. Crosbie RS, Hughes JD, Friend J, Baldwin BJ. Monitoring the hydrological impact of land use change in a small agricultural catchment affected by dryland salinity in central NSW, Australia. Agr Water Manage. 2007;88:43-53. http://dx.doi.org/10.1016/j.agwat.2006.08.009 [ Links ]
14. Bugan RDH. Modelling and regulating hydrosalinity dynamics in the Sandspruit River Catchment (Western Cape) [PhD thesis]. Stellenbosch: Stellenbosch University; 2014. [ Links ]
15. Williamson DR. Land degradation processes and water quality effects, water logging and salinity. In: Williams J, Hook RA, Gascoigne HL, editors. Farming action-catchment reaction, the effect of dry-land farming on the natural environment. Collingwood, VIC: CSIRO Publishing; 1998. p. 162-190. [ Links ]
16. Biggs AJW, Silburn DM, Power RE. Catchment salt balances in the Queensland Murray-Darling Basin. J Hydrol. 2013;500:104-113. http://dx.doi.org/10.1016/j.jhydrol.2013.07.027 [ Links ]
17. Bugan RDH, Jovanovic NZ, De Clercq WPP The water balance of a seasonal stream in the semi-arid Western Cape (South Africa). Water SA.2012;38(2):201-212. http://dx.doi.org/10.4314/wsa.v38i2.5 [ Links ]
18. Jolly ID, Dowling TI, Zhang L, Williamson DR, Walker GR. Water and salt balances of the catchments of the Murray-Darling Basin. Technical Report 37/97. Dickson ACT: CSIRO Land and Water; 1997. [ Links ]
19. Biggs AJW. Rainfall salt loads in Southern Queensland, Australia. In: Proceedings of the 13th International Soil Conservation Organisation Conference: ISCO 2004; 2004 July 4-8; Brisbane, Australia. Warragul, VIC: Australian Society of Soil Science Incorporated; 2004. p. 1-4. [ Links ]
20. Keywood MD, Chivas AR, Fifield LK, Cresswell RG, Ayers GP The accession of chloride to the western half of the Australian continent. Aust J Soil Res. 1997;35:1177-1189. http://dx.doi.org/10.1071/S97001 [ Links ]
21. Allison LE, Bernstein L, Bower CA, Brown JW, Fireman M, Hatcher JT, et al. Diagnosis and improvement of saline and alkali soils. Agricultural Handbook No. 60. Washington DC: United States Department of Agriculture; 1954. [ Links ]
22. Slavich PG, Petterson GH. Estimating the electrical conductivity of saturated paste extracts from 1:5 soil, water suspensions and texture. Soil Res. 1993;31(1):73-81. http://dx.doi.org/10.1071/SR9930073 [ Links ]
23. Richards LA. Diagnosis and improvement of saline and alkali soils. Agricultural Handbook No. 60. Washington: United States Department of Agriculture; 1954. [ Links ]
24. Van Hoorn JW, Van Alphen HA. Salinity control. In: Ritzema HP, editor. Drainage principles and application. 16th ed. Wageningen: International Institute for Land Reclamation and Improvement; 1994. [ Links ]
25. Samuels D. Hydraulic properties of the vadose zone at two typical sites in the Western Cape for the assessment of groundwater vulnerability to pollution [MSc dissertation]. Bellville: University of the Western Cape; 2007. [ Links ]
26. Bugan RDH. Hydrosalinity fluxes in a small scale catchment of the Berg River (Western Cape) [MSc dissertation]. Bellville: University of the Western Cape; 2008. [ Links ]
27. White RE. Principles and practice of soil science: The soil as a natural resource. 4th ed. Victoria: Blackwell Publishing; 2006. [ Links ]
28. Cox J, Davies P Spouncer L. Water and soil degradation in the Keynes Catchment, South Australia. Technical Report 40/99. Dickson ACT: CSIRO Land and Water; 1999. [ Links ]
29. Sorensen R, Zinko U, Seibert J. On the calculation of the topographic wetness index: Evaluation of different methods based on field observations. Hydrol Earth Syst Sci. 2005;2:1807-1834. http://dx.doi.org/10.5194/hessd-2-1807-2005 [ Links ]
30. Bennetts DA, Webb JA, Stone DJM, Hill DM. Understanding the salinisation processes for groundwater in an area of south-eastern Australia, using hydrochemical and isotopic evidence. J Hydrol. 2006;323:178-192. http://dx.doi.org/10.1016/j.jhydrol.2005.08.023 [ Links ]
31. Lam NS. Spatial interpolation methods review. Am Carto. 1983;10:129-149. http://dx.doi.org/10.1559/152304083783914958 [ Links ]
32. Verhoff FH, Yaksich SM, Melfi DA. An analysis of total phosphorous transport in river systems. Hydrobiologia. 1982;91:241-252. http://dx.doi.org/10.1007/BF02391941 [ Links ]
33. Department of Water Affairs and Forestry (DWAF). South African water quality guidelines. Volume 4: Agricultural use: Irrigation. 2nd ed. Pretoria: DWAF; 1996. [ Links ]
34. Peck AJ, Hurle DH. Chloride balance of some farmed and forested catchments in southwestern Australia. Water Resour Res. 1973;9:648-657. http://dx.doi.org/10.1029/WR009i003p00648 [ Links ]
35. Jolly ID, Williamson DR, Gilfedder M, Walker GR, Morton R, Robinson G, et al. Historical stream salinity trends and catchment salt balances in the Murray-Darling Basin, Australia. Mar Freshwater Res. 2001;52:53-63. http://dx.doi.org/10.1071/MF00018 [ Links ]
36. Thayalakumaran T, Bethune MG, Mcmahon TA. Achieving a salt balance - Should it be a management objective? Agr Water Manage. 2007;92(1-2):1-12. http://dx.doi.org/10.1016/j.agwat.2007.05.004 [ Links ]
37. Wilcox LV. Salt balance and leaching requirement in irrigated lands. Report No 1290. Washington DC: Agricultural Research Service, US Department of Agriculture; 1963. [ Links ]
38. Gilfedder M, Walker G, Williams J. Effectiveness of current farming systems in the control of dryland salinity. Clayton, VIC: CSIRO Publishing; 1999. [ Links ]
39. Taylor G, Eggleton RA. Regolith, geology and geomorphology. Chichester: Wiley and Sons; 2001. [ Links ]
40. Charman PEV, Murphy BW. Soils - Their properties and management. Soil Conservation Commission of New South Wales. Sydney: Sydney University Press; 1991. [ Links ]
 Correspondence:
Richard Bugan
CSIR - NRE, PO Box 320
Stellenbosch 7599
South Africa
Email: rbugan@csir.co.za
Received: 09 June 2014
Revised: 09 Sep. 2014
Accepted: 16 Sep. 2014

