


Services on Demand
Article
 English (pdf)
 Article in xml format
 Article references
Indicators

Related links
-
 Cited by Google
 -
 Similars in Google
Share

 Permalink
South African Journal of Science
On-line version ISSN 1996-7489
Print version ISSN 0038-2353
S. Afr. j. sci. vol.111 n.5-6 Pretoria May./Jun. 2015
http://dx.doi.org/10.17159/sajs.2015/20140098
RESEARCH ARTICLE
A Rasch analysis of a Grade 12 test written by mathematics teachers
Sarah Bansilal
School of Education, University of KwaZulu-Natal, Pinetown, South Africa
ABSTRACT
There is much concern in South Africa about the low levels of mathematics achievement amongst learners. Aligned to this issue is that of mathematics teachers' proficiency in mathematics. The purpose of this study was to explore mathematics teachers' proficiency in the mathematics that they teach. A sample of 253 teachers' responses to a shortened Grade 12 examination was analysed using the Rasch model. When the teachers' proficiency and item location are represented on one scale, as is the case in Rasch measurement theory, it is expected that the teachers should be located beyond the difficulty level of the items as they teach the content to their learners. However, in this study, the teachers' proficiency was located close to the mean of the item locations. Furthermore, the levels of almost one-third of the group were below that of all the Level 3 and Level 4 items in the test. If such a result holds across other groups of teachers, it may explain why higher levels of passes in mathematics are not achieved. A second aim of this study was to illustrate how the application of the Rasch model can be used to contribute to a more informative and fair assessment. In line with Rasch measurement theory, the test was subjected to various analyses and the results were used to improve the fit of the items and the test.
Keywords: assessment; Rasch analysis; teachers' proficiency; Grade 12 mathematics; differential item functioning
Introduction
There have been many initiatives in South Africa since 1994 to improve the quality of education in the country, particularly in mathematics education. The interventions have sought to address concerns about the low level of mathematical skills in the country, which have been revealed by both international and national studies.1-3
Many studies point to mathematics teachers' poor content knowledge as one reason for low levels of learners' mathematics achievement.4-6 Hugo et al.7 reported on a KwaZulu-Natal study which found that none of the Grade 6 teachers were able to achieve 100% for the test on the curriculum that they were teaching, while 24% of the respondents achieved less than 50% on the test. On average, only 47% produced correct responses to each test item. Spaull4, in his analysis of the Southern and Eastern Africa Consortium for Monitoring Educational Quality (SAQMEQ) III results, revealed that the top 5% of Grade 6 learners (559 students) scored higher marks on the same mathematics test than the bottom 12.5% of Grade 6 educators (62 teachers) in the sample. There have been no similar studies about the content knowledge of mathematics teachers who teach in the Further Education and Training (FET) band which represents the final three years of schooling (Grades 10-12). One aspect of a larger study8 that was set up to investigate the content knowledge of Grade 12 mathematics teachers from a group of 253 practising mathematics teachers from the province of KwaZulu-Natal is reported on here. The corresponding research questions that guide this study are: (1) What does a Rasch analysis reveal about the mathematical proficiency of a sample of FET mathematics teachers in aspects of the mathematics they teach? (2) How can an application of the Rasch model to an assessment instrument contribute to improved scoring rubrics?
Rasch measurement theory
Note that with Rasch measurement theory (RMT) there is an assumption that for the construct of interest there exists a latent trait in the learner that may be gauged through the operationalisation of the construct through items. The latent trait is conceived as a single dimension or scale along which items can be located in term of their difficulty.9 With RMT, learner ability, denoted by βα, and item difficulty, denoted δi, may be represented on the same scale. Rasch analysis is then the formal testing of an outcome scale against a mathematical model developed by Rasch9.
The term 'measurement' is often used loosely in the assessment of social and educational constructs. By drawing on measurement in the physical sciences, and a classical theory of measurement, we note that the property of invariance across the scale of measurement is required.10 For example, the measure of the height of a population at two different sites should not differ, nor should the means of measuring (system of units) change for different objects. Rasch analysis is the process of examining the extent to which the responses from a scale approach the pattern required to satisfy axioms of measurement in order to construct measurement.11 In RMT, and in conformity with classical measurement theory, the requirement is that the data fit the model, rather than that the statistical model is adapted to fit the data. With RMT, the first step in approximating measurement is to define the construct being measured. The next step is to invoke a probabilistic process, a transformation that constructs natural units of measurement that are independent of both the construct and the persons being measured. This procedure involves converting a raw score percentage into its success-to-failure odds and then to its natural logarithm.12 Similarly for items, the percentage of correct responses for the item is calculated and converted to a logarithm of the correct-to-incorrect odds for the item. This log-odds transformation of raw data is a first approximation of the Rasch measurement scale. Thereafter these estimations are then subjected to a series of iterations by the computer, allowing the student ability and item difficulty to be located on a common continuum so that a genuine interval scale using logits is produced.12
The Rasch simple logistic model for dichotomous items is given in Equation 1.13 In RMT, the equation which relates the ability of learners and the difficulty of items is given by the logistic function:
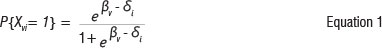
This function expresses the probability of a person v, with ability βν responding successfully on a dichotomous item i, with two ordered categories, designated as 0 and 1. Here P is the probability of a correct answer; Xvjis the item score variable allocated to a response of person v, on dichotomous item i; and Sjis the difficulty of item i.
Applying Equation 1, we can see that if a person v is placed at the same location on the scale as an item labelled i, then βν= δi, that is, βν- δi = 0, and the probability in Equation 1 is thus equal to 0.5 or 50%. Thus, any person will have a 50% chance of achieving a correct response to an item whose difficulty level is at the same location as the person's ability level. If an item difficulty is above a person's ability location, then the person has a less than 50% chance of obtaining a correct response on that item, while for an item whose difficulty level is below that of the person's ability, the person would have a greater than 50% chance of producing the correct response. Figure 1 illustrates this relationship for a single item.
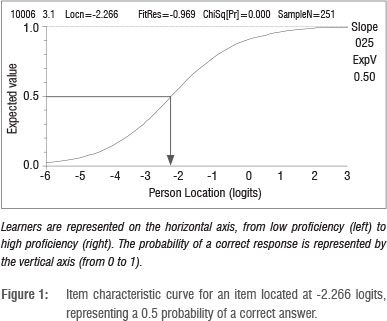
The item characteristic curve (ICC) depicted in Figure 1 represents the alignment of item difficulty and person ability. Learners are represented on the horizontal axis from low proficiency (to the left, towards -6) to high proficiency (to the right towards +1). The probability of a correct response is represented by the vertical axis (from 0 to 1). The person located at -2.266 logits has a 0.5 probability of answering this item correctly.
As ability varies, the probability of a correct response to the item also varies. The probability that a person with low proficiency will respond correctly is correspondingly low, approaching 0 asymptotically as ability decreases. Symmetrically, the probability that a person with high proficiency will respond correctly is correspondingly high, and approaches 1 asymptotically as proficiency increases.
Figure 2 shows both the probability of responding correctly and incorrectly, where:
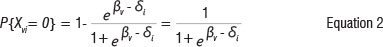
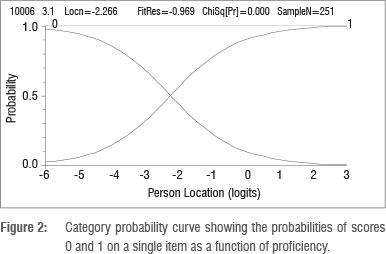
The location of the item is identified as the point on the ability scale where the probability curves of 0 and 1 intersect. At this point, the probability of a response of either 0 or 1 is equally likely. Because it is a dichotomous item, there is a probability of 0.5 of either response. The probability of a correct response decreases as proficiency decreases, and increases as proficiency increases, around this point. The item shown in Figure 2 has a location of -2.266 logits.
The simple logistic model was developed by Rasch9 for the analysis of dichotomously scored test items. Many assessment programmes, however, require greater precision or more information than a simple right/wrong scoring system allows from any particular item. In these cases, polytomously scored items with several levels of performance may be required. Rasch's9 formulation of the model for polytomously scored items is an extension of the simple logistic model. Instead of dealing with dichotomous items with two response categories, and possible scores of 0 and 1 only, it provides a model for test items withmore than two response categories, with possible scores of 0,1,2.....m. Andrich14 derived a model which gives the probability of a person with ability βνbeing classified in a category x in a test item of difficulty δί, with m+1 ordered categories as:
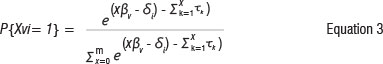
where x ε{1,2....m} and τχ are the thresholds. In Equation 3 the threshold parameters are not subscripted by i, indicating they are assumed identical across items, making it possible to estimate one set of thresholds which hold for all the items.13 If thresholds are different across items, the model takes the form of Equation 4:
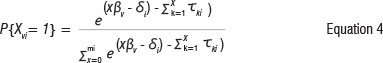
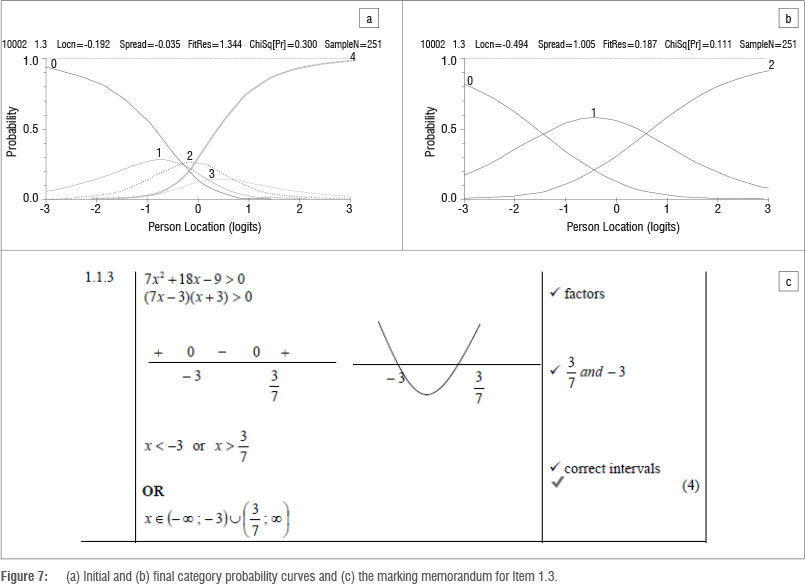
The model of Equation 3 has become known as the ratings scale model and the model of Equation 4 has become known as the partial credit model. Here the partial credit model is used because it is less restrictive and allows the distances between the response categories to emerge from the data rather than being imposed on the data and also because each of the items had a different number of categories. The term 'threshold' defines the transition between two adjacent categories, for example between scoring 0 and 1 (τ1), or scoring between 1 and 2 (τ2). Figure 3 shows the category curves for Item 1.3
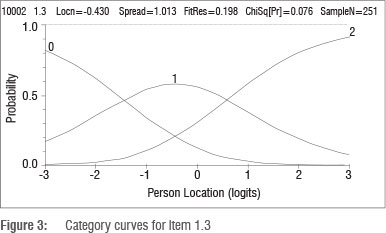
In Figure 3, there are three category curves corresponding to the probabilities of obtaining a score of 0, 1 or 2. The thresholds, and the categories they define, are naturally ordered in the sense that the threshold defining the two higher categories of achievement is of greater difficulty than the threshold defining the two lower categories of achievement. The first threshold (τ1), which represents the point where a score of 1 becomes more likely than a score of 0, is about -1.5 logits. The second threshold, where a score of 2 becomes more likely than a score of 1, is approximately 0.6 logits. These thresholds show that progressively more ability is required to score a 1 than a 0 and a 2 than a 1 on this item.
Method
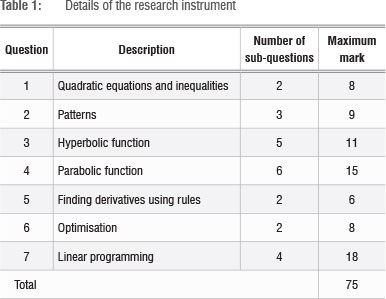
In this study, the data collection instrument was a shortened form of the National Senior Certificate March 2011 supplementary examination written by Grade 12 mathematics students (see Appendix 1 in the online supplementary material). The instrument was shortened to seven questions because of time constraints. The topics of the different questions that appeared in our data collection instrument are summarised in Table 1 while those that were excluded were arithmetic and geometric sequences, simultaneous equations, exponential functions, financial mathematics and cubic graphs.
The instrument was administered to the teachers under test conditions, and teachers who consented were given 2 h to write the test. The participants were given detailed feedback about their performance in the test so that they could improve on their weak areas. The teachers were from different districts in KwaZulu-Natal and were enrolled in an Advanced Certificate in Education programme, which is designed for upgrading the skills of teachers who have a 3-year diploma from a teaching college. However, approximately 20% of the group were already fully qualified teachers. A condition for selection into the programme is that a teacher must be teaching mathematics at the FET level at that time. Of the group of approximately 350 teachers, there were 286 who agreed to participate in this study. The teachers' responses were then marked by two experts who had many years of experience in marking matric examination papers. Marks were then captured for each item. The items were categorised into the assessment taxonomy levels15 by three mathematics education experts, including the author, who coordinated the programme8. The data were then cleaned and anomalies and inconsistencies were removed with respect to missing details or missing records. The total number of records analysed was 253.
Sample size
The general rule for the construction and development of test instruments is that the learner count is about 10 times the maximum score count.16 In this analysis, the test consisted of 24 items which were made up initially of 75 marks in total, that is 75 thresholds. In that situation, a sample size of 253 is small, because the recommended sample size should be 10-20 persons per threshold, which would be at least 750 persons. However, with the rescoring process, the number of thresholds considered was 42, which means, although closer, the sample size is still smaller than the recommended size of 420 persons.
The results of the Rasch analysis
A requirement of RMT is that the data fit the model, in order to claim measurement within the model's framework. The properties of Rasch measurement apply only to the extent to which the data fit the model's demanding requirement.12 When the data fits a Rasch model, suitable transformation of the raw total scores for persons and raw frequencies of score categories of each item will enable calculation of estimates for both learner ability parameters and all item thresholds and average difficulty levels.17 All these estimates may then be legitimately represented and located on the same scale or linear dimension,17 from which inferences can be made based on an interpretation within the context. The fit statistics are used to help detect discrepancies between the Rasch model prescriptions and the data that is collected in practice, and these are first considered in this section. This step is followed by a report on the individual item analysis, and the post-hoc changes that were made to the scoring. Tests for differential item functioning or item bias are then reported. DIF can also affect fit to the model and occurs when different groups within the sample respond in a different manner to an individual item. As recommended by Tennant and Conaghan11, it was also necessary to check for response dependency and multidimensionality in the items, which, if present, are a breach in the assumption of local independence of items. The final test statistics are then presented, followed by a discussion of the person-item map.
Initial analysis
Rasch analysis can be undertaken with software such as WINSTEPS, RUM2030, and ConQuest. Each reports findings in slightly different ways, but with a main focus on testing whether the response pattern observed in the data is close to the theoretical pattern predicted by the model. RUMM2030 was used in this study. This software reports fit statistics in terms of item and person fit residual statistics which are an indication of the differences between their actual and expected responses. RUMM2030 also reports on item-trait interaction chi-square, which reflects the property of invariance across the trait.
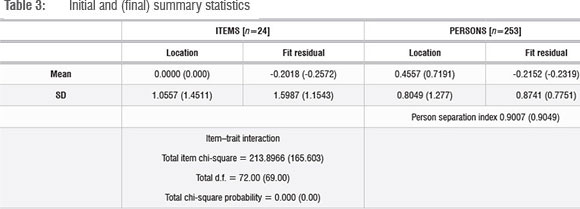
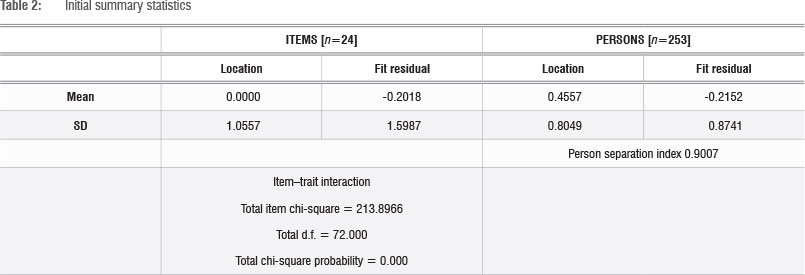
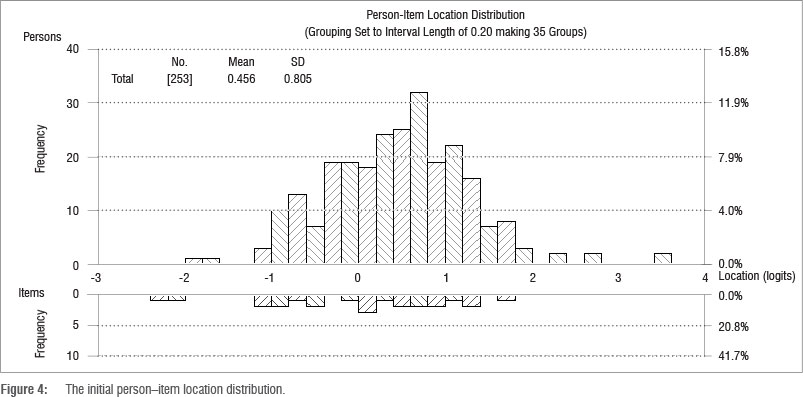
From the initial Rasch analysis, the summary statistics (Table 2), person-item location distribution (Figure 4) and person-item threshold distribution (Figure 5) were generated. Table 2 presents the initial summary statistics, which shows the item mean as 0 (as set by the model) and the person mean as 0.4557, which is slightly above zero, showing that generally the students found the test comfortable. The standard deviation for the item location is 1.0577, which is just above the ideal value of 1 while the standard deviation of the person location is 0.8049, which is less than 1, suggesting that the distribution of the person locations is clustered together.
The mean of the item fit residual (-0.2018) is close to zero. The standard deviation of the item fit residual is 1.5987, larger than 1, which means that the fit varies more than expected. Similarly, the mean of the person fit residual is approximately -0.2 and the standard deviation of the person fit residual is 0.8741, which is slightly smaller than 1, showing that the distribution of the person fit residuals is slightly more clustered than the ideal situation.
In terms of reliability, in RUM2030 an estimate of the internal consistency reliability of the scale is the person separation index. The statistic of the person separation index in Table 2 is very good - over 0.9, which is higher than the minimum of 0.85 advised by Tennant and Conaghan11. This shows that the estimation of the person's ability is consistent across the model. In this case the figure is 0.9007 which indicates that the persons have been separated well by the test. The item trait interaction figures have a chi-square value of 213.897 with a probability value of 0.000, which is significant and means that the hierarchical ordering of the items may vary across the trait.
Person-item location distribution
The person-item location distribution (PILD) and the person-item threshold distribution were then generated. The item locations range from -2.389 to about 1.082 logits. The person locations are estimated between -1.905 and about 2.728 (with a mean of 0.456), with two people obtaining extreme scores (full marks) being estimated at 3.499 logits. The fact that the person location is higher than the mean of the item location, suggests that this Grade 12 test was slightly easy for this particular group of teachers.
For polytomous items, as is the case in this test, a person-item threshold distribution is useful to better understand the spread of the item thresholds. Figure 5 illustrates that the thresholds range from below -2 to above 3, showing a much wider distribution than the items themselves.
Individual item analysis
The Rasch analysis may indicate that the scoring rubric of items is working as required by the model in order and contributing to the measure of learner proficiency or it may identify items where the scoring rubric is not working in an ordinal way. The graphical analysis provided by the ICC (see Figure 1) and the category probability curves (see Figures 2 and 3) can be used to check item functioning.
In a Rasch analysis test of fit, the learners are placed into class intervals and the average ability of each class is calculated - in this study there were four class intervals. The mean ability of the four groups becomes the horizontal coordinate of points in the diagrams and the vertical coordinates depict the probability of answering correctly.18
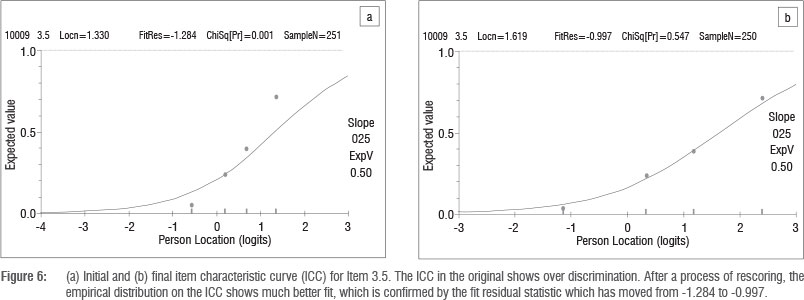
When the theoretical curve (the expected frequencies) and the observed proportions (the empirically established average of the actual item scores in the four chosen groups) are in alignment, we assume fit to the model, as depicted by the ICC in the right-hand side of Figure 6. On the other hand, a substantial deviation of the observed proportions from the theoretical curve signals some sort of misfit between the data and the model (for example, the first ICC on the left-hand side of Figure 6). There are four categorisations that describe how the observed proportions might relate to the theoretical expectation; these categorisations are described in detail with examples in an article by Long et al.18
Each of the 24 items was checked for the item fit statistics, ICC, as well as the functioning of the categories. Based on these diagnostic procedures, some items were rescored if such a rescoring was supported by the qualitative analysis, as described in the discussion following Figure 7. Appendix 2 in the online supplementary material provides a summary of the processes that were followed and the decisions that were taken for each of the items.
Appendix 2 indicates that the initial analysis identified Items 14, 19 and 24 as having misfit statistics, outside the recommended limits of -2.5 to 2.5 logits.12,13 The ICC and category probability curves for each item were checked, and, if a rescoring was suggested by the analysis and the rescoring was supported by the qualitative analysis, then the item was rescored. The details of this process are described in Appendix 2. This rescoring process resulted in improved fit residual statistics for the misfit items. However, the fit residual statistic for Item 5 (-3.162) was outside the generally acceptable interval of between -2.5 and 2.5. This item was rescored again, resulting in a better fit residual statistic of 0.928. Based on the rescoring process, the fit residuals of other items improved and some regressed slightly, but there was no longer any significant misfit.
Examples of two items (Question 1.3 and Question 3.5) whose category probability curves and ICCs improved with the rescoring are demonstrated in Figures 6 and 7.
Van Wyke and Andrich19 explain that when ordered thresholds emerge in the Rasch analysis of responses to an item, these provide confirming evidence that the hierarchy of responses identified in the scoring rubric reflects the underlying order of the proficiency continuum. And disordered thresholds provide evidence that the scoring rubric for the item does not reflect the underlying proficiency continuum. Van Wyke and Andrich19 suggest that disorder in the thresholds signals that the item has failed to function as intended, which presents an opportunity to rescore the items to try to reflect the hierarchy of responses. An observation of Item 1.3 in Figure 7 reveals disordered thresholds in the empirically derived initial category curves, suggesting that categories 1 and 3 are not working well. The problem is that the locations of the first and third thresholds are respectively greater than that of the second and fourth thresholds. These reversed thresholds are a result of the failure of the two categories, corresponding to scores of 1 and 3, to function as intended. At no point on the horizontal axis is a score of 1 most likely; neither is there an interval or point where a score of 3 is most likely. The thresholds suggest that achieving a score of 2 did not require more proficiency than achieving a mark of 1 and achieving a score of 4 did not require more proficiency than achieving a mark of 3. An examination of the marking memorandum in Figure 7 shows why this might be so. If the quadratic expression was factorised correctly (hence achieving the first mark), then obtaining one of the critical values (second mark) follows easily. Similarly, obtaining one correct interval (third mark) was not experienced as more difficult than getting both (fourth mark). Hence categories 1 and 2 were collapsed into 1 and categories 3 and 4 were rescored as 2. The category curves after the rescoring show that the categories are working much better. This item illustrates how rescoring can lead to a fairer outcome. Learners who produced the correct intervals were advantaged by scoring four points instead of two, while those who could not, were unduly penalised by 'losing' four possible points instead of two. The combination of these qualitative analyses of item content together with the empirical results, helps us identify possible anomalies and inconsistencies in the scoring rubrics which can alert us to possibilities that should be considered when devising scoring rubrics. A similar analysis, considering both the qualitative analysis of item content together with the empirical results, was conducted on each item.
Differential item functioning
Differential item functioning (DIF) is present when examinees from different groups have differing probabilities or likelihoods of success on an item, after they have been matched on the ability of interest.20 That is, people from two groups, who have the same ability ranking, will perform differentially on the item with DIF. In order to preserve the unidimensionality trait of the construct under measurement, an important aspect of Rasch analysis is the investigation of the presence of DIF in the various items. For this sample, the first person factor that was considered was language. Sometimes the language used to describe the task is complicated and can pose a bigger challenge to second language speakers than first language speakers. Hence two levels of language were considered - English spoken as a first language and English spoken as a second language. Gender (female, male) was another factor that was investigated.
Before investigating for DIF in gender, the mean locations for each gender were determined. The mean location of the female group was -0.291 while that for the male group was 0.586. The probability value was 0.0036, showing that the difference was statistically significant. However, none of the specific items displayed DIF in terms of gender.
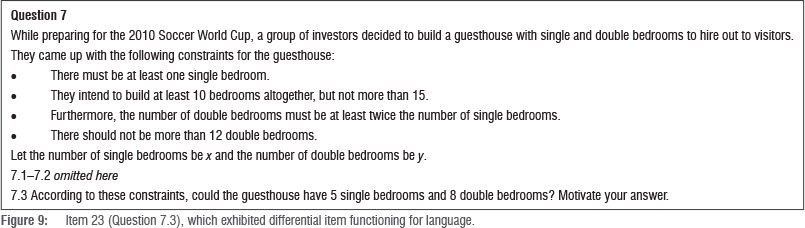
For the DIF for language, the mean location of the English second language group was not significantly different from that of the English first language group. However, one item that displayed significant DIF in terms of language was Item 7.3, shown in Figure 8.
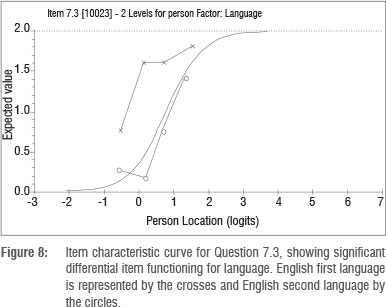
Here the separate and sometimes parallel curves for the two groups suggest that there is uniform DIF present. As is evident in Figure 8, people at the same ability rankings have different probabilities of success for this item, based on the language person factor. For Item 23 the DIF [language] F-ratio is 22.26 with a probability value of 0.0000, showing a uniform DIF effect for language. For further technical details of detection and treatment of DIF, the reader is referred to the work by Andrich and colleagues13,20.
Question 7.3 was part of the linear programming question and appears in Figure 9. A perusal of this question shows that the correct solution required the teachers to unpack the introductory information - the four statements signalling the constraints as well as the instruction. For a deeper understanding of the teachers' struggles, it may be helpful to consider the 'lexical density' of the instructions. Halliday21 suggests that scientific (and mathematical) texts have a very high 'lexical density'. That is, they have a large number of lexical items (or content words) per clause. Informal spoken language has a lexical density of about two content words per clause, and written English has a lexical density of about four to six words per clause. The analysis of the instruction of Question 7.3 shows that the second clause has a lexical density of approximately 10 content words per clause. The third bulleted statement has a lexical density of 10. The other items in Question 7 (7.1; 7.2; 7.4) did not indicate DIF by language, indicating that English second language speakers who were on the same ability level as English first language speakers experienced those items as equally difficult. However, answering Question 7.3 correctly was harder for second-language English speakers than it was for first-language English speakers. The location for Question 7.3 for English second language teachers was 1.847 logits while the corresponding location of the item for English first language teachers was -0.488, showing that English second language teachers experienced this item as much more difficult than did English first language teachers. It was decided to delete the item because it was not a fair question.
Response dependency and multidimensionality
The assumption of unidimensionality in a Rasch model may also be violated through response dependency between items or by multidimensionality.11 Response dependency manifests when items are linked in some way, so that a person's response on one item depends on the response to another item. In checking for response dependency, the item residuals matrix indicated no significant response dependency between items. In order to check for multidimensionality, a principal components analysis of the residuals showed no significant patterns in the residuals. For more details of a test that can be used to detect response dependency and multidimensionality the reader can consult Smith22.
Final statistics
A final analysis was then done by including the rescoring process that was indicated. Recall that Question 7.3 was deleted because it displayed DIF. The individual item fit statistics then revealed that none of the items was displaying significant misfit, with the fit residual statistics ranging from -1.891 to 2.082. Furthermore, the DIF summary revealed no significant DIF effects for gender or language.
In conclusion we look at the overall fit statistics again. For the distribution of the items, the fit residual statistics show slight differences from the initial statistics. The mean of the fit residual for the items has become a larger negative number, moving a bit further from the ideal of 0. The standard deviation of the fit residual has moved closer to the ideal figure of 1. With respect to the person distribution, the mean of the fit residual has moved slightly from the ideal of 0 and the standard deviation has decreased, moving slightly further from the ideal of 1.
The standard deviation on the item locations is now 1.770, showing a wider spread than the original situation. The person location mean is now 0.7191, which reflects a higher proficiency than originally estimated. The standard deviation has increased, showing that there was much more variation in the person locations than originally estimated. The p-value of the chi-square statistic remained at p=0.000. The person separation index has remained above 0.9, showing that the test was able to differentiate between person proficiencies.
Person-item map
The Rasch ordering of the items, as compared to the cognitive levels of the items according to the Department of Basic Education assessment taxonomy,15 is summarised in Table 4.
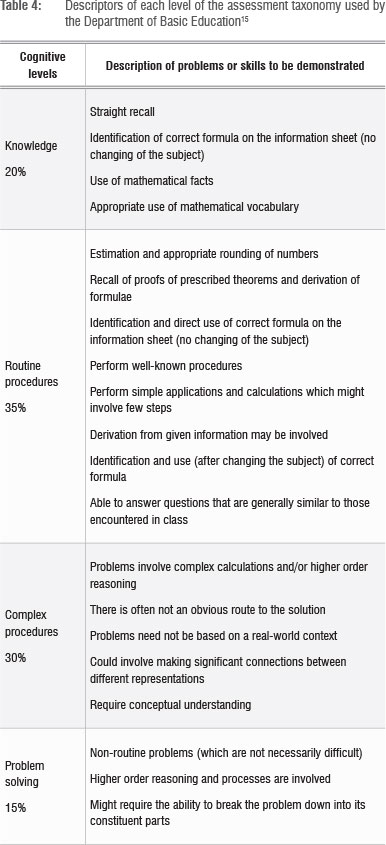
The ordering of the items shows that the empirical difficulty of items classified at the higher levels of the taxonomy was generally higher than those items classified at the lower levels of the taxonomy. The item difficulty was highest for Item 20 (Question 6.2), which was classified as Level 4, while that of Item 3, classified as Level 1 in the taxonomy, was the lowest. However, every item at a certain level may not necessarily be more difficult than all the items at a lower level. Sometimes certain items may, with practice, become easier to handle, or an alternative solution may provide a less complicated solution path than the expected one. This seems to have been the case for some items in this study in which not all the items in Level 4 were experienced as more difficult than items in Level 3. The item difficulty location for Item 24 (categorised as Level 4) was the same as that of Item 13 (classified as Level 2). It is also noted that the item difficulty of Items 13 and 4, which are on Level 2, were higher than some Level 3 items. Also, the item difficulty of Item 1 (Level 1) was higher than that of some items classified at Level 2. However, except for these four items, the empirical difficulty level of an item at a higher level of the taxonomy was higher than that of an item at a lower level of the taxonomy.
Figure 10 reveals a somewhat disturbing picture of many items being beyond the proficiency level of the teachers. For example, there are two teachers whose proficiency levels were measured as being lower than the difficulty levels of all the items, suggesting that these teachers could not fully answer any of the items. For 66 of the teachers, the location of all the items categorised at Levels 3 and 4 were beyond the location of their ability levels. This finding means that there is a low probability of the teachers producing correct answers to Level 3 and Level 4 items. Items placed at Level 3 (complex procedures) are those for which the solution is not straightforward and requires connections across concepts. According to the Department of Basic Education15, Level 3 items should constitute 30% of the examination paper, while the Level 4 (problem solving) items dealing with the non-routine should constitute 15% of the paper. A burning question then arises: how will these teachers support their learners to handle those types of questions which account for 45% of the mathematics Grade 12 examination paper?

Discussion and concluding remarks
A rubric for assessment is essentially contributing to a description of a scale for measurement of the construct that is being assessed, in this case proficiency in mathematics. This suggests that for a test to have a fairer outcome, it is important that the rubrics are aligned with tenets of measurement. That is, if the total score allocated is made up from a sum of items, it is important to ensure that the test fulfils the measurement axioms. Tennant and Conaghan11 explain that Rasch analysis allows for a unified approach to many measurement issues: testing the internal construct of the scale for unidimensionality, required for a valid summed raw score; response dependency and multidimensionality; appropriate category ordering of polytomous items (whether or not the category ordering of polytomous items is working as expected); and DIF (whether bias exists for an item among subgroups in the sample).
In this study, the overall fit statistics, which are an indication of how well the data fits the model, were considered first. Thereafter, individual items were analysed using the fit residual statistics, category probability curves and the ICCs together with a qualitative content analysis. It was evident that, by changing the scoring rubrics of certain items, the items produced better fitting category probability curves, and better fit statistics in most cases. No significant response dependencies were detected between items or multidimensionality. The analysis also revealed the presence of DIF with respect to the person factor of language in one item, which was evidence of bias in that item. Hence the item was deleted. After this analysis, the post-hoc improvements allowed greater precision than the original instrument scoring and the scoring was more consistent with the intentions of the scoring.
This analysis revealed that the test followed principles of good test design because the data fitted the model so well. The person-item location distribution showed a reasonable spread of items and people, and the test was targeted well at the sample. The mean of the person locations at 0.4556 logits was close to zero, suggesting that the test was a bit easy for the sample. However, this was a Grade 12 examination written by teachers who prepare their learners to write this examination. As such, as a group, their performance should have been much higher. The results suggest that questions based on complex procedures and those involving problem solving were beyond the competencies of many of these teachers. This study was carried out with 253 teachers representing approximately 16% of the 1581 public high schools in KwaZulu-Natal23, and hence cannot be considered as a representative sample. However, the poor results of the teachers underscores the urgency of interventions that can succeed in improving the mathematics content knowledge of teachers. Stakeholders such as national and provincial education departments, universities and subject advisors need to collectively determine the extent of the problem of poor knowledge and to then design a systematic intervention that targets those teachers who require help. Such an intervention can work only if it is planned at a micro-level and implemented in fine detail that takes into account district factors, school factors and teacher factors.
In conclusion, it has been illustrated that Rasch measurement theory can be used to contribute to improving the scoring of an assessment instrument, and it is hoped that other researchers may opt to use the methodology in different assessment settings. The study also revealed low proficiency levels of practising FET teachers who are expected to teach learners who will be writing similar examinations as the one used in this study. A recommendation is that FET mathematics teachers urgently need to be provided with opportunities that could help improve their proficiency levels, so that the possibility of teachers teaching learners content that they themselves do not know, is eliminated.
Acknowledgements
Funding for this study was provided by the National Research Foundation (grant number ESA2010081300001).
References
1. Howie S. A national assessment in mathematics within an international comparative assessment. Perspect Educ. 2004;22(2):149-162. [ Links ]
2. Reddy V Mathematics and science achievement at South African schools in TIMMSS 2003. Cape Town: Human Sciences Research Council; 2006. [ Links ]
3. Soudien C. The 'A' factor: Coming to terms with the question of legacy in South African education. Int J Educ Develop. 2007;27:182-193. http://dx.doi.org/10.1016/j.ijedudev.2006.07.006 [ Links ]
4. Spaull N. A preliminary analysis of SACMEQ III South Africa [report]. Stellenbosch: Stellenbosch University; 2011. [ Links ]
5. Centre for Development and Enterprise (CDE). Value in the classroom: The quantity and quality of South Africa's teachers. CDE in Depth. 2011:11. [ Links ]
6. Mji A, Makgato M. Factors associated with high school learners' poor performance: A spotlight on mathematics and physical science. S Afr J Educ. 2006;26(2):253-266. [ Links ]
7. Hugo WJM, Wedekind V Wilson D, et al. The state of education in KwaZulu-Natal: A report to the Provincial Treasury. Pietermaritzburg: KZN Provincial Treasury; 2010. [ Links ]
8. Bansilal S, Brijlall, D, Mkhwanazi TW. An exploration of the common content knowledge of high school mathematics teachers. Perspect Educ. 2014;32(1):34-50. [ Links ]
9. Rasch G. Probabilistic models for some intelligence and attainment tests (expanded edition with foreword and afterword by B.D. Wright). Chicago: University of Chicago Press; 1980. [ Links ]
10. Wright BD. A history of social science measurement. Educ Meas Issues Pract. 1997;Winter:33-45. [ Links ]
11. Tennant A, Conaghan PG. The Rasch measurement model in rheumatology: What is it and why use it? When should it be applied and what should one look for in a Rasch paper? Arthritis Rheum. 2007;57(8):1358-1362. http://dx.doi.org/10.1002/art.23108 [ Links ]
12. Bond TG, Fox CM. Applying the Rasch model: Fundamental measurement in the human sciences. 2nd ed. Mahwah, NJ: Lawrence Erlbaum; 2007. [ Links ]
13. Andrich D. Introduction to Rasch measurement of modern test theory [course notes]. Perth: University of Western Australia; 2012. [ Links ]
14. Andrich D. A rating formulation for ordered response categories. Psychometrika. 1978;43:561-574. http://dx.doi.org/10.1007/BF02293814 [ Links ]
15. Department of Basic Education (DBE). Curriculum and assessment policy statement (CAPS): Mathematics Grades 10-12. Pretoria: DBE; 2011. [ Links ]
16. Linacre JM. Understanding Rasch measurement: Optimizing rating scale category effectiveness. J Appl Meas. 2002;3(1):85-106. [ Links ]
17. Dunne T, Long C, Craig T, Venter E. Meeting the requirements of both classroom- based and systemic assessment of mathematics proficiency: The potential of Rasch measurement theory. Pythagoras. 2012;33(3), Art. #19, 16 pages. [ Links ]
18. Long C, Bansilal S, Debba R. An investigation of mathematical literacy assessment supported by an application of Rasch measurement. Pythagoras. 2014;35(1), Art. #235, 17 pages. [ Links ]
19. Van Wyke J, Andrich D. A typology of polytomously scored items disclosed by the Rasch model: Implications for constructing a continuum of achievement. Perth: Murdoch University; 2006. [ Links ]
20. Andrich DA, Hagquist K. Real and artificial differential item functioning. J Educ Behav Stat [serial on the Internet]. 2011 Sep 21 [cited 2014 Jun 15]. Available from: http://jebs.aera.net [ Links ]
21. Halliday MAK. Some grammatical problems in scientific English. In: Halliday MAK, Martin JR, editors. Writing science: Literacy and discursive power. London: Falmer; 1993. p. 69-85. [ Links ]
22. Smith E. Detecting and evaluating the impact of multidimensionality using item fit statistics and principal component analysis of residuals. J Appl Meas. 2002;3(2):205-231. [ Links ]
23. KwaZulu-Natal Department of Education. 2011 Snap survey report for ordinary schools. Pietermaritzburg: KwaZulu-Natal Department of Education; 2011. [ Links ]
 Correspondence:
Sarah Bansilal
School of Education, University of KwaZulu-Natal
Private Bag X03, Pinetown 3605, South Africa Bansilals@ukzn.ac.za
Received: 20 Mar. 2014
Revised: 15 June 2014
Accepted: 10 Sep. 2014

