


Servicios Personalizados
Articulo
 Inglés (pdf)
 Articulo en XML
 Referencias del artículo
Indicadores

Links relacionados
-
 Citado por Google
 -
 Similares en Google
Compartir

 Permalink
South African Journal of Science
versión On-line ISSN 1996-7489
versión impresa ISSN 0038-2353
S. Afr. j. sci. vol.111 no.3-4 Pretoria mar./abr. 2015
http://dx.doi.org/10.17159/sajs.2015/20130391
RESEARCH ARTICLE
An investigation of the nature of a Pc5 pulsation event using SuperDARN and magnetometer data
Zolile Mtumela; Judy A.E. Stephenson; Anthony D.M. Walker
School of Chemistry and Physics, University of KwaZulu-Natal, Durban, South Africa
ABSTRACT
Pc5 pulsations are global magnetohydrodynamic events in the magnetosphere. We employed an Automated Pulsation Finder program to identify significant Pc5 pulsation events in SuperDARN radar data. The event presented here was visible in the Goose Bay, Saskatoon and Þykkvibaer high-frequency radars, located in the northern polar region. These observations were coordinated with magnetometers within their field of view. These two instrument types - radars and magnetometers - complement each other. These observations represent a significant fraction of the globe in longitude. Pulsation studies of this nature are rare in the literature. Combining these two instrument types, we investigated the nature of the pulsation and determined its qualitative polarisation characteristics. A complex demodulation technique was employed to determine amplitude and phase relationships between field components observed by the radars and magnetometers, which, in turn, afforded resolution of other characteristics of pulsations, such as wave number and phase velocity. The results are discussed in the context of the magnetohydrodynamic theory of magnetic pulsations, speculating on its generation mechanism. Investigation of this mechanism will be the subject of a future publication.
Keywords: magnetospheric physics; MHD waves; geomagnetic pulsations; polar ionosphere; HF radars
Introduction
Ultra-low frequency (ULF) hydromagnetic waves, often referred to as geomagnetic pulsations, have been observed for many years in magnetometer data as well as by very high frequency (VHF) and high-frequency (HF) radars, and are endemic within the magnetosphere. A subset of these waves, pulsations in the Pc5 band (1-5 mHz), are global magnetohydrodynamic events in the magnetosphere. Numerous papers have reported the observation of Pc5 pulsations with power at discrete and stable frequencies, the most commonly occurring being at frequencies of 1.3 mHz, 1.9 mHz, 2.6 mHz and 3.3-3.4 mHz.1-5 The quantisation of the resonance frequencies is predicted by the cavity mode theory which was first developed by Kivelson and Southwood1 and later modified into waveguide theory1,6 to account for the azimuthal propagation of the compressional mode. However, Ziesolleck and McDiarmid7 showed that the waveguide/cavity mode frequencies do not necessarily represent a unique set of frequencies. In order to understand the stability and reproducibility of these frequencies, many authors have focused on investigating possible excitation mechanisms.4,8-11
A field line resonance is essentially a standing shear Alfvén wave on a magnetic field line between the two conducting ionospheres.12 Field line resonances can arise from an external influence in the solar wind, such as Kelvin-Helmholtz instability, or from an abrupt change in solar wind dynamic pressure, coherent waves in solar wind, which in turn can excite field lines inside the magnetosphere into compressional oscillation.13 The field lines on the L-shell with the same characteristic frequency will resonate and large oscillations will be set up over a narrow range of latitudes. Southwood14 and Chen and Hasegawa15 predicted that an enhancement in amplitude at the resonance L-shell is accompanied by a phase change of approximately 180°. This behaviour is the result of the fact that L-shells nearer the earth have higher frequencies than the driver and lead it in phase, whereas those that are near magnetopause have lower frequencies than the driver and lag it in phase. Walker et al.16 provided compelling evidence in favour of this theory by using STARE radar data to plot the amplitude and phase of an electric field. Field line resonances generated by all these mechanisms tend to have small azimuthal wave numbers, m. The generation mechanism remains in debate. All the mechanisms mentioned above have been shown to be present.
Another type of pulsation in the Pc5 band can be generated by drift-bounce resonance with energetic ring current particles. These are often compressional in nature and tend to have larger values of m. The drift-bounce resonance occurs when a particle drifts in one bounce period by an integral number of azimuthal wavelengths, Doppler shifted by the azimuthal phase velocity of the wave. The high-energy particles which constitute the bulk of the ring current may be responsible for exciting compressional Pc5 through drift-bounce resonance.17,18 The resonant particle has a drift path which oscillates between L-shells at the same characteristic frequency as the oscillations in perpendicular, parallel and total particle kinetic energy.
The drift-bounce resonant interaction of the energetic ring current particle with Alfvén waves has been proposed as a possible excitation mechanism.19
Magnetometers and HF radars are synergistic instrument types. Magnetometers have high temporal resolution whilst HF radars have good spatial resolution. Furthermore, ionospheric conditions not conducive to observing pulsations in radar data are favourable for observations in magnetometer data, and vice versa. In this study, we used three SuperDARN HF radars together with ground-based magnetometers to study a Pc5 pulsation event. SuperDARN is an international project of which the South African radar at SANAE, Antarctica forms a part. Our emphasis in this study was the determination of the physical character of the Pc5 pulsation, using HF radar and magnetometer ground-based instruments. An event was identified by using the pulsation finder to find a significant pulsation in one HF radar and then proceeding to search for a similar resonance in other radars and magnetometers at similar magnetic latitudes.
Instrumentation
We focused on a Pc5 pulsation event occurring between 20:00 and 22:00 UT on 6 October 2006 observed by the Saskatoon, Goose Bay, and Pykkvibaer HF radars. These three radars are part of the SuperDARN international network of HF radars that monitor ionospheric plasma convection over an extensive area of mid- and high latitudes in both hemispheres. The HF radars of the system each operate in a frequency range of 8-20 MHz, and use an electronically phased antenna array to sweep the beam through successive positions with azimuthal separation of 3.24°. In full scan mode, a radar runs through a 16-beam scan with a dwell time of between 3 s and 7 s (depending on the radar), which gives a full 16-beam scan that covers 52° in azimuth once every 1 min or 2 min, respectively. For each beam, the backscatter power, line-of-sight Doppler velocity, and spectral width are gated in up to 75 cells. These are 45 km long in standard operation extending from an initial range of 180 km. The spatial coverage of an HF radar is up to 2000 χ 2000 km2. HF radars operate by utilising coherent scatter from field-aligned irregularities of electron density in the E- and F-regions of the ionosphere. They 'see' the electric field perturbation associated with the pulsation and not the magnetic field. This distinction has implications for which kind of pulsations (compressional or Alfvén) are seen by the different beams. Their spatial coverage makes them ideal tools for resolving pulsation resonance structures. The ULF oscillations in these ionospheric regions are observable in the line-of-sight Doppler velocity, with the magnitude of the measured flow oscillations being dependent upon the direction of the flow oscillations relative to the beam direction. Pc5 oscillations in the F-region are therefore visible as alternating bands of negative and positive Doppler velocities. The F-region has previously been shown to be associated with Pc5 field line resonance.2,20,21
The magnetometer data were obtained from the Greenland Magnetometer Array22, the Canadian Array for Realtime Investigations of Magnetic Activity (CARlSMA)23 and the International Monitor for Auroral Geomagnetic Effects (IMAGE)24. The Greenland, CARISMA and IMAGE arrays cover polar cap, cusp and auroral regions. The large latitudinal coverage allows features such as the phase change across resonance and the amplitude peak of the wave to be observed. Each station is equipped with a three-component ring core fluxgate magnetometer, which records the geographical (X, Y and Z) coordinates, which are rotated into geomagnetic (H, D and Z) coordinates before analysis. The data are sampled at a rate of 20 s, 1 s and 10 s, respectively. These magnetometer arrays give exceptionally high quality data and they all have a good temporal resolution.
Observations and discussion
High-frequency radars
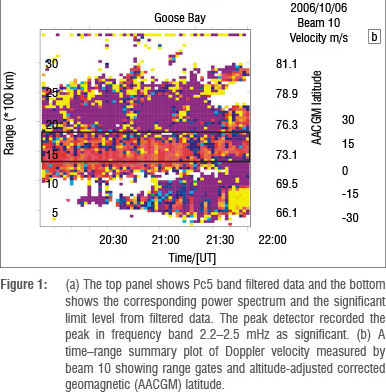
We analysed in detail a Pc5 pulsation event, which was observed between 20:00 and 22:00 UT on 6 October 2006. The investigation started by using an Automated Pulsation Finder program.25 The Automated Pulsation Finder highlighted a significant peak in beam 10 and range gate 32 of the Goose Bay radar. Groundscatter was not excluded from the analysis as it has been shown that pulsations may be visible in such scatter.26 Although the pulsation was initially detected in beam 10, we chose to analyse only those cells that were aligned along a specific magnetic latitude. Each record of data corresponding to a beam number and range gate to be processed by the Automated Pulsation Finder had an uneven sampling period, because of periods of no backscatter, and the original data record was not always suitable for pulsation analysis. The temporal resolution of the data used in the pulsation finder was 1 s. This higher time resolution had no impact on the frequencies of interest. The results of the Automated Pulsation Finder are shown in Figure 1a, which shows the line-of-sight Doppler velocity recorded at Goose Bay, filtered in the Pc5 band, and the corresponding power spectrum. The red line shows the level at which peaks in the spectrum are significant. The term 'significance detector' is used to describe a routine to process a set of data and then return those points that are either a significant part of a data group or not part of a group. The routine is as follows:

- Clean the data by removing outliers by removing echoes with a spectral width greater than 150 m/s; the remaining velocity values should fill more than 80% of the 2-h cell record.
- Interpolate the missing points using cubic spline interpolation.
- If there is a peak in the whole or part of the spectrum, calculate the mean and standard deviation of all the amplitude values within the 1-5 mHz frequency.
- Set the significance level at mean plus three standard deviations of the data. If any amplitude values in the 1-5-mHz range fall above the significance level, then the frequency that corresponds to the amplitude is considered significant.
In our data, the detector recorded a significant resonance in the frequency band 2.2-2.5 mHz in beam 10 in range 32. The range-time summary plot of the line-of-sight Doppler velocity of beam 10 of the Goose Bay radar is shown in Figure 1b. The velocity is indicated by the colour bar on the right of the figure. Blue indicates velocities moving toward the radar, while red corresponds to the velocities moving away from the radar. The range-time plot is a reliable source to check pulsation activities. The solid rectangle shows the location of pulsation activity in this beam. The ionospheric perturbations visible in the range-time plot as bands of alternating positive and negative (shades of blue and red) Doppler velocities are characteristic of Pc5 pulsations. Figure 2 shows the latitude profile of amplitude and phase along beam 10 of Goose Bay. This plot is derived from range gates 28 to 34, excluding range gate 30, from beam 10, using the analytic signal. The solid line represents the fitted curve, which shows the characteristics of field line resonances. The region of resonance is clearly visible as a narrow peak in amplitude around 73.7° magnetic latitude with a standard phase change with increasing latitude, i.e. a decrease in phase as the resonance is crossed. In the case of the other radars, we could not plot the latitude profile of amplitude and phase because there were not enough cells that were magnetically aligned or close to each other.
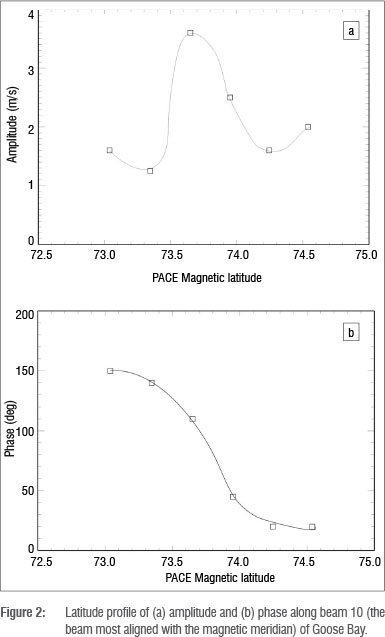
Figure 3 shows a map of the locations of the three SuperDARN radars -Saskatoon, Goose Bay and Pykkvibaer - and the magnetometer stations of the CARISMA, Greenland and IMAGE arrays. These radars have a good spatial resolution over a large range of magnetic latitude and longitude. Once we identified the Pc5 ULF pulsation event in one radar (Goose Bay), we then proceeded to analyse all the beams and range gates of the Saskatoon and Pykkvibaer radars which were located within the same range of magnetic latitudes (i.e. within the solid red lines). The beams are numbered from west to east in the field of view of the radar.
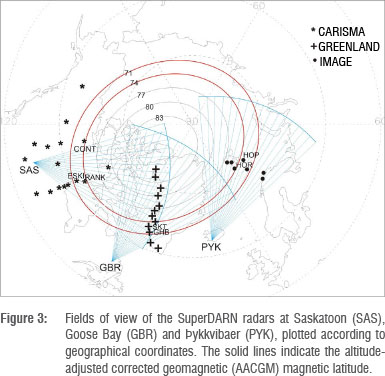
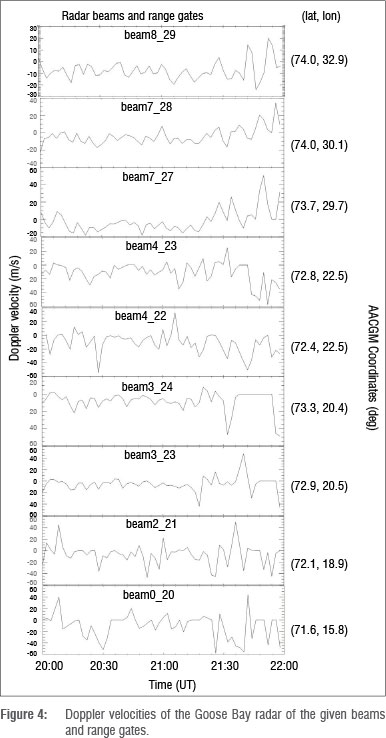
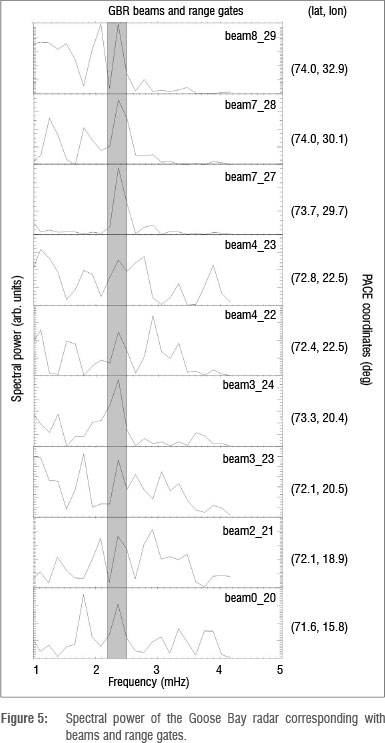
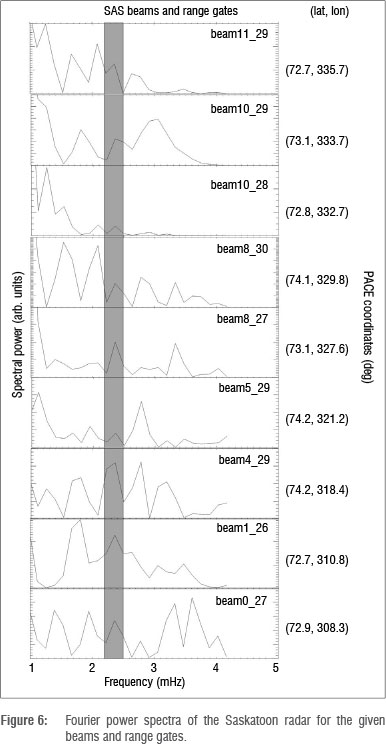
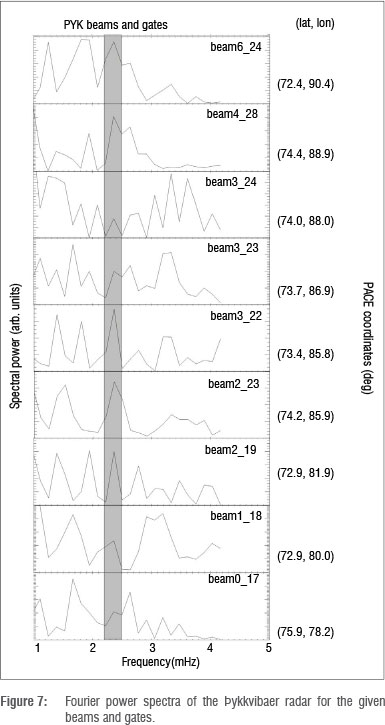
Figure 4 shows the time series of Doppler velocities for different beams and range gates at the magnetic latitudes of the Goose Bay radar that are of interest. The time series was analysed to obtain power spectra that are similar to the one observed using the Automated Pulsation Finder, as shown in Figure 5. The beam and range gate plots presented here are magnetic latitude aligned and showed peaks in the 2.2-2.5-mHz frequency band. The data used in these plots had a time resolution of 120 s, which limits the pulsation that can be observed to an upper frequency of 4.17 mHz. The investigation of the Pc5 pulsation event observed by the Automated Pulsation Finder was extended to other radars within the same magnetic latitudes. Velocity data from 20:00 to 22:00 UT from these two radars were passed through a Fourier analysis to obtain the power spectra. The results from Saskatoon and Pykkvibaer radars are shown in Figures 6 and 7, respectively. The shading highlights peaks in the 2.2-2.5-mHz frequency band. There is evidence of Pc5 ULF pulsation events in the frequency band 2.2-2.5 mHz observed by Saskatoon and Pykkvibaer radars in the beams and range gates plotted in these figures.
Magnetometers
Magnetometer stations that lie within the red lines shown in Figure 3 were chosen for more detailed analysis. The following magnetometer stations are located within or near the field of view of one of the three radars: Contwoyto (Saskatoon); Sukkertoppen/Maniitsok and Nuuk/ Godthaab (Goose Bay); and Hornsund (Þykkvibaer). The Contwoyto station is in the same magnetic latitude range as other stations but not in the field of view of the mentioned radars. Some other magnetometer stations within the field of view do not have data while others did not have a significant peak in the 2.2-2.5-mHz band. Those magnetometer stations were not included in the study. The shading highlights peaks in the 2.2-2.5-mHz frequency band, which confirms the Pc5 pulsation event observed by these SuperDARN radars, as shown in Figure 8. The event observed using the Automated Pulsation Finder appears in other radars and magnetometer chains as a field line resonance, with an H-component amplitude peak and associated phase change across the resonant magnetic latitude.
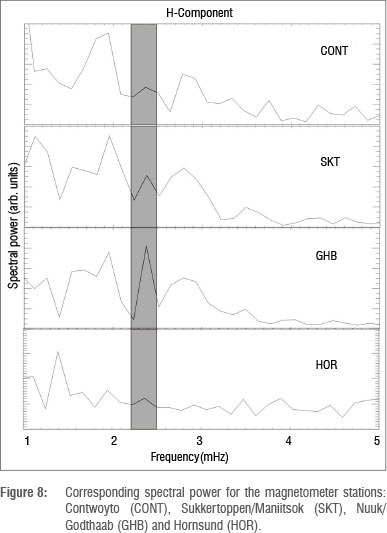
During this interval, the CARISMA, Greenland and IMAGE magnetometer networks were located in the magnetosphere in the evening and nightside sectors in local time: 16:00-18:00, 17:00-19:00 and 21:00-23:00, respectively. This allowed us to investigate the spatial behaviour of the wave. Field line resonances are toroidal mode waves with magnetospheric magnetic perturbations in the azimuthal direction. Because of the rotational effect of the ionosphere, the large ionospheric perturbations on the ground are observed in the magnetic H-component.27 Similarly, poloidal mode waves are characterised by magnetic perturbations in the radial direction which translates to a large perturbation observed in the magnetic D-component in ground magnetometer data. However, no ULF wave is purely Alfvén in nature; there will always be an accompanying compressional mode component. When identifying field line resonance signatures, one must take into account both the amplitude of the H- or D-component and the associated phase change. Figure 8 shows the corresponding spectral power for the four magnetometer stations selected from CARISMA (Contwoyto), Greenland (Sukkertoppen/Maniitsok and Nuuk/Godthaab) and IMAGE (Hornsund) for H-component only. The geographical and geomagnetic coordinates of these magnetometer stations are shown in Table 1. These magnetometer stations lie within a narrow magnetic latitude but cover an extensive range (nearly 180°) of longitude.
Complex demodulation
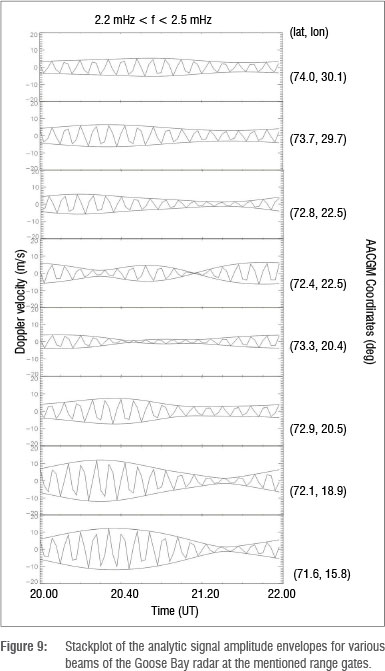
To analyse the instantaneous characteristics of the signal, we applied a complex demodulation technique to determine the analytic signal.28 This allowed the examination of the variation with time of the instantaneous amplitude and phase of a selected frequency band. In the analysis of the resonance frequency band 2.2-2.5 mHz, the analytic signal was calculated from different beams and range gates of the radars in which a given field line resonance was maximum, as shown in Figure 9 for Goose Bay. Similar analyses of Saskatoon and Þykkvibaer radars were performed, but are not shown here due to space constraints. The phase of the resonance was measured across the field of view at constant magnetic latitude, yielding the phase versus longitude relations shown in Figure 10. The slope of these relations yields the azimuthal wave number, m: 12±2.1 for Saskatoon, 13±2.9 for Goose Bay and 19±5.0 for Þykkvibaer. The m-value and the resonance frequency were used to calculate the azimuthal phase velocities. The m number changes as we cross magnetic longitude. The azimuthal phase velocity is given by

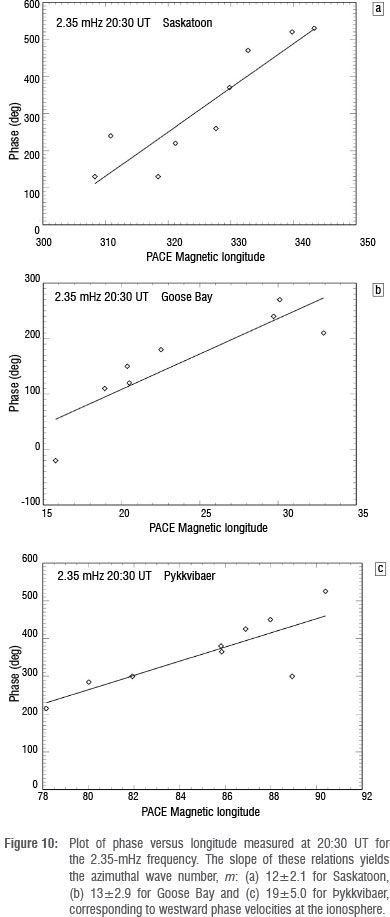
where f is the ULF wave frequency, λ is the geomagnetic latitude, R is earth's radius and m is the azimuthal wave number. These slopes correspond to westward phase velocities of ~2.2 km/s, ~2.0 km/s and ~1.4 km/s, respectively, at the ionosphere. This method was previously employed by Fenrich and Samson3. The filtered oscillation and its envelope and their phase for Sukkertoppen/Maniitsok and Nuuk/ Godthaab (part of the Greenland network which lies under the field of view of Goose Bay radar) are not shown here. The signals have a packet structure with amplitude growing and decaying with time. In some cases, the phase may change abruptly between packets where the amplitude is small. With magnetometer data, we use the phase difference to observe the azimuthal wave number m. The azimuthal wave number value is calculated using differences in the H-component phase. The values are given by

where Δø is the phase difference of the H-component between two stations and Δλ is their geomagnetic longitude difference. The coordinates for the relevant stations are provided in Table 1. Positive m-values represent waves with westward phase propagation while negative m-values represent waves with eastward phase propagation. An m-value of ~ + represents a wave with westward phase propagation.
The resonance frequency observed at Goose Bay radar using the Automated Pulsation Finder also appears in other radars, but not as the dominant peak; other beams and range gates in all three radars show significant peaks. The magnetometer stations that are within the field of view of the radars and those in the magnetic latitude of radars showed some peaks. These peaks show characteristic features of the field line resonances as resolved by the spatial resolution of radars, as it is shown in Figure 2. The region of resonance is clearly visible as a narrow peak in amplitude 73.7° magnetic latitude with standard phase change with increasing latitude. Once again, the m number increases from west to east as you cross the field of view; this finding is not surprising because a constant m-value would assume cylindrical symmetry. There is no reason to assume the wave would have this property. The observed azimuthal wave m from magnetometer stations is smaller than the azimuthal wave number observed from SuperDARN radars. The difference could be because when the ionospheric distribution of Hall currents also has a finite scale size in longitude, then azimuthal wave m numbers measured by ground-based magnetometers will be different compared with values in the ionosphere.29 The azimuthal wave number is calculated using the phase versus longitude relation.
Conclusions
The Pc5 pulsation event investigated was a field line resonance. Analysis of the Goose Bay radar beam most aligned with the magnetic meridian demonstrated an amplitude peak over a narrow latitude range and associated phase change across the resonance (Figure 2). Field line resonances tend to have lower azimuthal wave number (m) values and thus often have external sources. In addition, pulsations excited by external sources have phase velocities that are anti-sunward. However, in this instance, the field line resonance is sunward propagating with a relatively high azimuthal wave number. This may be more consistent with a drift resonance source, although a drift resonance generation mechanism is more commonly associated with a compressional oscillation. It has been shown that drift resonance can be associated with field line resonances in a study by Ozeke and Mann30 of the properties of high m Alfvén waves. This is an interesting finding that needs further investigation and is the subject of ongoing investigation.
Acknowledgements
This work at the University of KwaZulu-Natal was supported by a National Research Foundation (South Africa) grant for SANAE radar operation. We thank the South African National Space Agency for financial support; the National Space Institute at Denmark Technical University for providing Greenland Magnetometer data; and CARISMA and IMAGE magnetometer array teams for making data available on www.carisma.ca and http://space.fmi.fi/image, respectively.
Authors' contributions
Z.M. collected the data and performed the analyses; J.A.E.S. and A.D.M.W. formulated the idea and provided guidance and suggestions.
References
1. Samson JC, Harrold BG, Ruohoniemi JM, Greenwald RA, Walker ADM. Field line resonances associated with MHD waveguides in the magnetosphere. Geophys Res Lett. 1992;19:441-144. http://dx.doi.org/10.1029/92GL00116 [ Links ]
2. Ruohoniemi JM, Greenwald RA, Baker KB, Samson JC. HF radar observations of Pc 5 field line resonances in the midnight/early morning MLT sector. J Geophys Res. 1991;96:15697-15710. http://dx.doi.org/10.1029/91JA00795 [ Links ]
3. Fenrich FR, Samson JC. ULF high- and low-m field line resonances observed with the Super Dual Auroral Radar Network. J Geophys Res. 1995;100:21,535-21,547. http://dx.doi.org/10.1029/95JA02024 [ Links ]
4. Stephenson JAE, Walker ADM. HF radar observations of Pc5 ULF pulsations driven by the solar wind. Geophys Res Lett. 2002;29:11. http://dx.doi.org/10.1029/2001GL014291 [ Links ]
5. Walker ADM, Rouhoniemi RA, Baker KB, Greenwald RA, Samson JC. Spatial and temporal behaviour of ULF pulsations observed by the Goose Bay HF radar. J Geophys Res. 1992;92:12,187. http://dx.doi.org/10.1029/92JA00329 [ Links ]
6. Wright AN. Dispersion and wave coupling in inhomogeneous MHD waveguides. J Geophys Res. 1994;99:159. http://dx.doi.org/10.1029/93JA02206 [ Links ]
7. Ziesolleck CWS, McDiarmid DR. Statistical survey of auroral latitude Pc 5 spectral and polarization characteristics. J Geophys Res. 1995;100:19299-19312. http://dx.doi.org/10.1029/95JA00434 [ Links ]
8. Kivelson MG, Southwood DJ. Resonant ULF waves - A new interpretation. Geophys Res Lett. 1985;12:49-52. http://dx.doi.org/10.1029/GL012i001p00049 [ Links ]
9. Samson JC, Jacobs RA, Rostoker G. Latitude-dependent characteristics of long period geomagnetic micropulsations. J Geophys Res. 1971;76(16):3675. http://dx.doi.org/10.1029/JA076i016p03675 [ Links ]
10. Engebretson M, Glassmeier KH, Stellmacher M, Hughes WJ, Lühr H. The dependence of high-latitude Pc5 wave power on solar wind velocity and on the phase of high-speed solar streams. J Geophys Res. 1997;103:26,271. http://dx.doi.org/10.1029/97JA03143 [ Links ]
11. Walker ADM. Excitation of field line resonances by sources outside the magnetosphere. Ann Geophys. 2005;23:3373. http://dx.doi.org/10.5194/angeo-23-3375-2005 [ Links ]
12. Cummings WD. Standing Alfvén waves in the magnetosphere. J Geophys Res. 1969;74:778-793. http://dx.doi.org/10.1029/JA074i003p00778 [ Links ]
13. Walker ADM. Radar studies of magnetosphere dynamics. Astrophys Space Sci. 1995;230:415-430. http://dx.doi.org/10.1007/BF00658199 [ Links ]
14. Southwood DJ. Some features of field line resonances in the magnetosphere. Planet Space Sci. 1974;22:483-491. http://dx.doi.org/10.1016/0032-0633(74)90078-6 [ Links ]
15. Chen L, Hasegawa A. A theory of long-period magnetic pulsations, 1: Steady state excitation of field line resonance. J Geophys Res. 1974;79:1024-1032. http://dx.doi.org/10.1029/JA079i007p01024 [ Links ]
16. Walker ADM, Greenwald RA, Stuart WF, Green CA. STARE auroral radar observations of Pc5 geomagnetic pulsations. J Geophys Res. 1979;84:3373-3388. http://dx.doi.org/10.1029/JA084iA07p03373 [ Links ]
17. Southwood DJJ. A general approach to low-frequency instability in the ring current plasma. J Geophys Res. 1976;81:3340. http://dx.doi.org/10.1029/JA081i019p03340 [ Links ]
18. Chen L, Hasegawa A. On magnetospheric hydromagnetic waves excited by energetic ring current particles. J Geophys Res. 1988;93:8763. http://dx.doi.org/10.1029/JA093iA08p08763 [ Links ]
19. Southwood DJ, Dungey JW, Etherington RJ. Bounce resonant interaction between pulsations and trapped particles. Planet Space Sci. 1969;17:349-361. http://dx.doi.org/10.1016/0032-0633(69)90068-3 [ Links ]
20. Samson JC, Greenwald RA, Ruohoniemi JM, Hughes TJ, Wallis DD. Magnetometer and radar observations of magnetohydrodynamic cavity modes in the Earth's magnetosphere. Can J Phys. 1991;69:929-937. http://dx.doi.org/10.1139/p91-147 [ Links ]
21. Walker ADM, Ruohoniemi JM, Baker KB, Greenwald RA, Samson JC. Spatial and temporal behavior of ULF pulsations observed by the Goose Bay HF radar. J Geophys Res. 1992;97:12187-12202. http://dx.doi.org/10.1029/92JA00329 [ Links ]
22. Greenland magnetometer array [homepage on the Internet]. c1972 [cited 2013 Feb 08]. Available from: http://www.space.dtu.dk [ Links ]
23. ARISMA magnetometer array [homepage on the Internet]. c1986 [cited 2013 Mar 04]. Available from: www.cssdp.ca [ Links ]
24. IMAGE magnetometer array [homepage on the Internet]. c1991 [cited 2013 Mar 04]. Available from: http://space.fmi.fi/image [ Links ]
25. Magnus LG. An analysis of Pc5 pulsations observed in the SuperDARN radar data [PhD thesis]. Durban: University of KwaZulu-Natal; 2009. [ Links ]
26. Ponomareko PV, Menk FW, Waters CL. Visualization of ULF waves in SuperDARN data. J Geophys Res. 2003;30(18):1926. http://dx.doi.org/10.1029/2003GL017757 [ Links ]
27. Hughes WJ. Hydromagnetic waves in the magnetosphere. Rev Geophys. 1983;21:508-520. http://dx.doi.org/10.1029/RG021i002p00508 [ Links ]
28. Beamish D, Hanson HW, Webb DC. Complex demodulation applied to Pi2 geomagnetic pulsations. Geophys J Roy Astr S. 1979;58:471-493. http://dx.doi.org/10.1111/j.1365-246X.1979.tb01035.x [ Links ]
29. Ponomareko PV, Waters CL, Sciffer MD, Fraser BJ, Samson JC. Spatial structure of ULF waves: Comparison of magnetometer and Super Dual Auroral Radar Network data. J Geophys Res. 2001;106(A6):10509-10517. http://dx.doi.org/10.1029/2000JA000281 [ Links ]
30. Ozeke LG, Mann IR. Modelling the properties of high-m Alfvén waves driven by the drift-bounce resonance mechanism. J Geophys Res. 2001;106(A8):15583-15597. http://dx.doi.org/10.1029/2000JA000393 [ Links ]
 Correspondence:
Zolile Mtumela
School of Chemistry and
Physics, University of KwaZulu-
Natal, Private Bag X54001
Durban 4000
South Africa
Email: zolilemtumela@gmail.com
Received: 20 Dec. 2013
Revised: 02 July 2014
Accepted: 05 Aug. 2014

