


Serviços Personalizados
Artigo
 Inglês (pdf)
 Artigo em XML
 Referências do artigo
Indicadores

Links relacionados
-
 Citado por Google
 -
 Similares em Google
Compartilhar

 Permalink
South African Journal of Science
versão On-line ISSN 1996-7489
versão impressa ISSN 0038-2353
S. Afr. j. sci. vol.111 no.1-2 Pretoria Jan./Fev. 2015
http://dx.doi.org/10.17159/sajs.2015/20140044
RESEARCH ARTICLE
Assessing the quality of food served under a South African school feeding scheme: A nutritional analysis
Nthabiseng Nhlapo; Ryk J.F. Lues; Edmore Kativu; Willem H. Groenewald
School of Life Sciences, Central University of Technology Bloemfontein, South Africa
ABSTRACT
School feeding schemes have been implemented in various schools across the globe to improve the nutritional welfare of learners. The purpose of this study was to identify possible nutritional benefits or deficiencies of the foodstuffs served in the South African National School Nutrition Programme in the Free State Province (South Africa). Representative meal samples were collected from randomly selected schools and the nutrient content of meals was determined. The results were measured against nutrient-based standards for an average school lunch for individuals aged 7-10 and 11-18 years. The meals did not meet the nutrient standards for carbohydrate and energy contents for either age group. Protein standards were met by 90% of meals for individuals aged 7-10 years and by 40% for those aged 11-18 years. Only 10% of meals met the standards for calcium and zinc, while 80% and 30% met the iron standards for those aged 7-10 years and 11-18 years, respectively. The lipid and vitamin C contents were within standards. The implementation of proper storage and food preparation procedures may assist in preserving the quality of nutrients.
Keywords: National School Nutrition Programme; malnutrition; nutrients; chemical analysis; nutrient-based st
Introduction
Approximately one-third of young children globally experience stunted growth; causes of their growth failure may be traced to poverty.1 Malnutrition and hunger account for nearly half of the death rate of preschool children worldwide, with approximately 26% of undernourished children residing in Africa.2,3 An estimated one-fifth of the total population comprises those of school age. Approximately 25% of all children in developing countries are vitamin A deficient, whilst other nutrients most likely to be deficient in school-aged children are reportedly iron and iodine, with prevalence rates of the latter between 35% and 70%.3-7 Although data regarding the nutritional status of school-attending children in South Africa were not established during the current study, Iversen et al.5 report that undernutrition particularly affects young children residing in rural areas of the country. Furthermore, during a national food consumption and anthropometric survey among South African children, it was revealed that the Free State Province has a high prevalence of nutritional disorders.8
Nutrients are not only essential for growth and development, but also provide young children with fuel to perform physical and metabolic functions. Nutrition also influences the efficiency of educational programmes.9 Adequate nutrition is therefore vital during the school-age years because nutrition and health influence a child's cognitive development.3,10 Children lacking certain nutrients in their diet and who suffer from protein-energy malnutrition, persistent hunger, parasitic infections or other food-related diseases, are likely to have a reduced potential for learning compared with healthy, well-nourished children.8 Difficulty in concentrating and performing complex tasks in hungry learners can be attributed to poor or inadequate nutrition.10 Nutrient deficiencies account for the inability of a child to achieve their full mental and physical potential because of stunted growth, low physical work capacity, reduced IQ and a lower resistance to infection.4 In a report compiled by Usfar et al.1, a study conducted in rural villages of Guatemala indicated a more rapid growth in children who received supplementation (with a vegetable protein mixture) while children who did not take supplements were stunted and at risk of chronic infections even during adulthood.
Schools are uniquely positioned to promote healthy eating behaviours and attitudes among children, which may be the foundation for future dietary preferences and eating behaviour in their adult lives.11,12 Furthermore, school feeding schemes such as the National School Nutrition Programme (NSNP), a South African school feeding scheme, provide access to various nutritious foodstuffs that promote learners' health and their capacity to perform academic tasks.13 The NSNP was initiated in 1994 and, as an integral component of the Department of Basic Education (DBE), serves meals to schools located in communities with low socio-economic status nationwide in South Africa.14,15 The programme is funded through a provisional grant that is transferred to provinces according to the Division of Revenue Act and directives from the DBE and National Treasury (Grant Framework 2010/11).16 The provincial/district office and/or schools are allocated funds for the procurement of foodstuffs.17 Food items are then delivered to schools by private contractors and further prepared on the school premises.18 The NSNP aims to improve class attendance and participation among learners by alleviating short-term hunger.14 The UK government established food-based standards (to increase intake of healthier foods such as fruit, vegetables and oily fish) and nutrient-based standards (to promote an increased provision of foodstuffs containing essential nutrients) as guidelines for school lunches. The standards are aimed to address concerns regarding the poor quality of school meals and to improve the quality and nutritional balance of meals served to schoolchildren.19-21 In this study, we used chemical analyses to determine the nutrient contents of the meals served during the administration of the NSNP in Bloemfontein, South Africa. The study aimed to cast light on the possible nutritional benefits or deficiencies of the school meals.
Materials and methods
Sampling procedure
Representative food samples were collected from 10 randomly selected schools that were beneficiaries of the NSNP in Bloemfontein, South Africa. The school sample included primary, intermediate, combined and special schools, categorised under the three quintiles - Q1, Q2 and Q3. This sample also represented an even distribution of schools in the urban and rural areas of the region. The NSNP representative or school principal was notified prior to the visit and arrangements were made to collect food samples which were collected during serving times (between 10:30 and 12:00) during the summer season. This notification was necessary because schools were found to not always adhere to the serving time stipulated by the DBE as they operate differently in terms of the duration of classes and general attendance. The samples consisted of representative portions of food that were served to children under normal serving practices. In an attempt to collect a variety of food and obtain a wider perspective on the nutritional benefits of the meals, the samples were collected on specific days with guidance regarding menus provided by the schools. Schools used the menu provided by the DBE,13 which gave detailed descriptions of meals to be served each day, as a guideline.
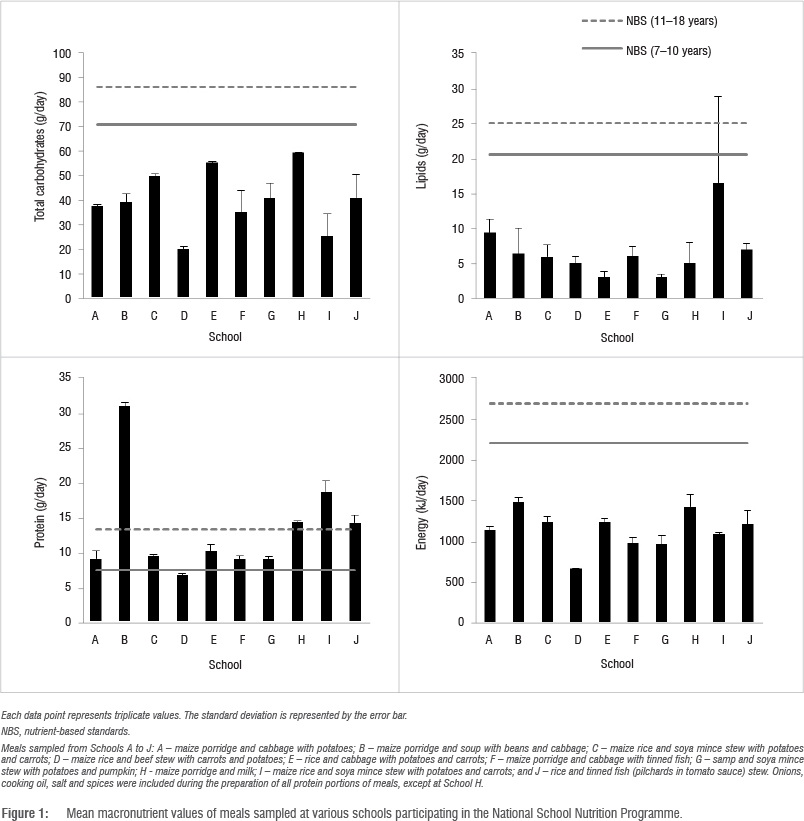
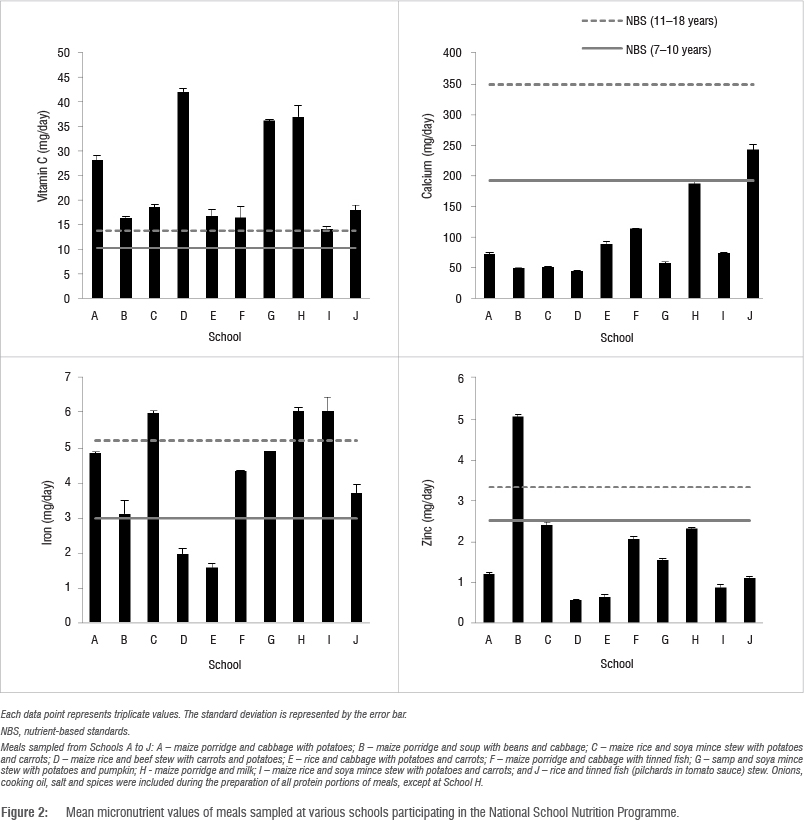
Meal samples of between 267 g and 477 g were collected using latex gloves and placed in sterile polythene bags. Schools were alphabetically coded to maintain confidentiality. Samples consisted of the following from each of the schools: A - maize porridge and cabbage with potatoes; B - maize porridge and soup with beans and cabbage; C -maize rice and soya mince stew with potatoes and carrots; D - maize rice and beef stew with carrots and potatoes; E - rice and cabbage with potatoes and carrots; F - maize porridge and cabbage with tinned fish; G - samp (a South African staple food made from broken, dried corn kernels) and soya mince stew with potatoes and pumpkin; H - maize porridge and milk; I - maize rice and soya mince stew with potatoes and carrots; and J - rice and tinned fish (pilchards in tomato sauce) stew. Onions, cooking oil, salt and spices were included during the preparation of all meals except for the meal served by school H. The food handlers followed recommendations of the DBE in preparing the meals with some modifications according to availability of ingredients.15 All meals had been prepared on the day they were sampled. The samples were transported to the laboratory on ice and homogenised upon arrival at the laboratory. Sampling and analyses were performed in triplicate.
Gravimetric determination of moisture content
Samples were dried in an oven at 105±5 °C for 24 h and the moisture content was expressed as the percentage of moisture in the fresh sample upon determining the difference in mass between the fresh sample and dry matter.22
Analysis of soluble sugars
High-performance liquid chromatography analysis
A high-performance liquid chromatography (HPLC) system consisting of a Shimadzu Prominence HPLC apparatus (Shimadzu Corporation, Nakagyo-ku, Kyoto, Japan) equipped with a pump (LC-20AD), a solvent degasser (DGU-20A3), an autosampler (SIL-20AC, 230V), a refractive index detector, a CBM-20A controller and an integrator running DataApex Clarity Chromatography software was used in the determination of soluble sugars. For separation, a Phenomenex Luna NH2 250x4.60 mm reverse-phase column (5 μm particle size) (Phenomenex, Torrance, CA, USA) was used with an oven temperature of 40 °C. An isocratic elution was employed with 75% acetonitrile (HPLC grade from Merck, Johannesburg, South Africa) in nanopure water at a flow rate of 1.25 mL/min and the injection volume was 10 μL. A carbohydrate kit (Sigma-Aldrich, Johannesburg, South Africa) was used to identify and quantify individual sugars by comparing the relative retention times of sample peaks with standards using calibration curves. The calibration was carried out using the external standard method and four sets of
calibration standards at concentrations of 0.4 g/L, 0.8 g/L, 1.8 g/L and 3.2 g/L were prepared for each reference sugar. The standard material was weighed, the appropriate volume of nanopure water was added and the mixture was vortexed for 30 s. The resultant solutions were filtered using syringe filters and analysed using HPLC.
Extraction of soluble sugars
The sugars were extracted from the various food samples using a modified method as proposed by Barreira et al.23. Approximately 10 g of the homogenised samples was extracted using 40 mL of 80% aqueous ethanol (Merck) at 70 °C for 30 min. After cooling to room temperature, the samples were centrifuged at 3000 rpm for 15 min. The ethanol in the supernatant was evaporated and the extract was diluted to a final volume of 10 mL in nanopure water, filtered at 0.45 μm and injected for HPLC analysis.
Total carbohydrate determination
Total carbohydrate content of food samples was determined by difference,24 that is: 100 g minus the sum of grams of water, protein, fat and ash.
Total lipid content and fatty acid analyses Quantification of total lipid content
With minor adaptation, the method proposed by Gressler25 was applied for the identification and quantification of lipids and fatty acids. To each homogenised food sample (5 g), 250 mg of pyrogalic acid (Sigma-Aldrich) (to minimise fatty acid degradation) and 5 mL of ethanol were added. For acid hydrolysis, 25 mL of 32% HCl (Merck) was added and the solution was shaken for 40 min at 70-80 °C, followed by vortexing for approximately 10 min. The lipids were extracted (at room temperature) with ethyl ether (60 mL mixed in vortex for 1 min) and petroleum ether (60 mL mixed in vortex for 1 min) (both were purchased from Merck). The samples were centrifuged (4000 rpm x 5 min) and the ether phase was evaporated to dryness under nitrogen gas. The residue was gravimetrically determined as total lipid content.
Identification of fatty acids
The fatty acids in the extracted lipid were methylated to fatty acid methyl esters (FAMEs) with boron trifluoride/methanol complex (5 mL of 20% BF3/MeOH reagent) (Merck) followed by heating in 2.5 mL toluene (Merck) at 100 °C for 45 min under gentle mix. At room temperature, nanopure water (12.5 mL) was added and the FAMEs were extracted with 5 mL hexane (Merck). The hexane fraction was dried in nitrogen gas, suspended in 500 μL hexane and the solution was filtered prior to analysis. The fatty acids were analysed using a Finnigan Focus gas chromatograph (Thermo Fisher Scientific, Waltham, MA, USA) with a flame ionisation detector and a 25 mm x 0.32 mm ID SGE capillary column BPX70 and 0.25-μm film (SGE, Melbourne, Victoria, Australia). The temperature conditions were 100 °C for 5 min, 100-240 °C (at a rate of 3 °C/min) and at 240 °C for 20 min. The samples were injected at 225 °C and detected at 285 °C with helium (linear flow of 200 mm/s) as the carrier gas and a split ratio of 1:50. A 37-Component FAME mixture (Sigma-Aldrich) was used to identify the fatty acids.
Protein content determination
The Dumas combustion method as described by Jung et al.26 was used to determine the nitrogen content of food samples. The protein content was determined by means of a nitrogen conversion factor of 6.25.
Analysis of vitamins A and E
High-performance liquid chromatography-ultraviolet conditions The HPLC system used for the analysis of vitamins was the same as that described earlier for carbohydrate analysis, with minor variations. For vitamin separation, a Phenomenex Luna C18 (2) 5-μm 150x4.60 mm reverse-phase column (Phenomenex) was used and the analyses were performed under isocratic mode (mobile phase of acetonitrile) at a flow rate of 2 mL/min with the oven temperature at 40 °C. The injection volume was 10 and a UV detector was set at 325 nm for vitamin A (retinyl acetate purchased from Sigma-Aldrich) and 290 nm for vitamin E (δ-tocopherol, α-tocopherol and α-tocopherol acetate purchased from Sigma-Aldrich) to monitor column effluents. The retention times, peak areas/heights and the spectra of the standard compounds were used for vitamin identification. For standard solutions, a stock solution of each vitamin was prepared by dissolving 3 mg of the vitamin standard in 100 mL ethanol containing 3 mg of antioxidant butylated hydroxytoluene (BHT) (Sigma-Aldrich) as a protection reagent.
Saponification and extraction of vitamins
With minor adaptations, the method proposed by Salo-Väänänen27 was applied to identify vitamin A and E contents of the homogenised samples. For saponification, samples of approximately 2 g were weighed into flasks after which 20 mL pyrogallol (15 g/L, dissolved in absolute ethanol, Sigma-Aldrich) and 10 mL KOH saponification solution (which consisted of 100 g of KOH pellets - purchased from NT Laboratory Suppliers Excom, Johannesburg, SA - dissolved in 100 mL of nanopure water) were added. Taka diastase (0.01 g) (Sigma-Aldrich) was added to digest starch and prevent formation of lumps. The flasks were heated at 60 °C for 30 min and cooled to room temperature for about 15 min. To avoid emulsion formation, 10 mL of 10% NaCl (Merck) was added.
After saponification, the vitamins were extracted using three portions of 20 mL n-hexane-petroleum ether (80:20) (n-hexane was obtained from Merck). With each portion, the flask was vortexed for about 30 s and centrifuged (4200 rpm χ 5 min). The phases were allowed to separate, and the organic layers were washed with 20 mL of 5% NaCl and evaporated. Then 5 mL ethanol and 5 mL n-hexane were added to the flask and the solution was evaporated to dryness with nitrogen gas. The residue was dissolved in 1 mL n-hexane (containing 5 mg of BHT) and filtered (Whatman, 0.45 μm) prior to HPLc analyses. Exposure to high temperature and bright light were eliminated throughout the process to prevent the loss of vitamins.
Vitamin C analysis
Total vitamin C content was determined according to AOAC Method 984.26 as proposed by Moses et al.28
Determination of total ash and mineral content
The total mineral content was determined by a dry ashing method during which the dried food samples were ashed at 525 °C overnight in a muffle furnace.29 The resultant ash was determined gravimetrically while individual minerals (calcium, iron and zinc) were identified and quantified using inductively coupled plasma-optical emission spectrometry (ICP-OES) as per the method proposed by Zhou et al.30.
Energy calculation
Energy was determined using the following formula as described by Charrondiere et al.24: energy (kJ) = (total carbohydrate grams χ17 kJ) + (protein grams χ17 kJ) + (lipids grams χ 37 kJ).
Analyses of data
The results of this study were analysed according to the United Kingdom's nutrient-based standards (NBS), which are derived from the Dietary Reference Values, for an average school lunch.19 The NBS were used as they articulated well with the units and best described assumptions used in this study. It was deemed necessary to compare schools that served the same meal in order to explore the possible impact of the preparation methods on the nutritional quality. The results were expressed as grams/ day and milligrams/day for macro- and micronutrients, respectively, and as kilojoules/day for energy. All descriptive and inferential statistical analyses were performed using SigmaPlot 10.0.1, Systat software. In the cases of determination of significance, the t-test was used with a significance level of 0.05. Means of triplicate values ± standard deviations and percentages are used to present the results.
Results and discussion
According to the menus received from the schools and the one which had been designed by the DBE, balanced and wholesome meals should alternately include a green and yellow vegetable along with the starch and protein portions. However, the only measurable vegetables served during sampling were cabbage (served by schools A, B, C, E and F) and pumpkin (served by schools G and J) (data not shown). In addition, the cabbage was served as a replacement for or in combination with the protein portion of the meals. To further supplement the nutrient intake, it was expected that a fruit would be provided to each child per week; however, it was observed that only one school adhered to this regulation during the course of this study.
Carbohydrates
The soluble sugars (glucose, fructose and sucrose) were quantified and the mono- and disaccharide contents are listed in Table 1. Low sugar contents were also reflected in the results of a study by Menezes et al.31, who found that the contents were below 0.5% of fresh weight for all foods and ranged between 3.07 mg/100 g and 38.42 mg/100 g for glucose, 3.77 mg/100 g and 55.90 mg/100 g for fructose and 9.39 mg/100 g and 368.27 mg/100 g for sucrose. These results were attributed to the high starch content of the foodstuffs. Carbohydrates (in the form of glucose) are the main source of energy in the human diet and consist of a diverse family of compounds, namely mono-, oligo- and polysaccharides.9 Further illustrated in Table 1 are the total carbohydrate contents of meals which ranged between 20.29±0.76 g/day and 59.41±0.10 g/day. These data were significantly (p<0.05) below the NBS minima of 70.6 g and 86.1 g for pupils aged 7-10 and 11-18 years, respectively (Figure 1). Similar results were observed from a study by Nicholas et al.32 in which school meals were below the standard (>86.1 g) required for carbohydrates at a content of 73.2±35.6 g. However, Pearce et al.33 found that school lunches yielded a carbohydrate content which was above the standard at 89.2±38.9 g.
Lipids and fatty acids
The values for the total lipid content (Table 1) were within the NBS of below 20.6 g and 25.1 g for individuals aged between 7-10 and 11-18 years, respectively, as illustrated in Figure 1. A study by Haroun et al.20 indicated that the majority of the school lunches also met the standard for total fat content. Lipids, particularly fats, are dense sources of energy and facilitate the absorption of fat-soluble dietary components such as vitamins. Lipids also aid in regulating blood pressure and nerve transmissions.34-37 While fat intakes should be kept minimal, intakes below 25% of total energy have been associated with low vitamin levels in young children.35 Lipid intake further depends on the composition of fatty acids and the health effects of various lipid components (saturated, unsaturated and trans-fatty acids).34 Table 2 lists the fatty acids identified in the various samples analysed in this study. It is apparent that saturated fatty acids were dominant in the majority of the meals. A high content of saturated fatty acids in school lunches was also observed in the study by Pearce et al.33 Saturated and monounsaturated fatty acids are synthesised by the human body and are thus not required in the diet, whereas polyunsaturated fatty acids, such as omega-3 and -6, are essential fats which should be obtained from the diet.35 School B's meal contained omega-3 (C18:3n3) fatty acids while meals from schools C, H and I contained omega-6 (C18:3n6) fatty acids. Meals which excluded foodstuffs of animal origin (schools D, E and G) were deficient of essential fats, whereas the meal from school F had the highest fatty acid composition and, along with that of school J, had both omega-3 and omega-6 essential fatty acids (Table 2). Schools F and J served tinned fish (pilchards) and it is a recognised fact that essential fats are abundant in fish oil.38 Prior et al.39 elaborate that these essential fats occupy one-third of the central nervous system while approximately 20% of the human brain consists of omega-3 fatty acids. This occupation of essential fatty acids in the brain was found to reduce attention deficit hyperactivity disorder symptoms in children during a study by Johnson et al.40
Protein
One meal (School D) did not contain the protein required in a school lunch (minimum of 7.5 g) for children aged 7-10 years. For pupils aged from 11 to 18 years, only four school meals (B, H, I and J) met the nutrient standard of a minimum of 13.3 g, whereas the remaining six schools were significantly (p<0.05) below the standard as indicated in Figure 1. School meals analysed for nutritional quality during the studies by Nicholas et al.32 and Pearce et al.33 met the standards for protein requirements. As indicated in Table 1 and Figure 1, the meal served by School B had noticeably higher protein content than those sampled from the other schools. This difference was because School B's meal was the only one that included meat (beef), which is a primary source of protein. Proteins mainly provide structure for the body and are major components of bone, muscle, blood, cell membranes, enzymes and immune factors.41 Additionally, proteins may be a source of energy; however, the body does not rely on protein for daily energy requirements.37 The quality of protein in food is dependent on the composition of amino acids, which bind together to form proteins such as in hormone formation.35,41 The human body is unable to synthesise the eight (or nine in the case of infants) essential amino acids - lysine, tryptophan, methionine, valine, phenylalanine, leucine, isoleucine, threonine and, for infants, histidine - and these should be obtained from the diet.36
Energy
The energy values indicated in Table 1 were significantly (p<0.05) below the minimum required values for an average school lunch (> 2215 kJ for individuals aged 7-10 years and >2700 kJ for those aged 11-18 years) as illustrated in Figure 1. According to the School Food Trust19, a minimum of 50% of energy from food should be obtained from carbohydrates, less than 35% should be from fats, and a portion (quantity not specified) should be supplied by proteins. Data obtained from the current study indicated that meals from the majority of the schools contributed the required amount of total carbohydrates to the energy values and did not exceed the standard for lipids. This finding is similar to those of a study by Charrondiere et al.24, regarding numerous food items from various countries, during which the total carbohydrate content supplied 50-80% of energy and 7-11% of energy was from protein. However, the meal from School B supplied approximately 47%, 17% and 37% of energy from carbohydrates, lipids and protein, respectively, and therefore relied on protein for energy, and the meal from School I contributed approximately 31%, 45% and 23% to the energy value from carbohydrates, lipids and protein, respectively (data not shown), indicating fats as the main source of energy. In an ideal diet, carbohydrates should be the main source of energy and the body should avoid reliance on protein for energy.37,42 Similar results of low energy provided by school meals were observed during a study by Nicholas et al.32; however, the meals generally met the standards for percentage of energy from carbohydrates and fats, but not from non-milk extrinsic sugars (sugars that are not contained within the cellular structure of food). Burgess and Bunker43 found that the energy values of school meals in their study were above the minimum standard, although none of the percentages of energy from carbohydrates, fats and non-milk extrinsic sugars were within the standards. Energy intake of children should be sufficient to ensure growth, and meals consumed by children should provide all the required nutrients without additional excessive energy sources to the diet.44
Vitamins A and E
The analysis for vitamins A and E in the present study yielded undetectable results for both vitamins. Depending on the cooking method and composition of food, variable losses of vitamins may occur as a result of processing and cooking conditions.45 Kuyper46 reported an average loss of 53% of vitamin A during the preparation of maize meal. The results obtained from a study by Pretorius and Schönfeldt47 indicated that fortification contributed to the improvement of the overall vitamin A status of children aged 1-9 years, whereas foodstuffs that were not fortified did not yield results. Vitamins enable numerous chemical reactions to occur in the body, which may aid with the release of energy from carbohydrates, lipids and proteins.37 The important roles that fat-soluble vitamins play in several functions of the human body include vision (vitamin A), calcium absorption (vitamin D) and antioxidative protection in cell membranes (vitamin E).48
Vitamin C
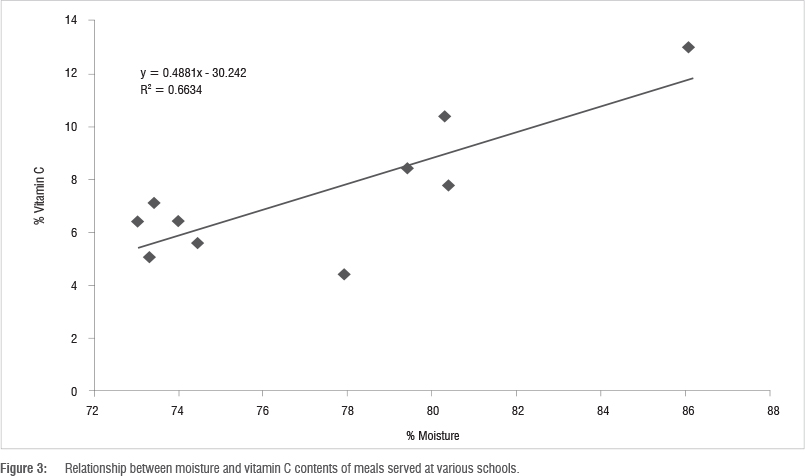
Vitamin C contents of meals are indicated in Table 3 and meals from all the schools met the requirements for pupils of all ages as stipulated for an average school lunch (Figure 2). Similar results were observed in the studies by Nicholas et al.32 and Pearce et al.33. Both groups of researchers reported that the vitamin C contents of the school meals they analysed met the required standards. A study by Fontannaz et al.49 revealed that soya-based food contained higher vitamin C levels than meat-based food. This trend was also observed in the meals analysed in the current study as the food provided by Schools D and G, which included soya mince, contained higher vitamin C levels than the meals of School B (which included beef) and School H (which included milk). Vitamin C is essential for growth and repair of tissues in the body.50 In addition, ascorbic acid acts as a cellular antioxidant and facilitates intestinal absorption of iron and maintenance of plasma iron.51 Interestingly, meals collected from Schools D and I were prepared using similar ingredients, but the meal from School I contained higher counts of all quantified nutrients, except for vitamin C. The t-test indicated that the meal from School D had a significantly higher (p<0.05) vitamin C content than that of School I. This finding may be because vitamin C is water soluble and School D's meal had a higher moisture content (86%) than that of School I (78%). Furthermore, a moderate positive correlation between moisture and vitamin C was observed (Figure 3).
Mineral content
As illustrated in Figure 2, only two school meals did not comply with the nutrient standard (>3.0 mg) for iron content, for pupils aged 7-10 years, while seven schools did not comply with the standard (>5.2 mg) for those aged 11-18 years. In addition, meals of Schools C, H and I had iron levels that were above the NBS for both age groups and the standard for the zinc content of school lunches was met by one meal (School B) for both age groups (Figure 2). Furthermore, for the 11-18 years age group, the calcium standard (>350 mg) was not met by any of the meals analysed while only one sample (School J) met the standard for individuals aged 7-10 years (>193 mg). Llorent-Martínez et al.52 observed significantly higher levels of minor nutritional elements (copper, iron and manganese) in soya products than in products of animal origin; however, the authors found that zinc levels were higher in foodstuffs of animal origin than of soya. A similar observation was made during the present study with the meal from School B containing the highest level of zinc (which may be attributed to the inclusion of beef) and lower levels of the other micronutrients. The results of the studies by Nicholas et al.32 and Pearce et al.33 indicated school meal values that were below standards for calcium, iron and zinc. A below standard calcium content and an above standard iron content were reported in the results of a study by Burgess and Bunker43. Iron is critical for the transportation and storage of oxygen in the body and children are at risk of developing iron deficiency anaemia should iron be deficient in their diet.42 Children require calcium for mineralisation and to maintain their growing bones. The primary sources of calcium are milk and dairy products,37 hence a calcium content above the NBS was expected from School H's meal (which consisted of milk). Zinc is essential for growth and healing of wounds in children, with the major sources of zinc being meat and seafood.
The effect of storage conditions and preparation methods on the different nutritional categories was notable in this study. According to Yuan et al.53, food preparation methods induce significant changes in the chemical composition of foodstuffs. In addition, the literature suggests that high temperatures used in cooking have an effect on the contents of nutrient and health-promoting food constituents such as vitamins.54,55 Yuan et al.53 reported that various cooking treatments caused major losses of total soluble proteins, soluble sugars and vitamin C in broccoli as a result of the application of heat for prolonged periods. The authors also identified the use of excessive liquid as reducing the nutritional content of foods via leaching of water-soluble components into the liquid. Components of the meals sampled in the present study were prepared using high volumes of liquid with the possible aim of supplementing the foodstuffs. However, this practice may compromise the nutrient content of food as water-soluble nutrients (such as vitamin C and soluble proteins and sugars) may be lost through leaching into the surrounding liquid medium.56 Further deterioration and loss of nutrients (particularly vitamins) may occur from excessive exposure of foodstuffs to UV light and oxygen, the pH of the solvent or combinations of various conditions.56,57 Moreover, a study by Vinha et al.58 revealed that in all the studied parameters, temperature and storage duration caused statistically significant differences in the nutritional values of each food sample analysed. Macronutrients are relatively stable under various storage conditions; however, the length of storage considerably affects the retention of micronutrients with high losses observed as a result of prolonged periods of storage.56,57 It is therefore essential that NSNP-benefitting schools adhere to the first-in-first-out principle for storage.
Conclusions
The small variety of ingredients in the meals served may be why the content of some nutrients are lower than the standards. In this regard, a study by Snelling and Yezek59 indicated that using nutrient standards to guide the selection of foods offered in schools may positively affect the intake of energy and nutrients. Therefore, to improve the macro- and micronutrient quantities of meals, NSNP-participating schools should serve meals that include a variety of whole grains, meat/meat alternatives, fruits, vegetables and dairy options.13 Food-handling methods, especially during storage and preparation, may also have a significant influence on the nutritional quality of foods. This influence was observed in the present study, in which there was a wide variation in nutrient levels in meals that contained similar components. Moreover, it may have been possible that vitamin C leached into surrounding media because meals with a high moisture content yielded higher values for this vitamin. It is further postulated that the undetected contents of vitamins A and E may be attributed to deterioration of these vitamins during handling of foodstuffs. Therefore, proper storage practices should be maintained to minimise loss of nutrients caused by exposing foodstuffs to surrounding elements and meals should be prepared in a manner that preserves the quality of nutrients.
Acknowledgements
The Central University of Technology (Free State) and the National Research Foundation (South Africa) are hereby gratefully acknowledged for research funding. The Department of Basic Education (Free State) is acknowledged for support and cooperation in providing information about the schools and allowing us access to the school premises.
Authors' contributions
This work formed part of N.N.'s master's degree. N.N. performed all of the experiments and wrote the manuscript. W.H.G. was the project supervisor and made conceptual contributions. R.J.F.L. made conceptual contributions and was responsible for the experimental and project design. E.K. assisted with the project design, made conceptual contributions and supervised the experimental analyses.
46. Kuyper L. Stability tests and sensory evaluation of fortified food vehicles for the national food fortification programme. Pretoria: Council for Scientific and Industrial Research; 2000.
References
1. Usfar AA, Achadi EL, Martorell R, Hadi H, Thaha R, Jus'at I, et al. Expert meeting on child growth and micronutrient deficiencies - New initiatives for developing countries to achieve millennium development goals: Executive summary report. Asia Pac J Clin Nutr. 2009;18(3):462-469. [ Links ]
2. World Hunger Education Service. 2012 World hunger and poverty facts and statistics [document on the Internet]. [ Links ] c2011 [cited 2013 Apr 28]. Available from: http://www.worldhunger.org/articles/Learn/world%20hunger%20facts%202002.htm#Number_of_hungry_people_in_the_world
3. Nnakwe NE. Community nutrition: Planning health promotion and disease prevention. 2nd ed. Burlington: Jones & Barlett Learning; 2013. [ Links ]
4. Mabaya E, Jordaan D, Malope P Monkhei M, Jackson J. Attribute preferences and willingness to pay for fortified cereal foods in Botswana. Agric Econ Res Policy Pract South Afr. 2010;49(4):459-483. [ Links ]
5. Iversen PO, Du Plessis L, Marais D, Morseth M, H0issther EA, Herselman M. Nutritional health of young children in South Africa over the first 16 years of democracy. S Afr J Child Health. 2011;5(3):72-77. [ Links ]
6. Singh SP, Babu DR. Nutritional status of primary school children in urban areas of Hyderabad, Andhra Pradesh, India. J Commun Nutr Health. 2013;2(1):36-43. [ Links ]
7. Bundy D, Shaeffer S, Jukes M, Beegle K, Gillespie A, Drake L, et al. School-based health and nutrition programs. In: Jamison DT, Breman JG, Measham AR, Alleyne G, Claeson M, Evans DB, et al., editors. Disease control priorities in developing countries. 2nd ed. Washington DC: World Bank; 2006. p. 1091-1108. [ Links ]
8. Labadarios D, Steyn NP Maunder E, MacIntryre U, Gericke G, Swart R, et al. The National Food Consumption Survey (NFCS): South Africa, 1999. Public Health Nutr. 2005;8(5):533-543. http://dx.doi.org/10.1079/PHN2005816 [ Links ]
9. Insel P, Ross D, McMahon K, Bernstein M. Discovering nutrition. 4th ed. Burlington: Jones & Bartlett Learning; 2013. [ Links ]
10. Kallman K. Food for thought: A review of the National School Nutrition Programme. Cape Town: University of Cape Town; 2005. [ Links ]
11. Perez-Rodrigo C, Aracenta J. School-based nutrition education: Lessons learned and new perspectives. Public Health Nutr. 2001;4(1A):131-139. http://dx.doi.org/10.1079/PHN2000108 [ Links ]
12. Weichselbaum E, Buttriss J. Nutrition, health and school children. Nutr Bull. 2011;36(3):295-355. http://dx.doi.org/10.1111/j.1467-3010.2011.01910.x [ Links ]
13. Bevans KB, Sanchez B, Teneralli R, Forrest CB. Children's eating behaviour: The importance of nutrition standards for foods in schools. J Sch Health. 2011;81(7):424-429. http://dx.doi.org/10.1111/j.1746-1561.2011.00611.x [ Links ]
14. Ntuli S. South Africa: 400 High schools on govt's nutrition programme [document on the Internet]. [ Links ] c2009 [cited 2013 Jan 07]. Available from: http://allafrica.com/stories/200904061262.html
15. Department of Basic Education (DBE), South Africa. Mnandi 4 sure: A recipe book for the National School Nutrition Programme [document on the Internet]. [ Links ] c2013 [cited 2013 Aug 08]. Available from: http://www.education.gov.za/LinkClick.aspx?fileticket=%2fBa%2fsZsQZvc%3d&tabid=440&mid=1911
16. Department of Basic Education (DBE), South Africa. National School Nutrition Programme: Annual report 2010/11. Pretoria: Government Printers; 2011. [ Links ]
17. Department of Education (DoE), South Africa. National School Nutrition Programme: A guide for secondary schools. Pretoria: Government Printers; 2009. [ Links ]
18. Noe MH. The influence of aerosolized microorganisms on the safety and quality of fortified biscuits [MTech dissertation]. [ Links ] Bloemfontein: Central University of Technology; 2005.
19. School Food Trust. A guide to introducing the government's food-based and nutrient-based standards for school lunches [document on the Internet]. [ Links ] c2008 [cited 2013 June 27]. Available from: http://www.salisbury.anglican.org/resources-library/schools/schools-every-child-matters/be-healthy-school-food-trust-guide-to-government-lunch-standards
20. Haroun D, Wood L, Harper C, Nelson M. Nutrient-based standards for school lunches complement food-based standards and improve pupils' nutrient intake profile. Br J Nutr. 2011;106(4):472-474. http://dx.doi.org/10.1017/S0007114511002297 [ Links ]
21. Department of Education, United Kingdom. Nutritional standards [document on the Internet]. [ Links ] c2012 [cited 2013 June 27]. Available from: http://www.deni.gov.uk/index/support-anddevelopment2/5schools_meals/nutritional-standards.htm
22. Moreno-Rojas R, Sánchez-Segarra PJ, Cámara-Martos F, Amaro-López MA. Multivariate analysis techniques as tools for categorization of southern Spanish cheeses: Nutritional composition and mineral content. Eur Food Res Technol. 2010;231(6):841-851. http://dx.doi.org/10.1007/s00217-010-1338-z [ Links ]
23. Barreira JCM, Pereira JA, Oliveira MBPP Ferreira ICFR. Sugar profiles of different chestnut (Castanea sativa Mill.) and almond (Prunus dulcis) cultivars by HPLC-RI. Plant Foods Hum Nutr. 2010;65(1):38-43. http://dx.doi.org/10.1007/s11130-009-0147-7 [ Links ]
24. Charrondiere UR, Chevassus-Agnes S, Marroni S, Burlingame B. Impact of different macronutrient definitions and energy conversion factors on energy supply estimations. J Food Compos Anal. 2004;17:339-360. http://dx.doi.org/10.1016/j.jfca.2004.03.011 [ Links ]
25. Gressler V, Yokoya NS, Fujii MT, Colepicolo P Filho JM, Torres RP et al. Lipid, fatty acid, protein, amino acid and ash contents in four Brazilian red algae species. Food Chem. 2010;120(2):585-590. http://dx.doi.org/10.1016/j.foodchem.2009.10.028 [ Links ]
26. Jung S, Rickert DA, Deak NA, Aldin ED, Recknor J, Johnson LA, et al. Comparison of Kjeldahl and Dumas methods for determining protein contents of soybean products. J Am Oil Chem Soc. 2003;80(12):1169-1173. http://dx.doi.org/10.1007/s11746-003-0837-3 [ Links ]
27. Salo-Väänänen P Ollilainen V, Mattila P Lehikoinen K, Salmela-Mölsä E, Piironen, V. Simultaneous HPLC analysis of fat-soluble vitamins in selected animal products after small-scale extraction. Food Chem. 2000;71(4):535-543. http://dx.doi.org/10.1016/S0308-8146(00)00155-2 [ Links ]
28. Moses SK, Whiting AV Muir DCG, Wang X, O'Hara TM. Organic nutrients and contaminants in subsistence species of Alaska: Concentrations and relationship to food preparation method. Int J Circumpolar Health. 2009;68(4):354-371. http://dx.doi.org/10.3402/ijch.v68i4.17368 [ Links ]
29. McCleary BV, DeVries JW, Rader JI, Cohen G, Prosky L, Mugford DC, et al. Determination of total dietary fiber (CODEX definition) by enzymatic-gravimetric method and liquid chromatography: Collaborative study. J AOAC Int. 2010;93(1):221-232. [ Links ]
30. Zhou J, Suo Z, Zhao P, Cheng N, Gao H, Zhao J, et al. Jujube honey from China: Physicochemical characteristics and mineral contents. J Food Sci. 2013;78(3):C387-C394. http://dx.doi.org/10.1111/1750-3841.12049 [ Links ]
31. Menezes EW, De Melo AT, Lima GH, Lajolo FM. Measurement of carbohydrate components and their impact on energy value of foods. J Food Compos Anal. 2004;17:331-338. http://dx.doi.org/10.1016/j.jfca.2004.03.018 [ Links ]
32. Nicholas J, Wood L, Harper C, Nelson M. The impact of the food-based and nutrient-based standards on lunchtime food and drink provision and consumption in secondary schools in England. Public Health Nutr. 2013;16(6):1052-1065. http://dx.doi.org/10.1017/S136898001300027X [ Links ]
33. Pearce J, Wood L, Nelson M. Lunchtime food and nutrient intakes of secondary-school pupils; a comparison of school lunches and packed lunches following the introduction of mandatory food-based standards for school lunch. Public Health Nutr. 2012;16(6):1126-1131. http://dx.doi.org/10.1017/S1368980012003928 [ Links ]
34. Gallagher ML. The nutrients and their metabolism. In: Escott-Stump S, Mahan LK, editors. Krause's food & nutrition therapy. 12th ed. St. Louis: Saunders Elsevier; 2008. p. 39-143. [ Links ]
35. European Food Safety Authority (EFSA). Scientific opinion on dietary reference values for fats, including saturated fatty acids, polyunsaturated fatty acids, monounsaturated fatty acids, trans fatty acids, and cholesterol. EFSA J. 2010;8(3):1461. [ Links ]
36. Medeiros DM, Wildman REC. Advanced human nutrition. 2nd ed. Sudbury: Jones & Bartlett Learning; 2012. [ Links ]
37. Byrd-Bredbenner C, Moe G, Beshgetoor D, Berning J. Wardlaw's perspectives in nutrition. 9th ed. New York: The McGraw-Hill Companies; 2013. [ Links ]
38. Chan EJ, Cho L. What can we expect from omega-3 fatty acids? Cleveland Clin J Med. 2009;76(4):245-251. http://dx.doi.org/10.3949/ccjm.76a.08042 [ Links ]
39. Prior PL, Galduróz JCF. (N-3) Fatty acids: Molecular role and clinical uses in psychiatric disorders. Adv Nutr. 2012;3(3):257-265. http://dx.doi.org/10.3945/an.111.001693 [ Links ]
40. Johnson M, Östlund S, Fransson G, Kadesjö B, Gillberg C. Omega-3/omega-6 fatty acids for attention deficit hyperactivity disorder: A randomized placebo-controlled trial in children and adolescents. J Atten Disord. 2009;12(5):394-401. http://dx.doi.org/10.1177/1087054708316261 [ Links ]
41. Hoffman JR, Falvo MJ. Protein - which is best? J Sports Sci Med. 2004;3:118-130. [ Links ]
42. Lucas BT, Feucht SA. Nutrition in childhood. In: Escott-Stump S, Mahan LK, editors. Krause's food & nutrition therapy. 12th ed. St. Louis: Saunders Elsevier; 2008. p. 222-243. [ Links ]
43. Burgess AL, Bunker VW. An investigation of school meals eaten by primary school children. Br Food J. 2002;104(9):705-712. http://dx.doi.org/10.1108/00070700210443084 [ Links ]
44. McGuire MK, Beerman KA. NUTR. Belmont: Cengage Learning; 2013. [ Links ]
45. Lešková E, Kubíová J, Kováčiková E, Košická M, Porubská J, Holčíová K. Vitamin losses: Retention during heat treatment and continual changes expressed by mathematical models. J Food Compos Anal. 2006;19(4):252-276. http://dx.doi.org/10.1016/j.jfca.2005.04.014 [ Links ]
47. Pretorius B, Schönfeldt HC. Vitamin A content of fortified maize meal and porridge as purchased and consumed in South Africa. Food Res Int. 2012;47(2):128-133. http://dx.doi.org/10.1016/j.foodres.2011.03.033 [ Links ]
48. Heudi O, Trisconi MJ, Blake CJ. Simultaneous quantification of vitamins A, D3 and E in fortified infant formulae by liquid chromatography-mass spectrometry. J Chromatogr A. 2004;1022(1-2):115-123. http://dx.doi.org/10.1016/j.chroma.2003.09.062 [ Links ]
49. Fontannaz P Kilinc T, Heudi O. HPLC-UV determination of total vitamin C in a wide range of fortified food products. Food Chem. 2006;94(4):626-631. http://dx.doi.org/10.1016/j.foodchem.2005.02.012 [ Links ]
50. Grindberg T, Williams K. Vitamin C quantification using reversed-phase ion-pairing HPLC. Concordia Coll J Anal Chem. 2010;1:19-23. [ Links ]
51. Tarrago-Trani MT, Phillips KM, Cotty M. Matrix-specific method validation for quantitative analysis of vitamin C in diverse foods. J Food Compos Anal. 2012;26(1-2):12-25. http://dx.doi.org/10.1016/j.jfca.2012.03.004 [ Links ]
52. Llorent-Martínez EJ, Fernández de Cordova ML, Ruiz-Medina A, Ortega-Barrales P Analysis of 20 trace and minor elements in soy and dairy yogurts by ICP-MS. Microchem J. 2012;102:23-27. http://dx.doi.org/10.1016/j.microc.2011.11.004 [ Links ]
53. Yuan G, Sun B, Yuan J, Wang Q. Effects of different cooking methods on health-promoting compounds of broccoli. J Zhejiang Univ Sci B. 2009;10(8):580-588. http://dx.doi.org/10.1631/jzus.B0920051 [ Links ]
54. Vallejo F, Tomas-Barberan FA, Garcia-Viguera C. Glucosinolates and vitamin C content in edible parts of broccoli florets after domestic cooking. Eur Food Res Technol. 2002;215(4):310-316. http://dx.doi.org/10.1007/s00217-002-0560-8 [ Links ]
55. Sikora E, Cieslik E, Leszczynska T, Filipiak-Florkiewicz A, Pisulewski PM. The antioxidant activity of selected cruciferous vegetables subjected to aquathermal processing. Food Chem. 2008;107(1):55-59. http://dx.doi.org/10.1016/j.foodchem.2007.07.023 [ Links ]
56. Rickman JC, Barrett DM, Bruhn CM. Nutritional comparison of fresh, frozen and canned fruits and vegetables. Part 1. Vitamins C and B and phenolic compounds. J Sci Food Agric. 2007;87:930-944. http://dx.doi.org/10.1002/jsfa.2825 [ Links ]
57. Severi S, Bedogni G, Manzieri AM, Poli M, Battistini N. Effects of cooking and storage methods on the micronutrient content of foods. Eur J Cancer Prev. 1997;6:521-524. http://dx.doi.org/10.1097/00008469-199703001-00005 [ Links ]
58. Vinha AF, Barreira SVP Castro A, Costa A, Oliveira MBPP. Influence of the storage conditions on the physicochemical properties, antioxidant activity and microbial flora of different tomato (Lycopersicon esculentum L.) cultivars. J Agric Sci. 2013;5(2):118-128. [ Links ]
59. Snelling AM, Yezek J. The effect of nutrient-based standards on competitive foods in 3 schools: Potential savings in kilocalories and grams of fat. J Sch Health. 2012;82(2):91-96. http://dx.doi.org/10.1111/j.1746-1561.2011.00671.x [ Links ]
 Correspondence:
Willem Groenewald
School of Life Sciences
Central University of Technology
Free State, Private Bag X20539
Bloemfontein 9300
South Africa
Email:wgroenewald@cut.ac.za
Received: 29 Jan. 2014
Revised: 04 June 2014
Accepted: 06 June 2014

