


Servicios Personalizados
Articulo
 Inglés (pdf)
 Articulo en XML
 Referencias del artículo
Indicadores

Links relacionados
-
 Citado por Google
 -
 Similares en Google
Compartir

 Permalink
South African Journal of Science
versión On-line ISSN 1996-7489
versión impresa ISSN 0038-2353
S. Afr. j. sci. vol.111 no.1-2 Pretoria ene./feb. 2015
http://dx.doi.org/10.17159/sajs.2015/20140001
RESEARCH ARTICLE
Recognition of materials and damage on historical buildings using digital image classification
José E. MeroñoI; Alberto J. PereaII; María J. AguileraII; Ana M. LagunaII
IDepartment of Graphics Engineering and Geomatics, University of Cordoba, Córdoba, Spain
IIDepartment of Applied Physics, University of Cordoba, Córdoba, Spain
ABSTRACT
Nowadays, techniques in digital image processing make it possible to detect damage, such as moisture or biological changes, on the surfaces of historical buildings. Digital classification techniques can be used to identify damages in construction materials in a non-destructive way. In this study, we evaluate the application of the object-oriented classification technique using photographs taken with a Fujifilm IS-Pro digital single lens reflex camera and the integration of the classified images in a three-dimensional model obtained through terrestrial laser scanning data in order to detect and locate damage affecting biocalcarenite stone employed in the construction of the Santa Marina Church (Córdoba, Spain). The Fujifilm IS-Pro camera captures spectral information in an extra-visible range, generating a wide spectral image with wavelengths ranging from ultraviolet to infrared. Techniques of object-oriented classification were applied, taking into account the shapes, textures, background information and spectral information in the image. This type of classification requires prior segmentation, defined as the search for homogeneous regions in an image. The second step is the classification process of these regions based on examples. The output data were classified according to the kind of damage that affects the biocalcarenite stone, reaching an overall classification accuracy of 92% and an excellent kappa statistic (85.7%). We have shown that multispectral classification with visible and near-infrared bands increased the degree of recognition among different damages. Post-analysis of these data integrated in a three-dimensional model allows us to obtain thematic maps with the size and position of the damage.
Keywords: digital classification; multispectral images; terrestrial laser scanner; diagnostic of cultural heritage; biocalcarenite stone
Introduction
We present a case study combining three-dimensional measuring techniques, such as terrestrial laser scanning, and advanced digital classification techniques using multispectral images to yield thematic maps with the size and positions of damage that affects the biocalcarenite stone of the Santa Marina de Aguas Church located in the city of Córdoba (Spain). We introduce the techniques used, review the benefits and drawbacks of spectral classification methods and discuss how object-oriented classification can improve the analysis of complex surfaces.
Throughout time, humans have built many unique landmark buildings of great historical, cultural and monetary value. But with time, the stone used to build them deteriorates as a result of natural processes, which are exacerbated and accelerated by conditions and circumstances attributable to human activity.1 Today there is notable concern regarding the need to conserve this heritage given its enormous value to humankind. Therefore, multidisciplinary studies are necessary to learn about the deterioration that affects the different materials from which monuments and historical buildings are composed.2,3
The documentation, preservation and restoration of historical buildings requires, first and foremost, knowledge of the state of their degradation before the appropriate reconstruction techniques can be applied to correct the problems detected.4 When determining the state of degradation of a unique building, samples must be taken from both the deteriorated area and another part of the building in good condition in order to compare the two degenerative states. It is precisely during sampling, traditionally performed using invasive techniques, that the most damage is caused to the building; hence, there is great interest in finding fast and economical non-invasive techniques to detect alterations in building materials.5
Scientists have long used multispectral images for building diagnosis, especially in cultural heritage tasks.6 Strackenbrock et al.7 and Godding et al.8 used multispectral image classification for the analysis of different stones and damage types in architectural applications. The effect of atmospheric phenomena such as rainfall, cloud temperature and cloud water content is determined using false-colour photographs, i.e. photographs with an observation range greater than the visible spectrum (normally the infrared spectrum). Recently, image interpretation has been applied to characterise the fagades of architectural buildings. The methodology of the spectral classification is based on the fact that those specific materials have wavelengths which are dependent on the reflection characteristics. By transferring the value of a pixel of an image into a feature space, a cluster for each object class is formed. Finally, classification techniques reduce the range of values of the image (digital number) to another level (classes) through a system of allocation statistics.9 Spectral classification methods can be differentiated into two groups: supervised and unsupervised classifications. Lerma10 studied the application of photogrammetry and remote sensing using cameras sensitive to the visible and infrared spectra, obtaining rectified images classified by automated methods and thus determining the structural elements and pathologies detected on the fagades of different buildings. In the aforementioned study, Lerma applied supervised multispectral classifications on multiband images, which were within the visible and infrared range.
However, in spectral classifications, problems arise when the pixels which comprise individual objects are spectrally heterogeneous and when identical spectral features have got different image texture.11 There have been several studies with statistical supervised pattern classification on different monument fagades under differing situations and external conditions. The overall accuracy of classification for mortars and paintings (among others) was 83.6%12; for limestones was 94.5%; for mortars was 90.8%13; and for mixed mortars, limestones, wood and glass was 90.1%14.
New possibilities are given by the application of the object-oriented analysis of images, which takes into account, inter alia, the shapes, textures, background information and spectral information in the image.15
Neusch and Grussenmeyer16 compared spectral classifications and the oriented-based classification in order to extract the elements comprising the half-timbered fagades. The best results were achieved using the oriented-based classification.
On the other hand, terrestrial laser scanning has been successfully applied in a number of different fields, such as architectural heritage, civil engineering, geology and documentation of heritage sites. It provides geometrical information used for the creation of realistic virtual three-dimensional models.17-21 One of the most important applications is the preservation and restoration of historical buildings.22-25
Our case study applies to the Santa Marina de Aguas Santas Church in Córdoba (Spain). This church is a historical building dating back to the 13th century and is of great cultural heritage value. The monitoring of its conservation state is thus necessary.
We proposed a new method to assess damage on the concrete surfaces of the church using multispectral images analysis. The main objectives of this study were:
- To evaluate the use of the object-oriented based classification using images taken with a single lens reflex camera recording non-visible light (ultraviolet and infrared), in order to detect damage affecting biocalcarenite stone employed in the construction of historical buildings, and other materials used in the restoration and its quantification.
- To integrate the results in a three-dimensional model obtained through terrestrial laser scanning data in order to yield thematic maps with the size and the position of damages that affect the biocalcarenite stone.
Experimental section
Study site
The study site was the Santa Marina Church, located in the city of Córdoba (Andalusia, Spain). The church is located in the city centre. The materials used in the construction of this building were Tortonian biocalcarenite with micritic carbonated cement (fine grain) and limestone fossils.26 Built in the 13th century, together with the Magdalena Church, Santa Marina de Aguas Santas is one of the oldest churches in Córdoba, and both buildings can be considered to be models for the other 'Fernandina' churches, built after Ferdinand's reconquest of the city.27 The Santa Marina Church was declared a Historic-Artistic Monument on 3 June 1931. It is exposed to a large number of air contaminants.
Equipment
The realistic virtual three-dimensional model of the monument was obtained using a Leica HDS 6600 laser scanner based on terrestrial LiDAR technology and manufactured by Leica Geosystems AG (St. Gallen, Switzerland). This equipment has a maximum instantaneous scan speed of 50 000 points/s. Data post-processing following the site survey was performed using Leica Cyclone 7.1 software.
The image analysis study to identify the construction materials and pathologies affecting these materials was performed using the Fujifilm IS-Pro digital single lens reflex camera (Fujifilm, Tokyo, Japan). This camera - designed for law enforcement, scientific, medical and fine art communities - was used in the study with a selection of filters for limiting the spectrum of certain wavelengths to the image. This 12.3-megapixel camera captured spectral information for the areas studied in an extra-visible range, generating a wide spectral image with wavelengths ranging from 300 nm (ultraviolet) to 1000 nm (near infrared). Thus, in addition to this camera, a specific visual target was used, an AF Nikkor 24mm f/2.8D (Nikon, Tokyo, Japan), with the characteristics required for coupling different filters, in order to screen the spectral information required.
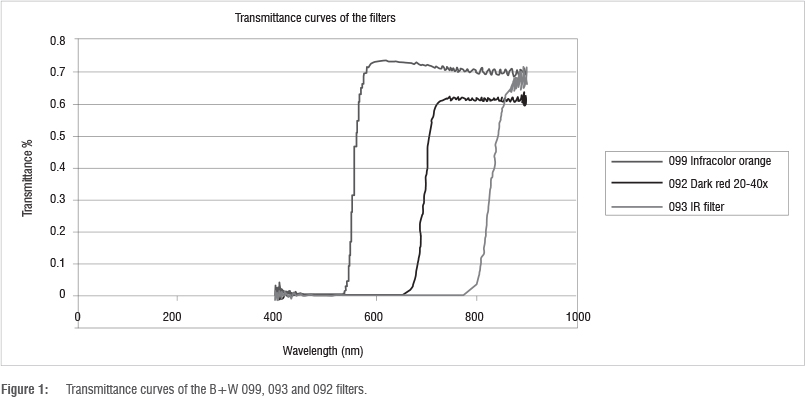
The choice of the filters to use in this study was based on previous results obtained by the working group.28 These filters, whose transmittance curves are shown in Figure 1, were characterised using a calibration sphere Li-Cor 1800-12.29 The filters were obtained from B+W (Berlin, Germany).
B+W 099 filter, infracolour orange
Figure 1 shows that the filter absorbs almost all light until a wavelength of approximately 550 nm and consequently filters all the spectral information corresponding to ultraviolet and the visible portion composed of blue and green. Part of red is also reflected; hence, the light passing through the filter will be formed by infrared and the orange area.
B+W 092 filter, dark red 20-40X
This filter has a transmittance curve characterised by an inflection point in the wavelength region of 690 nm. This curve indicates that the filter eliminates the ultraviolet response and practically the entire visible portion, except for dark red. As a result, the light beam will be characterised by an infrared and partly dark red spectrum.
B+W 093 filter, infrared
This filter eliminates ultraviolet and the entire visible portion as it screens the beam of light up to the area close to 830 nm, which is already in near infrared.
Data gathering and processing
Characterisation of materials and alterations in the stone
Figure 2 shows the four study areas selected for the characterisation of the materials and their alterations. These areas have important damage and they need to be restored. Four false colour photographs were taken of each area, using the camera with: (1) no filters, (2) a B+W 099 filter, (3) a B+W 092 filter and (4) a B+W 093 filter.
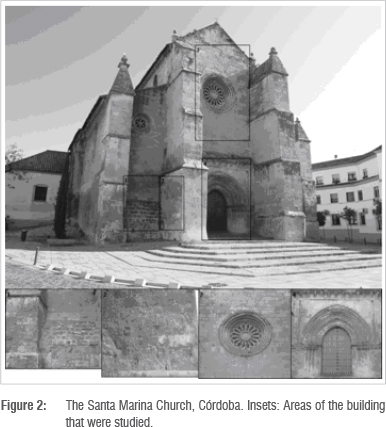
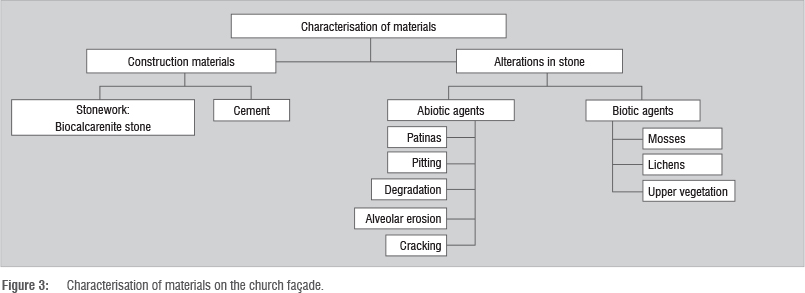
Image analysis techniques were applied to the captured images in order to obtain thematic information on the state of degradation of the building. These techniques require prior confirmation in situ regarding the existence of pathologies on the building's fagade. This information was taken from previous studies carried out on the church, in which the pathologies affecting the fagade were plotted using traditional techniques.26 In Figure 3, a diagram shows the characterisation of materials and alterations in the stone obtained in the aforementioned research.
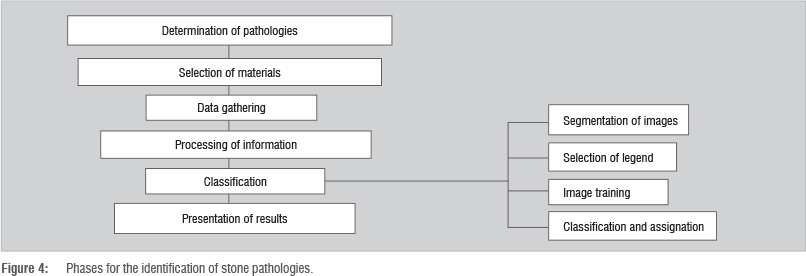
Figure 4 shows a diagram of the methodology followed in this study to identify the pathologies from the classification of hyperspectral images taken. The object-oriented classification technique applied is described below.
Object-oriented classification of images
Traditional remote sensing studies the level of response of each photographic pixel in the electromagnetic spectrum, completely ignoring the spatial structure of the image. In contrast, the new object-oriented classification technique takes into account shapes, textures and spectral information present in the image, among other aspects. Recent studies30-32 have demonstrated the superiority of the new concept with respect to traditional classifiers. Its basic principle is the use of information (shape, texture, contextual information, etc.), which is only present in significant objects in the image and in the relationships between them. The strategy is based on the spatial structure of images and consists of generating partitions of these images in which each region may be considered relatively homogeneous and different from the neighbouring regions. Each region corresponds to a segment, which, after classification, is added together with other neighbouring segments to form a larger region and thus to form an area with similar spectral characteristics. This process is called segmentation.
In short, the division of the images into a variety of objects is a key procedure for successfully analysing images or for their automatic interpretation. In this sense, image segmentation is a critical step for subsequent image analysis and even for understanding these images in the future.
Given the specific nature of the study, ENVI 4.7 software was selected. This software is used to process and analyse geospatial images.
The process consisted of an initial composition of the four photographs taken on the same wall. The multispectral digital camera gives three bands of information for each of these photographs (with and without a filter); however, some of these bands contribute little information. Thus, a *.vsk file was then created consisting of four overlapping pictures, each with three RGB bands.
The object-oriented classification was performed according to the steps below:
- Information segmentation stage
- Compute attributes
- Legend selection stage
- Training stage
- Classification or assignation stage
- Classification evaluation stage
Information segmentation stage
Segmentation is the process of partitioning an image into segments by grouping neighbouring pixels with similar feature values (brightness, texture, colour, etc.). These segments ideally correspond to real-world objects.33 Segmentation may be carried out using different procedures:
- Detection of grey levels: this consists of comparing the grey levels of the pixels and grouping them based on a gradient of variation in the grey level. When the grey-level variation gradient is substantially modified, it is stipulated as a boundary of the region.
- Edge detection: the composition of each pixel is studied and the images are grouped on that basis. When there is an abrupt change in the spectral response of the pixels, an edge is defined; thus, areas in which pixels have a similar spectral response are determined.
- Feature extraction: binarisation is performed based on thresholds of membership to textural and colour classes, whereby pixels with similar responses are gradually added.
- Multiresolution segmentation: this segmentation takes into account variability in both colour and shape, calculating a function of global variation. This parameter is compared with the homogeneity pre-established by the user, which will be the variability threshold for the formation of the object.
In this study, the segmentation method based on Feature Extraction was applied using ENVI zoom 4.7 software with Feature Extraction module. This system is based on the watershed by immersion algorithm. The watershed transform is based on the concept of hydrological watersheds. Basins fill up with water starting at the lowest points, and dams are built where water coming from different basins meets. When the water level has reached the highest peak in the landscape, the process stops. The landscape is thus divided into regions separated by dams, called watersheds.34
A similar process occurs in digital imagery. The darker a pixel, the lower its 'elevation'; this type of pixel is called a minimum. The Vincent and Soille watershed algorithm sorts pixels by increasing greyscale value, then begins with the minimum pixels and 'floods' the image, partitioning the image into basins (regions with similar pixel intensities) based on the computed watersheds. The result is a segmentation image, in which each region is assigned the mean spectral value of all the pixels that belong to that region.35
The Watershed algorithm requires the user to determine a series of parameters:
- Scale level (%): Determination of the level of homogeneity to be established when generating the different objects. During this step, the software starts image segmentation with the Feature Extraction module and requires a scale parameter. This parameter is a numerical value between 0 and 100 that controls the size and the complexity of the resulting segments. Values close to 0 produce fewer and bigger segments. In order to choose the right value, the software gives you the option of previewing the result.
- Merge (%): The next step is to merge the current segmentation for the determination of the restrictions when merging different objects with similar characteristics. This step eliminates errors produced during segmentation. The merge is also controlled by a numerical value between 0 and 100, where 0 means no merge at all and 100 means merge all.
- Thresholding: Union of adjacent groups, based on a comparison of pixel brightness.
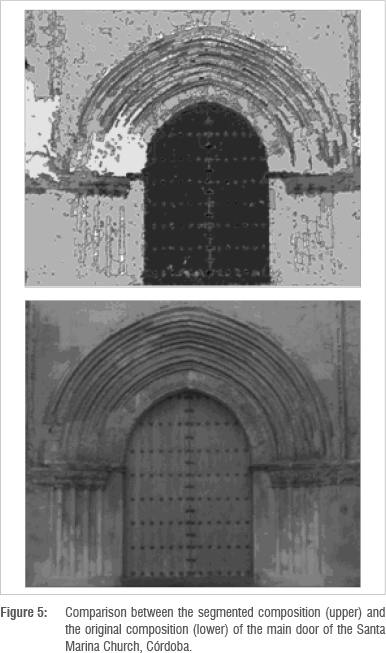
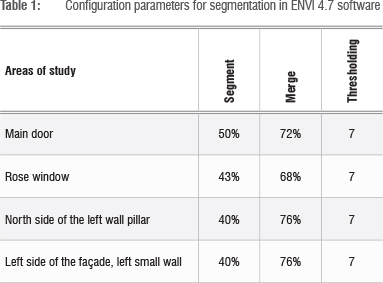
Image segmentation requires the performance of numerous tests to obtain a result that provides the best fit with reality. To obtain adequate results, various segmentation tests were carried out on each wall analysed using different configuration parameters until the appropriate segmentation was found. Figure 5 shows a good segmentation of the main door of the Santa Marina Church. The settings chosen for each wall are outlined in Table 1.
Compute attributes
In this step, attributes are computed for each segment. These attributes are:
- Spectral: minimum, maximum, mean and standard deviation for each channel
- Spatial: area, length and shape of the segment
- Textural: range, mean, variance and entropy of the segment
- Custom: band ratio, hue, saturation and intensity
Legend selection stage
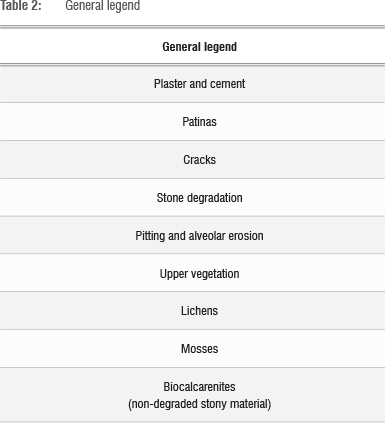
Based on the characterisation of materials and changes in the stone shown in Figure 3, the legend defining the classes to be automatically differentiated was obtained. The different uses of the legend are listed in Table 2.
Training stage
Training fields characteristic of each sample class were selected to correlate the statistical values of the spectral responses of the pixels corresponding to the selected object with the representative class to which it was assigned. Existing cartography of alterations was used to determine which areas were characteristic of each class type.26
Classification or assignation stage
The main goal of classification is to differentiate groups (informational classes) whose members have certain characteristics in common. The object-oriented classification is based on the fact that the semantic information, fundamental to interpreting an image, is not represented in pixels individually, but in representative objects of an image and their relationships. In this study, classifications were established using a class hierarchy procedure in which images are classified based on a list of available classes.
The k-nearest neighbour algorithm was used for the classification. The k-nearest neighbour classification method considers the Euclidean distance in n-dimensional space of the target to the elements in the training data, where n is defined by the number of object attributes used during classification. This method is generally more robust than a traditional nearest-neighbour classifier, as the k-nearest distances are used as a majority vote to determine to which class the target belongs. The k-nearest neighbour method is much less sensitive to outliers and noise in the data set and generally produces a more accurate classification result compared with traditional nearest-neighbour methods.30 This method also takes into account different parameters related to the objects (area, length, mean colour, brightness and texture).
Classification evaluation stage
For this classification, the overall accuracy, the kappa statistic and the producer's and user's accuracy were calculated. Kappa quantifies how superior a particular classification is in comparison to a random classification; the producer's accuracy is a measure of omission error and indicates the percentage of pixels of a given land-cover type that is correctly classified; and the user's accuracy is a measure of the commission error and indicates the probability that a pixel classified into a given class actually represents that class on the ground.15
Obtaining a realistic virtual three-dimensional model of the faqade
Scanning positions were selected according to technical specifications and by searching the front and the proximity of the studied area in order to minimise the influence of geometry during data acquisition, for example, by minimising hidden areas.
After obtaining the three-dimensional model from the points cloud, the following metric information on the fagade was extracted:
- CAD format plan
- orthophotographs
- virtual models of triangle meshes and solid surfaces.
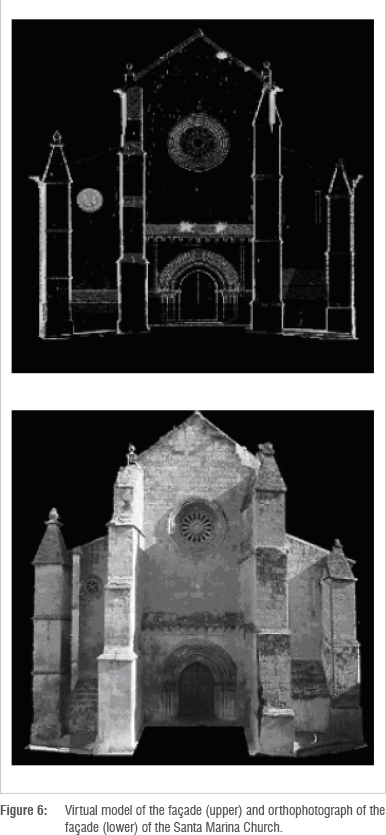
Figure 5 shows a virtual model of the principal fagade.
Figure 6 shows an orthophotograph of the fagade based on a real colour photograph. This photograph was a high-resolution orthophotograph (3735 x 2610 pixels) in which measurements and annotations could be made, showing the three-dimensional structure of the morphological details found on the fagade of the building.
Finally, a map was prepared which summarised the pathologies affecting the monument. The map was obtained by combining the metric information obtained in the LiDAR survey and the thematic information prepared.
Results and discussion
After segmentation of the composite images, the assignation of legends to each image and the next stage of training, the composites were classified.
As expected in an object-oriented classification, the images obtained consisted of groups of homogeneous segments, characterised by their smooth texture, which did not allow us to appreciate any morphological forms. This aspect forced us to use the original image to analyse the components in this area. After a thorough analysis of the fagade, the different pathologies in specific areas were observed.
The 'plaster and cement' class was present almost entirely in the lower parts of the church. This distribution was because of remediation work carried out on the outside of the church to restore degraded areas.
'Patinas' were located in areas in which, for morphological reasons, small deposits had gradually accumulated, forming a thin layer that gives original monuments a lighter colour.
The cracks that appear between the ashlar blocks are because the bonding material between the ashlar blocks is less resistant to degradation than the stone of the blocks used to build the church. Therefore, the entire monument shows cracking, the largest proportion of which was found in the most severely degraded areas.
Stone degradation, pitting and alveolar erosion are the most common pathologies on the outer surface of the building. Because these pathologies affecting the stone are caused by atmospheric weathering, degradation, pitting and alveolar erosion are more frequent in the areas in which wind and rain have a stronger impact. These areas are located on the northwest fagade and the left side of the main fagade.
With regard to the pathologies resulting from the presence of living organisms, a distinction must be made between mosses and lichens. At first glance they may look similar. However, closer examination of their distribution shows that lichens prefer higher parts of the building where oxygenation and radiation are more abundant, and where adjacent buildings do not inhibit ventilation or lighting of their habitat. In contrast, mosses prefer moist and shady areas, which explains why these bryophytes were located in the lower parts of the monument and preferred more humid north-facing parts of the building.
To conclude our findings on living organisms, upper vegetation usually is in areas with larger accumulations of sediment because they need more substrate for their roots to anchor and find support. The classification showed that upper vegetation was found on the edges of the roof, the small roof above the main door and the different projections on the outside of the building; there were no errors in the classification of this legend item.
A confusion matrix was prepared to evaluate the reliability of the classification made based on the compositions of images taken of the monument (Table 3). The confusion matrix was prepared from the manual analysis of 1000 sample regions distributed homogeneously on the four photographic compositions. The matrix was constructed by determining whether each sample region actually belonged to the category in which it had been classified, and if not, in which of the other categories it had been classified erroneously.
As can be seen, most of the regions studied (65%) were classified as stone material in good condition. Of these 650 samples, 610 were classified correctly and 40 belonged to the plaster and cement, patinas, degradation and bryophytes categories. The analysis of the samples classified as plaster and cement (10% of the total) revealed that 20% of the samples classified in this class belonged to the stonework and patinas categories. When evaluating the categories belonging to degradation by atmospheric agents (13% of the total areas studied), most belonged to the stone degradation category (6% of the sample regions classified in this category) and all had been classified correctly (100% user accuracy). When studying the biological agents, it was observed that overall these accounted for 6% of the regions studied and all were correctly classified, i.e. 100% reliable detection (producer accuracy).
Based on the data obtained in the confusion matrix, a statistical analysis was performed that yielded a total accuracy of 0.92 and a kappa statistic of 0.857. The total accuracy obtained showed that 92% of the regions generated had been classified correctly, with only 8% assigned to the wrong classes. The generation of a kappa statistic of 0.857 indicated that 85.7% of the errors that would have been committed with a random classification had been avoided. Considering a minimum kappa statistic value of 0.80 for the classification to be considered valid, it may be concluded that the classification obtained was acceptable.
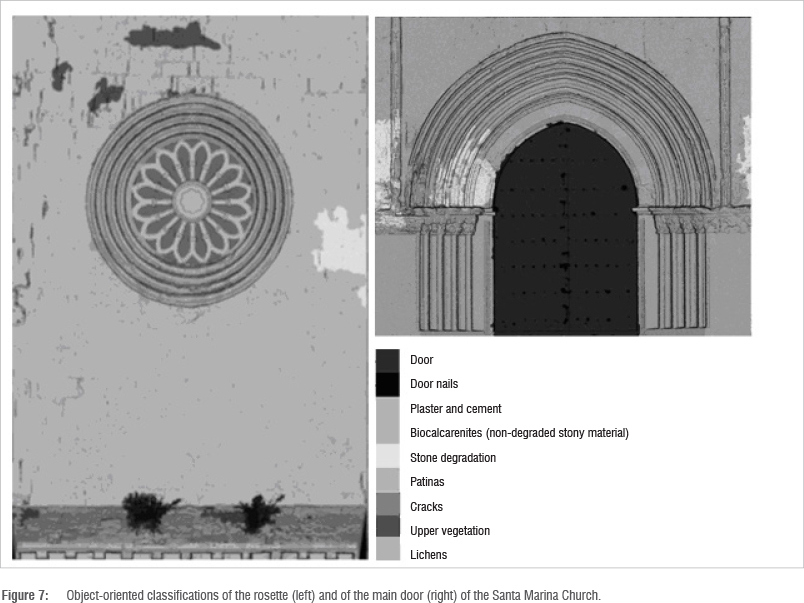
Finally, the corresponding orthophotographs were obtained based on the classified images and using the three-dimensional model of the fagade obtained with the terrestrial LiDAR. These orthophotographs already had metric characteristics in which measurements could be taken, allowing the exact position of the detected pathologies to be determined and the exact surface area affected by these pathologies to be quantified (Figure 7)
Conclusions
This study is a first approach to evaluate the applicability of the methodology to map and measure pathology on concrete surfaces. The evaluation of the proposed methodology for the detection of alterations in the construction material of unique buildings based on the application of advanced object-oriented classification techniques on multispectral images proved to be very successful, with a total accuracy of 92%.
Through the combination of these classified images and the virtual three-dimensional model obtained with terrestrial LiDAR technology, a thematic map of the areas studied was obtained with a level of detail and accuracy that no other technology can provide. Additionally, the combined use of both technologies is useful for appreciating the relief and physiognomy of the monument, thus making it easier to determine the parts of the church affected by each pathology. This system for detecting alterations can therefore be used to lower the costs off restoring unique buildings and provides accurate results for surface areas affected by the different types of damage detected.
Authors' contributions
J.E.M. was the project leader; A.J.P. was responsible for the experimental and project design and M.J.A. and A.M.L. performed some of the experiments.
References
1. Warscheid T, Braams J. Biodeterioration of a stone: A review. Int Biodeter Biodegr. 2000;6(4):343-368. http://dx.doi.org/10.1016/S0964-8305(00)00109-8 [ Links ]
2. Herrera LK, Borgne S, Videla H. Modern methods for materials characterization and surface analysis to study the effects of biodeterioration and weathering on buildings of cultural heritage. Int J Archit Herit. 2009;3:74-91. http://dx.doi.org/10.1080/15583050802149995 [ Links ]
3. Weritz F, Kruschwitz S, Maierhifer C, Wendrich A. Assessment of moisture and salt contents in brick masonry with microwave transmission, spectral induced polarization and laser induced breakdown spectroscopy. Int J Archit Herit. 2009;3:126-144. http://dx.doi.org/10.1080/15583050802278992 [ Links ]
4. Alcalde M, Villegas R, editors. Indicadores de alteración de los materiales pétreos. Metodología de diagnóstico y evaluación de tratamientos para la conservación de los edificios históricos [Alteration indicators of stone materials. [ Links ] Diagnosis methodology and evaluation of treatments for conserving historical buildings]. Málaga: Comares; 2003. Spanish.
5. Adriaens A. Non-destructive analysis and testing of museum objects: An overview of 5 years of research. Spectrochim Acta B. 2005;60:1503-1516. http://dx.doi.org/10.1016/j.sab.2005.10.006 [ Links ]
6. Cassar J, Degrigny C. The philosophy of the workshop. In: Adriaens A, Degrigny C, Cassar J, editors. Benefits of non-destructive analytical techniques for conservation. Luxembourg: Office for the Official Publications of the European Union; 2005. p. 9-12. [ Links ]
7. Strackenbrock B, Sacher G, Grunicke JM. Image processing for mapping damages to buildings. Paper presented at the XIII International CIPA symposium; 1990 Oct 23-26; Cracow, Poland. [ Links ]
8. Godding R, Sacher G, Siedler G. Einsatz von digitalen Aufnahmesystemen zur Gewinnung von Multispektralaufnahmen für die Erkundung von Bauwerksschäden [Use of digital recording systems for the production of multispectral images for the exploration of structural damage]. Int Arch Photogramm Remote Sens. 1992:V:794-798. German.
9. Tso B, Mather PM, editors. Classification methods for remotely sensed data. 2nd ed. London: Taylor and Francis; 2010. [ Links ]
10. Lerma JL. Multiband versus multispectral supervised classification of architectural images. Photogramm Rec. 2001;17:89-101. [ Links ]
11. Ryherd S, Woodcock C. Combining spectral and texture data in the segmentation of remotely sensed images. Photogramm Eng Remote Sens. 1996;62(2):181-194. [ Links ]
12. Herráez J, Navarro P Lerma JL. Integration of normal colour and colour infrared emulsions for the identification of pathologies in architectural heritage using a digital photogrammetric system. Int Arch Photogramm Remote Sens. 1997;32(5C1B):240-245. [ Links ]
13. Lerma JL, Herráez J. Reconocimiento y cartografiado automático de monumentos arquitectónicos [Recognition and automatic mapping of architectural monuments]. [ Links ] Paper presented at the XI International Congress on Graphics Engineering; 1999 June 3-5; Pamplona, Spain. Spanish. http://dx.doi.org/10.1111/0031-868X.00169
14. Lerma JL. Methodology of multispectral image classification for the recognition and characterisation of materials and damages on architectural fagades [PhD thesis]. Valencia: Universidad Politécnica de Valencia; 1999. [ Links ]
15. Perea AJ, Merofio JE, Aguilera MJ, De la Cruz JL. Land-cover classification with an expert classification algorithm using digital aerial photographs. S Afr J Sci. 2010;106(5/6):82-87. http://dx.doi.org/10.4102/sajs.v106i5/6.237 [ Links ]
16. Neusch T, Grussenmeyer P Remote sensing object-oriented image analysis applied to half-timbered houses. In: CIPA. New Perspectives to Save Cultural Heritage; 2003 Sep 30 - Oct 04; Antalya, Turkey. Antalya: CIPA; 2003. p. 298-301. [ Links ]
17. Armesto J, Ordófiez C, Alejano L, Arias P Terrestrial laser scanning used to determine the geometry of a granite boulder for stability analysis purposes. Geomorphology. 2009;106:271-277. http://dx.doi.org/10.1016/j.geomorph.2008.11.005 [ Links ]
18. Al-Kheder S, Al-Shawabkeh Y Haala N. Developing a documentation system for desert palaces in Jordan using 3D laser scanning and digital photogrammetry. J Archaeol Sci. 2009;36:537-546. http://dx.doi.org/10.1016/j.jas.2008.10.009 [ Links ]
19. Lamberts K, Eisenbeiss H, Sauerbier M, Kupferschmidt D, Gaisecker T Sotoodeh S, et al. Combining photogrammetry and laser scanning for the recording and modelling of the Late Intermediate Period site of Pinchango Alto, Papa, Peru. J Archaeol Sci. 2007;34:1702-1712. http://dx.doi.org/10.1016/j.jas.2006.12.008 [ Links ]
20. González-Aguilera D, Gómez-Lahoz J, Sánchez J. A new approach for structural monitoring of large dams with a three-dimensional laser scanner. Sensors-Basel. 2008;8:5866-5883. http://dx.doi.org/10.3390/s8095866 [ Links ]
21. Buckley SJ, Howell JA, Enge HD, Kurz TH. Terrestrial laser scanning in geology: Data acquisition, processing and accuracy considerations. J Geol Soc Lond. 2008;165:625-638. http://dx.doi.org/10.1144/0016-76492007-100 [ Links ]
22. Pavlidis G, Koutsoudis A, Arnaoutoglou F, Tsioukas V, Chamzas C. Methods for 3D digitization of cultural heritage. J Cult Herit. 2007;8:93-98. http://dx.doi.org/10.1016/j.culher.2006.10.007 [ Links ]
23. González-Aguilera D, Gómez-Lahoz J, Múfioz-Nieto A, Herrero-Pascual J. Monitoring the health of an emblematic monument from terrestrial laser scanner. Nondestruct Test Eva. 2008;23:301-315. http://dx.doi.org/10.1080/10589750802259000 [ Links ]
24. Balleni G, Bracci S, Pantani L, Tiano P Lidar remote sensing of stone cultural heritage: Detection of protective treatments. Opt Eng. 2001;40(8):1579-1583. http://dx.doi.org/10.1117/1.1385508 [ Links ]
25. Gonzalez-Jorge H, González-Aguilera P Rodríguez-Gonzalvez P Arias P Monitoring biological crusts in civil engineering structures using intensity data from terrestrial laser scanner. Constr Build Mater. 2012;31:119-128. http://dx.doi.org/10.1016/j.conbuildmat.2011.12.053 [ Links ]
26. Barrios J, Montealegre L, Ortega A, Merofio JE, Aguilera MJ. Biocalcarenites as construction materials in Santa Marina de Aguas Santas Church at Córdoba, Spain. Mater Construc. 2009;59(293):125-134. [ Links ]
27. Pérez M. Estudio histórico-artístico de la Iglesia Parroquial de Santa Marina de Aguas Santas de Córdoba [Historical and artistic research of Santa Marina de Aguas Santas Church in Có [ Links ]rdoba]. Córdoba: Publicaciones de la Universidad de Córdoba y Obra Social y Cultural Cajasur; 1998. Spanish.
28. Aguilera MJ, Merofio JE, Ortega A, Perea AJ, Barrios J. Application of near infrared reflectance spectroscopy (NIRS) technology in the characterization of construction materials in exceptional buildings: First results. In: Addison AC, De Luca L, Guidi G, Pescarin S, editors. Digital Heritage International Congress, 2013 Nov 01 - Oct 28; Marseille, France. Piscataway: IEEE; 2013. p. 515-520. [ Links ]
29. Zarco-Tejada PJ, Berjón A, López R, Miller JR, Martín P González MR. Assessing vineyards condition with hyperspectral indices: Leaf and canopy reflectance simulation in a row-structured discontinuous canopy. Remote Sens Environ. 2005;99:271-287. http://dx.doi.org/10.1016/j.rse.2005.09.002 [ Links ]
30. Mhangara P Odindi J. Potential of texture-based classification in urban landscapes using multispectral aerial photos. S Afr J Sci. 2013;109(3/4), Art. #1273, 8 pages. http://dx.doi.org/10.1590/sajs.2013/1273 [ Links ]
31. Pu R, Landry S, Yu Q. Object-based urban detailed land cover classification with high spatial resolution IKONOS imagery. Int J Remote Sens. 2011;32(12):3285-3308. http://dx.doi.org/10.1080/01431161003745657 [ Links ]
32. Ozdemir I, David A, Norton DA, Ozkan UY Mert A, Ozdemir S. Estimation of tree size diversity using object oriented texture analysis and ASTER Imagery. Sensors. 2008;8:4709-4724. http://dx.doi.org/10.3390/s8084709 [ Links ]
33. ENVI Feature Extraction Module user's guide. Technical report. Boulder, CO: ITT Visual Information Solutions; 2008. [ Links ]
34. Roerdink JBTM, Meijster A. The watershed transform: Definitions, algorithms, and parallelization strategies. Fundamenta Informaticae. 2001;41:187-228. [ Links ]
35. Exelis VIS. Segmentation algorithms background [homepage on the Internet]. [ Links ] No date [updated 2013 Dec 05; cited 2014 Mar 18]. Available from: http://www.exelisvis.com/docs/BackgroundSegmentationAlgorithm.html
 Correspondence:
Alberto J. Perea
Department of Applied Physics, University of Cordoba
Edificio Albert Einstein, Campus Rabanales, 14071 Spain
Email:g12pemoa@uco.es
Received: 02 Jan. 2014
Revised: 02 June 2014
Accepted: 22 June 2014

