


Servicios Personalizados
Articulo
 Inglés (pdf)
 Articulo en XML
 Referencias del artículo
Indicadores

Links relacionados
-
 Citado por Google
 -
 Similares en Google
Compartir

 Permalink
South African Journal of Science
versión On-line ISSN 1996-7489
versión impresa ISSN 0038-2353
S. Afr. j. sci. vol.111 no.1-2 Pretoria ene./feb. 2015
http://dx.doi.org/10.17159/sajs.2015/20140091
RESEARCH ARTICLE
Development of pesticide use maps for South Africa
James M. Dabrowski
Natural Resources and the Environment, Council for Scientific and Industrial Research, Pretoria, South Africa
ABSTRACT
Over 3000 pesticides are registered for use in South Africa. Many studies have highlighted the movement of pesticides to agricultural crops from the point of application into non-target environments, particularly surface and groundwater resources. Exposure to pesticides can lead to serious human health and environmental effects. It is therefore important to identify critical areas where specific pesticides may result in a high risk of exposure to humans or the environment. Crop specific pesticide use data were obtained from a market research company and integrated into a geographical information system detailing the distribution of agricultural crops in South Africa as determined by an agricultural census performed in 2002. By estimating the total application of a specific pesticide to all crops produced in a magisterial district, it was possible to generate maps which provide an estimate of the application rate of over 200 pesticides per magisterial district. These maps were intersected with an agricultural land-cover map to provide a refined map giving details of the spatial distribution of pesticide use across the country. These maps are the first of their kind in South Africa and provide a spatial overview of the likely distribution of specific active ingredients based on the distribution of crops throughout the country. While there are a number of limitations and uncertainties associated with the data used to produce these maps, these are not unique to South Africa, and similar methodologies have been applied in more developed countries.
Keywords: risk assessment; environment; human health; aquatic ecosystem
Introduction
According to the South African Department of Agriculture, Forestry and Fisheries (DAFF) there are in excess of 3000 pesticide products approved for use in South Africa.1 Pesticides are important to crop management because they contribute to increased crop yields and improve the quality of crops. However, pesticides tend to move from the point of application into non-target environments, which can result in serious acute and chronic human health and environmental effects. A number of studies, located throughout the country, have detected a variety of current-use pesticides in surface and groundwater.2-5 In South Africa, studies have linked pesticide exposure to acute poisoning6, acetylcholine esterase inhibition7, possible occurrence of Guillain-Barré syndrome in a rural farming community8, birth defects9 and endocrine disruption10,11 in human communities. Additionally, studies performed in South Africa have linked pesticide contamination with toxic effects in aquatic and terrestrial ecosystems.12-14 These effects are concerning from an environmental and human health point of view, particularly in the latter case, considering that many communities in South Africa use groundwater for drinking purposes or do not have access to, or reliable access to, treated water and often drink untreated water.
The risk a pesticide poses to human health or the environment is dependent on a number of factors, including the quantity of the pesticide applied, the toxic mode of action and the physico-chemical properties of the pesticide, such as half-life and solubility (which influence their mobility and thus the potential to move from the point of application into non-target environments).15-17 These factors vary considerably among pesticides. However, considering the number of different pesticides used in agriculture, it is important to identify and prioritise those most likely to be of human health and environmental concern. Yet, despite the risks posed by pesticides, to date, freely available public information on the quantities used in South Africa is unavailable and is generally the factor that limits our ability to prioritise, manage and predict environmental health risks posed by pesticides. As a result thereof, there are a limited number of studies that have prioritised pesticide risks to human and environmental health in South Africa. Dabrowski and Balderacchi18 prioritised pesticides in terms of their mobility and risk to the aquatic ecosystem in the Lourens River catchment, Western Cape. Their study relied on pesticide use data provided directly by farmers in the catchment. In larger, national-scale studies, pesticide sales data are often used as a proxy for pesticide use data. In South Africa, Dalvie et al.19 published information on national pesticide use for the years 1994 and 1999 which was used to prioritise acute health risks of pesticides. A more recent study has been published in which the relative human health risks of pesticides used in South Africa were prioritised based on factors such as quantity of usage, evidence of toxic effects (e.g. carcinogenicity, neurotoxicity, mutagenicity, teratogenicity and endocrine disruption) and their mobility in the environment.20
Prioritisation studies are an important initial step with respect to identifying those pesticides most likely to pose the greatest risk to human and environmental health. This step is particularly useful in a country where resources and expertise for pesticide monitoring are limited. The next step is to identify where these priority pesticides are applied. This identification is vital in terms of designing monitoring programmes and identifying hotspot areas (e.g. where access to treated water is limited or ecologically sensitive areas) for more detailed risk assessment studies. While the estimate of pesticides applied only provides an idea of where pesticides might be washed off into the environment, few practical alternatives for risk assessment exist. Measuring pesticides in water and sediments is possible but requires advanced analytical instruments, specialised personnel and sample collection in remote areas in different seasons and flow regimes. Furthermore, spatially explicit pesticide use information is essential for the development of environmental fate and transport models that relate pesticide use to concentrations in surface and groundwater.21 The aim of this study was to present a methodology that provides a spatial assessment of the use and likely sources of pesticides across the country through the development of pesticide use maps. This study forms part of a larger integrated project examining the risks to human and animal health of current agricultural pesticide use.22
Methods
Crop distribution
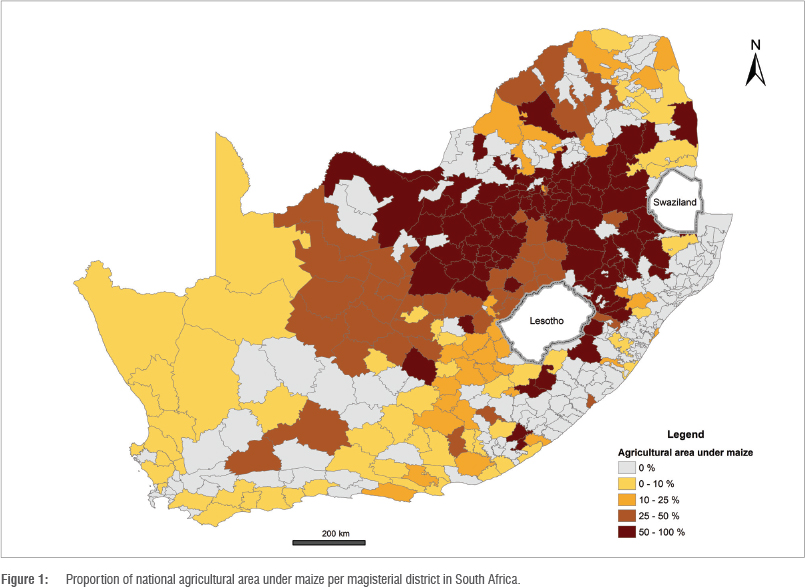
Knowledge on the spatial distribution of pesticide use is dependent on the spatial distribution of the crops to which they are applied. The Census of Agriculture Provincial Statistics performed by Statistics South Africa (Stats SA) in 200223 was used to estimate the spatial distribution of crop production in South Africa. The census collected data on crop area (ha) and production (tonnes) for commercial crops at a magisterial district level, which was used to estimate the percentage agricultural area covered by a specific crop type within a magisterial district. Each magisterial district falls within one of South Africa's nine provinces and summarised data of percentage crop area per province have been included as supplementary material online (Supplementary table 1). These data have allowed for the production of maps that provide a spatial overview of important production areas for specific crops (Figure 1). For the purposes of this study, the magisterial district boundaries as demarcated in 2002 were used for the spatial mapping of crop coverage and pesticide use. The census provides data only for farmers that responded. Consequently, the census underestimates total area and production at a magisterial district and national level, but does provide as accurate an estimate of the relative distribution of crop coverage and production as is possible at this level of spatial detail. The census data were therefore normalised to take this underestimation into account, as well as to account for changes in area and production over time, so as to provide an estimate of total crop coverage per magisterial district in 2009. The normalisation procedure compared total crop coverage estimated by the 2002 Stats SA census data (i.e. the sum of the area of each crop type for all nine provinces) with total crop area statistics collected by dAfF24 and the Food and Agriculture Organization of the United Nations
(FAO)25 for 2009. DAFF only publishes crop area for a limited number of crops, whereas the FAO publishes data for a larger number of crop types. Therefore DAFF data were compared to FAO data to determine whether the two sources of data corresponded. As can be seen from Table 1, the DAFF data were almost identical to those published by the FAO and so the FAO data set, with a greater crop representation, was considered reliable for the data normalisation procedure. The crop normalisation quotient was calculated as the ratio of FAO to Stats SA crop coverage. The crop coverage reported by Stats SA for each magisterial district in South Africa was multiplied by the respective crop normalisation quotient to derive a normalised crop coverage for each crop type in each magisterial district. The normalised area of each crop in each magisterial district was expressed as a percentage of the national crop area for the crop.
National pesticide use data
Pesticide use data for South Africa were obtained from the Sigma™ program, a proprietary database maintained by the market research company GfK Kynetec (this database is now referred to as the AgroTrak™ database). The company provides quantified data on the use of agricultural active ingredients (collected from, amongst other sources, agrochemical manufacturers, distributors, trade associations and importers) on a country-by-country and crop-by-crop basis. Data purchased from GfK Kynetec were for the year 2009 and were the latest data available at the time of the study. These data were used to prioritise pesticides at a national level for South Africa.20 The US Geological Survey has sufficient confidence in the data provided by GfK Kynetec to use the data for estimating pesticide use in the USA as part of their National Water Quality Assessment Programme.26
Pesticide use per magisterial district
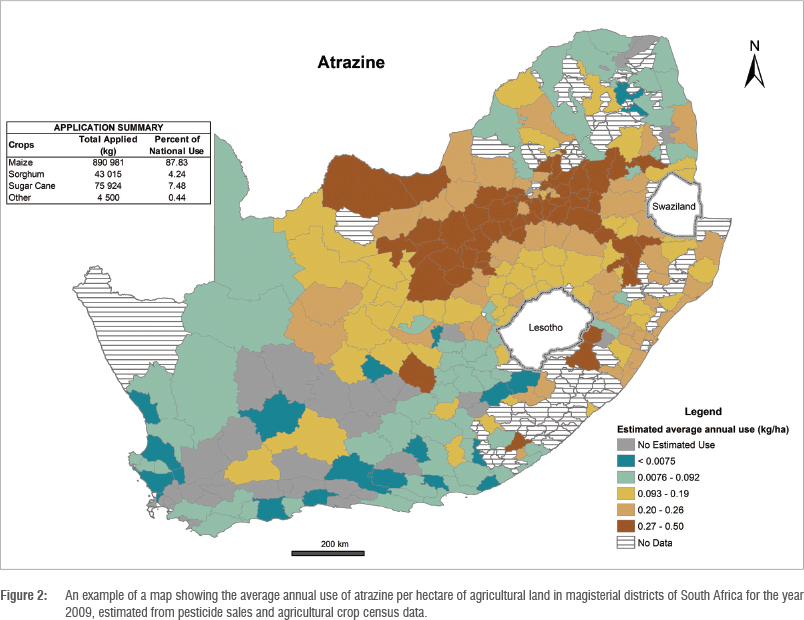
The amount of each pesticide applied to a crop was expressed as a percentage of the total national application. For example, approximately 88% of the total national use of atrazine is for maize (Table 2). These percentages were used to estimate the percentage of the total amount of each pesticide applied to each crop in each magisterial district (P%):
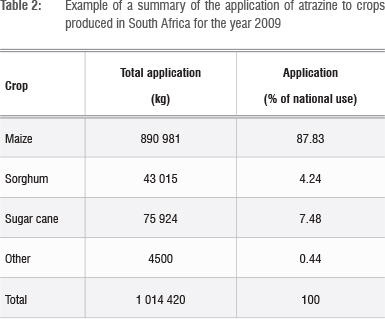

where Area is the proportion of crop type (y) in a magisterial district (z) expressed as a percentage of the total national coverage of the crop and CApp is the proportion of the pesticide (x) applied to the crop, expressed as a percentage of the total application of the pesticide. The assumption in this equation is that a specific pesticide was applied equally (or at an identical application rate) to a specific crop regardless of the magisterial district in which the crop was produced.
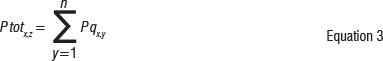
The total estimated quantity (Pq, in kg) of each applied pesticide (x) to each crop type (y) in each magisterial district (z) was calculated as follows:

where TApp is the total quantity of pesticide x applied to all crops in the country. From these data it was possible to estimate the total quantity (Ptot, in kg) of pesticide (x) applied within a magisterial district (z) regardless of crop type (y):
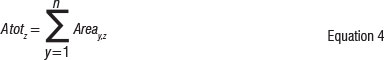
Summarised estimates of total pesticide application per province are available as supplementary material online (Supplementary table 2). In order to estimate the application rate of a pesticide per magisterial district it was first necessary to calculate the total area (Atot) of all crop types (y) within each magisterial district (z):
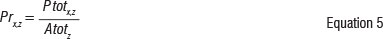
The pesticide application rate (Pr, in kg/ha) of each pesticide (x) in each magisterial district (z) was estimated by:
Map displays of pesticide use data
Estimation of the application rate of different pesticides within all magisterial districts in the country enabled the production of maps displaying the estimated distribution of applied pesticides as well as their estimated application rate. The derived pesticide use database, containing estimated pesticide application rates of 217 pesticides per magisterial district, was imported into ArcGIS (Esri) as a table and joined to corresponding magisterial districts in a shapefile demarcating their location as they appeared in 2002.27 This process produced a shapefile containing information on the estimated application of pesticides per unit area of all agricultural land per magisterial district and allowed for the production of maps providing a spatial estimation of pesticide use per magisterial district across the country (Figure 2).
Each map displays, in six intervals, the amount of active ingredient applied over a magisterial district. The first interval depicts areas where no application (No Estimated Use) is expected to occur. The other five class intervals were established independently for each of the compounds for which the magisterial districts had an associated pesticide application data point (greater than zero kilograms applied per hectare). Each of the five class intervals represents an equal number of data values from the distribution of the pesticide data, with upper boundaries representing the 20th, 40th, 60th, 80th and 100th percentiles, respectively. The Stats SA census did not provide agricultural statistics for some magisterial districts, particularly those that fall within the former homeland areas, so no pesticide use estimates could be calculated for these areas. For these areas, data were displayed as 'No Data' instead of displaying data as 'No Estimated Use'. As part of each map, a table lists, in order of use, the crop treated with the compound, the total amount (in kilograms) of the active ingredient applied to the crop, and the percentage of national use. Because the percentages are rounded, they do not always total 100%.
Display of the pesticide use information was improved by using additional data. The spatial distribution of agricultural land cover was extracted from the 2009 national land cover map.28 Using ArcGIS, the agricultural land cover was intersected with the shapefile displaying pesticide use per magisterial district so as to create an improved graphical display of the distribution of agricultural land within each magisterial district (Figure 3). These maps provide a more refined estimate of where in each magisterial district pesticides are most likely to be applied. The boundaries depicting 2004 water management areas and coverage of major rivers in South Africa were also added.29 The class intervals in Figure 2 are based on magisterial districts while those in Figure 3 are based on the number of agricultural land-cover polygons.
Application of maps
These pesticide maps are the first of their kind for South Africa and provide a spatial overview of the likely distribution of specific active ingredients based on their application to crops and the distribution of those crops throughout the country. While a number of geographical and physico-chemical factors influence the movement of pesticides into surface waters, the quantity and rate of application of pesticides used (and by implication the relative application rate) in an area is the most important indicator of the potential for contamination of non-target environments.30 In this respect, the maps provide important information, not only in terms of estimated application rates, but also in terms of identifying where in the country specific pesticides are most likely being applied. Integrating these data together with geographical data of slope, soil and climate in a GIS platform can significantly improve our ability to identify ground- and surface water resources at risk of pesticide exposure through leaching and run-off. Considering the large number of active ingredients used in South Africa, as well as the expense of monitoring these chemicals, the use of these maps in combination with existing information on the relative risks of pesticides to human health and the aquatic ecosystem18-20 provide guidance on which pesticides should be monitored and where they should be monitored. By combining the maps with information on community access to water, we can identify those communities that may be at risk of pesticide exposure through use of river or groundwater for drinking purposes. Additionally, use of the Blue Drop Report on Drinking Water Quality Performance Management31 could potentially be used to flag communities at risk of exposure through poor drinking water quality management. A similar approach could be adopted with respect to identifying potential pesticide risks to sensitive aquatic environments. For example, use of pesticide maps produced in this study in combination with maps of Freshwater Ecosystem Priority Areas32 could identify hotspot areas where specific pesticides may pose a risk to aquatic ecosystems with a high conservation status.
Constraints of spatial analysis
The pesticide maps are intended to provide a qualitative distribution of the likelihood of pesticide use in South Africa, directing more costly quantitative monitoring efforts to those regions where they will be most cost effective. Known uncertainties exist in the agricultural census and pesticide usage data, as discussed in more detail here.
Agricultural census data
The distribution of crops across the country formed a critical component of the final pesticide use estimation. These data were obtained from the Stats SA census performed in 2002. While the data provide a good estimate of the relative distribution of crops across magisterial districts in 2002, agricultural patterns may have changed since then and current pesticide use patterns may also have changed as a result. Additionally, as described in the normalisation procedure, not all farmers within a magisterial district may have responded to the census. As a result, total crop area estimates were underestimated in comparison to national estimates and data had to be normalised accordingly. This normalisation procedure applied a normalisation factor to each crop type equally across all magisterial districts and therefore increased the crop production area by an equal proportion across all magisterial districts. This procedure may have built inaccuracies into the estimates as the ratio of Stats SA estimates to FAO statistics may vary from one magisterial district to another.
The agricultural census did not collect crop production statistics from magisterial districts in former homeland areas. This omission is most likely because agriculture in these areas is largely restricted to subsistence agriculture and therefore is not important for the country's national food production. However, this does not mean that pesticides are not being applied in these areas. Given the subsistence nature of crop production and the relative expense of plant protection products, it is assumed that pesticide application in these areas is relatively low.
Pesticide use data
Currently there is no publicly accessible source of information on pesticide use in South Africa. Market-related sales data thus provide the best available indication of pesticide usage in the country. A major limitation of the data is that the use of different pesticides is aggregated and quantified at a national level. The data therefore do not necessarily reflect an accurate assessment of actual use or regional differences in the use of a chemical as a result of variations in climate (and associated pest problems) or farm-management practices. Furthermore, farmers may stock up on specific agro-chemical products in anticipation of forecasted weather events or pest outbreaks. These may not materialise and the product may therefore not actually be used. There is thus a large amount of uncertainty related to the use of these data and results or outputs should be interpreted accordingly. However, this type of surrogate data is often all that is available, even in more developed countries such as the USA and member states of the European Union.33-35
Methodology
The methodology assumes that the total quantity of pesticide applied to a specific crop is evenly distributed across the whole country. The estimates therefore do not take into account the local variability in pesticide application and management practices found within a magisterial district or across a regional landscape. As outlined in the Methods section, the relative quantity of a pesticide applied to a crop was expressed as the total application of the pesticide to a specific crop (kg) type per unit area of all agricultural land within a magisterial district. The main variable in differentiating pesticide use among magisterial districts is therefore the percentage composition of all agricultural land in a magisterial district covered by the specific crop to which the pesticide is applied.
Integration with land-cover maps
The agricultural land area displayed in the maps does not correspond with the area used in the estimation of the calculation of pesticide use statistics. The agricultural land cover is used to indicate where pesticide application is most likely and calculations of total pesticide use based on area calculations using the land-cover map will not necessarily correspond with those used in the calculation of pesticide use. The agricultural land-cover layer does not indicate the location of specific crops, so pesticide use was aggregated up to a magisterial district level and assumed to be distributed across all agricultural land within a magisterial district. All agricultural land cover that fell within a magisterial district was therefore assigned a pesticide use category for the pesticide in question. In reality, a section of agricultural land may not necessarily have an application of the pesticide if that specific land-cover area is not covered by a crop to which the pesticide is applied. The land-cover maps should therefore be used as a guide to indicate where agricultural land is located and the likelihood of application as represented by the application categories.
Conclusions
The pesticide use maps and supplementary data developed in this study provide the most detailed overview of pesticide use in South Africa produced to date. This information can be used to make national, provincial and catchment-based assessments of pesticide use which are essential for performing spatial assessments of human and environmental risk associated with pesticide use. Considering the large number of pesticides used in the country, the maps are particularly useful in identifying where specific pesticides are most likely to be applied, thereby prioritising those that are likely to be of greatest concern; the maps can therefore make useful contributions to the design of water quality monitoring programmes and interpretation of data. This activity is particularly important considering the high cost associated with the analysis of pesticides in environmental samples.
The maps display average annual pesticide use intensity expressed as average weight (kilograms) of a pesticide applied to each hectare of agricultural land in a magisterial district. Use estimates are based on (1) the spatial distribution of crops at a magisterial district level as reported by Stats SA in the Census of Agricultural Provincial Statistics (2002) and (2) national estimates of pesticide use rates for individual crops as compiled by the market research company GfK Kynetec. The area of mapped agricultural land for each magisterial district was obtained from the 2009 national land-cover map (NLC 2009) produced by the South African National Biodiversity Institute. The areas of uncertainty in these maps are:
1. The magisterial district coverage is based on the 2002 Census of Agricultural Provincial Statistics and did not represent all total coverage as accurate statistics were dependent on farmers that responded to the census. Data were therefore normalised to reflect actual crop coverage as reported by the FAO (i.e. the area of each crop type in a magisterial district was multiplied by the ratio of total national area reported by Stats SA to total national area reported by the FAO).
2. In the methodology, we assumed that a specific pesticide was evenly distributed to a specific crop regardless of the magisterial district in which the crop was produced. Pesticide use data as displayed in the maps may therefore not reflect the local variability of pesticide management practices found within a magisterial district.
3. Because the agricultural land cover does not discriminate between different crop types, pesticide use was aggregated up to a magisterial district level and assumed to be distributed across all agricultural land within a magisterial district. All agricultural land cover that fell within a magisterial district was therefore assigned a pesticide use category for the pesticide in question.
4. Crop production statistics may not have been available for all magisterial districts in which a pesticide may have been applied to agricultural land, and if so, are not displayed on the maps.
5. Pesticide use estimates are based on market research data for the year 2009.
6. Agricultural land cover used to display pesticide use rates is for the purpose of providing an indication of the spatial distribution of pesticide application and is not representative of actual agricultural land area used in the calculation of pesticide use rates.
Despite the limitations listed above, the data used in this study represent the best information currently available and therefore provide the best possible estimate of crop distribution and pesticide use in the country at present. Furthermore the limitations discussed here are not unique to South Africa. The uncertainty can be reduced by performing this type of assessment annually in order to obtain a range of pesticide use patterns and evaluate variation over time. Freely available, annual data on pesticide use are essential to meeting these objectives. Furthermore, the reliability of the maps could be improved through an updated census of crop production statistics in magisterial districts of South Africa.
Acknowledgements
This research originated from a project initiated, managed and funded by the Water Research Commission (WRC project No. K5/1956: Investigation of the contamination of water resources by agricultural chemicals and the impact on environmental health). Maps of pesticide use will be available through the Water Research Commission research report produced as part of this project.
References
1. South African Department of Agriculture, Fisheries and Forestry. Pesticide management policy for South Africa. Government Gazette no. 33899. Pretoria: Government Printing Works; 2010. [ Links ]
2. Ansara-Ross TM, Wepener V Van den Brink PJ, Ross MJ. Pesticides in South African fresh waters. Afr J Aquatic Sci. 2012;37(1):1-16. http://dx.doi.org/10.2989/16085914.2012.666336 [ Links ]
3. Dabrowski JM, Peall SKC, Reinecke AJ, Liess M, Schulz R. Runoff-related pesticide input into the Lourens River, South Africa: Basic data for exposure assessment and risk mitigation at the catchment scale. Water Air Soil Pollut. 2002;135:265-283. http://dx.doi.org/10.1023/A:1014705931212 [ Links ]
4. Sereda BL, Meinhardt HR. Contamination of the water environment in malaria endemic areas of KwaZulu-Natal, South Africa, by agricultural insecticides. Bull Environ Contam Toxicol. 2005;75(3):530-537. http://dx.doi.org/10.1007/s00128-005-0784-y [ Links ]
5. London L, Dalvie MA, Cairncross E, Solomons A. The quality of surface and groundwater in the rural Western Cape with regards to pesticides. WRC report no. 795/1/100. Pretoria: Water Research Commission; 2000. [ Links ]
6. Bennett R, Buthelezi TJ, Ismael Y Morse S. Bt cotton, pesticides labour and health: A case study of smallholder farmers in the Makhathini Flats, Republic of South Africa. Outlook Agric 2003;32(2):123-128. [ Links ]
7. Dalvie MA, London L. The impact of aerial application of organophosphates on the cholinesterase levels of rural residents in the Vaalharts district, Northern Cape Province, South Africa. Environ Res. 2006;102(3):326-332. http://dx.doi.org/10.1016/j.envres.2006.01.008 [ Links ]
8. London L, Bourne D, Sayed R, Eastman R. Guillain-Barre syndrome in a rural farming district in South Africa: A possible relationship to environmental organophosphate exposure. Arch Environ Health. 2004;59(11):575-580. http://dx.doi.org/10.1080/00039890409603436 [ Links ]
9. Heeren GA, Tyler J, Mandeya A. Agricultural chemical exposures and birth defects in the Eastern Cape Province, South Africa: A case-control study. Environ Health. 2003;2(1):1-8. http://dx.doi.org/10.1186/1476-069X-2-11 [ Links ]
10. Aneck-Hahn NH, Schulenburg GW, Bornman MS, Farias P De Jager C. Impaired semen quality associated with environmental DDT exposure in young men living in a malaria area in the Limpopo Province, South Africa. J Androl. 2007;28(3):423-434. http://dx.doi.org/10.2164/jandrol.106.001701 [ Links ]
11. English RG, Perry M, Lee MM, Hoffman E, Delport S, Dalvie MA. Farm residence and reproductive health among boys in rural South Africa. Environ Int. 2012;47C:73-79. [ Links ]
12. Bollmohr S, Schulz R. Seasonal changes of macroinvertebrate communities in a Western Cape river, South Africa, receiving nonpoint-source insecticide pollution. Environ Toxicol Chem. 2009;28:809-817. http://dx.doi.org/10.1897/08-228R.1 [ Links ]
13. Schulz R, Thiere G, Dabrowski JM. A combined microcosm and field approach to evaluate the aquatic toxicity of azinphos-methyl to stream communities. Environ Toxicol Chem. 2002;21:2172-2178. http://dx.doi.org/10.1002/etc.5620211021 [ Links ]
14. Schulz R. Using a freshwater amphipod in situ bioassay as a sensitive tool to detect pesticide effects in the field. Environ Toxicol Chem. 2003;22:1172-1176. http://dx.doi.org/10.1002/etc.5620220529 [ Links ]
15. Valcke M, Chaverri F, Monge P Bravo V Mergler D, Partanen T, et al. Pesticide prioritization for a case-control study on childhood leukemia in Costa Rica: A simple stepwise approach. Environ Res. 2005;97(3):335-347. [ Links ]
16. Gunier RB, Harnly ME, Reynolds P Hertz A, Von Behren J. Agricultural pesticide use in California: Pesticide prioritization, use densities, and population distributions for a childhood cancer study. Environ Health Perspect. 2001;109(10):1071-1078. http://dx.doi.org/10.1289/ehp.011091071 [ Links ]
17. Verro R, Calliera M, Maffioloi G, Auteri D, Sala S, Finizio A, et al. GIS-based system for surface water risk assessment of agricultural chemicals. 1. Methodological approach. Environ Sci Technol. 2002;36:1532-1538. http://dx.doi.org/10.1021/es010089o [ Links ]
18. Dabrowski JM, Balderacchi M. Development and field validation of an indicator to assess the relative mobility and risk of pesticides in the Lourens River catchment, South Africa. Chemosphere. 2013;93:2433-2443. http://dx.doi.org/10.1016/j.chemosphere.2013.08.070 [ Links ]
19. Dalvie MA, Africa A, London L. Change in the quantity and acute toxicity of pesticides sold in South African crop sectors, 1994-1999. Environ Int. 2009;35(4):683-687. http://dx.doi.org/10.1016/j.envint.2008.12.004 [ Links ]
20. Dabrowski JM, Shadung JM, Wepener V. Prioritizing agricultural pesticides used in South Africa based on their environmental mobility and potential human health effects. Environ Int. 2014;62:31-40. http://dx.doi.org/10.1016/j.envint.2013.10.001 [ Links ]
21. Dabrowski JM, Schulz R. Predicted and measured levels of azinphosmethyl in the Lourens River, South Africa: Comparison of runoff and spray drift. Environ Toxicol Chem. 2003;22(3):494-500. http://dx.doi.org/10.1002/etc.5620220305 [ Links ]
22. Water Research Commission (WRC). Knowledge review 2010/2011. Pretoria: WRC; 2011. [ Links ]
23. StatsSA. Census of Agriculture Provincial Statistics 2002. Financial and production statistics. Report no. 11-02-08. Pretoria: Statistics South Africa; 2002. [ Links ]
24. Department of Agriculture and Forestry (DAFF). Abstract of agricultural statistics 2010 [homepage on the Internet]. [ Links ] c2010 [cited 2012 Oct 20]. Available from: www.daff.gov.za
25. FAOSTAT. Crop production statistics [homepage on the Internet]. [ Links ] c2012. [cited 2012 Oct 20]. Available from: http://faostat.fao.org/site/567/default.aspx#ancor
26. Thelin GP, Stone WW. Estimation of annual agricultural pesticide use for counties of the conterminous United States, 1992-2009. Investigations report 2013-5009. Reston, VA: US Geological Survey Scientific; 2013. [ Links ]
27. Global Administrative Areas (GADM). GADM database of global administrative areas [homepage on the Internet]. [ Links ] c2012. [cited 2014 Feb 28]. Available from: www.gadm.org
28. SANBI. National land cover (NLC) 2009 [homepage on the Internet]. [ Links ] c2009 [cited 2014 Oct 20]. Available from: http://www.bgis.sanbi.org/landcover/project.asp
29. Middleton BJ, Bailey AK. Water resources of South Africa, 2005 study (WR2005). WRC report no. TT382/08. Pretoria: Water Research Commission; 2009. [ Links ]
30. Dabrowski JM, Peall SKC, Van Niekerk A, Reinecke AJ, Day JA, Schulz R. Predicting runoff-induced pesticide input in agricultural sub-catchment surface waters: Linking catchment variables and contamination. Water Res. 2002;36(20):4975-4984. http://dx.doi.org/10.1016/S0043-1354(02)00234-8 [ Links ]
31. Department of Water Affairs (DWA). 2012 Blue Drop report [homepage on the Internet]. [ Links ] c2012 [cited 2014 Mar 05]. Available from: http://www.dwa.gov.za/bluedrop
32. Nel JL, Strydom WF, Maherry A, Petersen C, Hill L, Roux DJ, et al. Atlas of Freshwater Ecosystem Priority Areas in South Africa: Maps to support sustainable development of water resources. WRC report no. TT 500/11. Pretoria: Water Research Commission; 2011. [ Links ]
33. Thomas MR. Guidelines for the collection of pesticide usage statistics within agriculture and horticulture. Paris: Organisation for Economic Cooperation and Development; 1999. [ Links ]
34. Thelin GP Gianessi LP. Method for estimating pesticide use for county areas of the conterminous United States. Open-file report 00-250. Reston, VA: US Geological Survey; 2000. [ Links ]
35. Grube A, Donaldson D, Kiely T, Wu L. Pesticides industry sales and usage: 2006 and 2007 market estimates. Washington DC: Environmental Protection Agency; 2011. [ Links ]
 Correspondence:
James Dabrowski
Natural Resources and the Environment
Council for Scientific and Industrial Research
PO Box 395, Pretoria 0001, South Africa
Email: jdabrowski@csir.co.za
Received: 12 Mar. 2014
Revised: 08 May 2014
Accepted: 12 May 2014

