


Services on Demand
Article
 English (pdf)
 Article in xml format
 Article references
Indicators

Related links
-
 Cited by Google
 -
 Similars in Google
Share

 Permalink
South African Journal of Science
On-line version ISSN 1996-7489
Print version ISSN 0038-2353
S. Afr. j. sci. vol.110 n.9-10 Pretoria Oct. 2014
http://dx.doi.org/10.1590/sajs.2014/20130133
RESEARCH ARTICLE
Advances towards the development of a cloud-resolving model in South Africa
Mary-Jane M. BopapeI, II; Francois A. EngelbrechtI, III; David A. RandallIV; Willem A. LandmanI, II
INatural Resources and the Environment, Council for Scientific and Industrial Research, Pretoria, South Africa
IIDepartment of Geography, Geoinformatics and Meteorology, University of Pretoria, Pretoria, South Africa
IIIDepartment of Geography, Archaeology and Environmental Sciences, University of the Witwatersrand, Johannesburg, South Africa
IVDepartment of Atmospheric Science, Colorado State University, Fort Collins, Colorado, USA
ABSTRACT
Recent advances in supercomputing have made feasible the numerical integration of high-resolution cloud-resolving models (CRMs). CRMs are being used increasingly for high-resolution operational numerical weather prediction and for research purposes. We report on the development of a new CRM in South Africa. Two bulk microphysics parameterisation schemes were introduced to a dynamical core of a two-dimensional Non-hydrostatic σ-coordinate Model (NSM) developed in South Africa. The resulting CRM was used to simulate two 12-day periods and an 8-day period observed during the Tropical Oceans Global Atmosphere Coupled Ocean-Atmosphere Response Experiment. The response of the NSM to the large-scale forcing which occurred over the three periods, and which included both suppressed and active convection, was examined. The NSM is shown to be able to capture the differences in the three experiments and responds correctly to the large-scale forcing (i.e. it is able to distinguish between suppressed and active regimes). However, the model simulations are cooler and drier than the observations. We demonstrate progress made in the development of a CRM in South Africa, which can be used to study the attributes of convective rainfall over the region.
Keywords: atmospheric modelling; thunderstorms; TOGA COARE; microphysics schemes.
Introduction
Non-hydrostatic atmospheric models have been used primarily for research purposes since the 1960s, as their application to operational weather forecasting and climate simulation was hindered by computational restrictions. Powerful computers with faster processing capabilities and enhanced memory are now making it possible for atmospheric models to be used operationally at resolutions at which the hydrostatic assumption is not applicable. These technological developments have led to an international trend to develop non-hydrostatic models. In South Africa, non-hydrostatic model development is taking place at the Council for Scientific and Industrial Research (CSIR) in collaboration with the University of Pretoria (UP)1-3 and at the University of Cape Town (UCT)4. Further model development, made possible by the availability of the Centre for High Performance Computing resources in South Africa, is on coupling atmospheric and oceanic components developed elsewhere on hydrostatic scales.5,6 Randall7 noted in his essay on a university's perspective on global climate modelling, that it is important that model development is undertaken by many research centres to accelerate the generation of new ideas.
Model development activities in South Africa were abandoned in the mid-1990s when policy changes at the institutions at which the development took place favoured the use of advanced models developed elsewhere. The South African Weather Service (SAWS) currently uses the United Kingdom's Meteorological Office Unified Model for short-range forecasting. The CSIR currently uses the Conformal Cubic Atmospheric Model developed in Australia. The US National Center for Atmospheric Research (NCAR) Weather Research and Forecasting (WRF) model is used at UCT, SAWS, UP and in the private sector. Engelbrecht et al.1,2 developed a dynamical core of the Non-hydrostatic σ-coordinate8 Model (NSM). The development of the NSM, which started in 2002 through funding from the Water Research Commission, revived numerical weather model development activities in South Africa.9 In this paper, we report on the further development of the NSM, through the introduction of moisture and microphysics schemes to the original adiabatic kernel to make the explicit simulation of clouds possible.
Non-hydrostatic models that include the necessary physics to simulate ensembles of clouds explicitly over a large enough domain are called cloud-resolving models (CRMs) or cumulus ensemble models.10 To be able to simulate clouds explicitly, CRMs employ microphysics parameterisations which are grouped into bin and bulk approaches. The majority of CRMs use bulk microphysics parameterisations (BMPs) to simulate clouds explicitly,11-13 because BMPs are computationally economic compared to bin approaches. BMP schemes specify a functional form for the particle distribution and usually predict the mixing ratios of as few as possible water substance classes. In a BMP scheme, the various cloud microphysical processes responsible for transferring the water substance from one species to another are parameterised. CRMs can also employ multi-moment BMP schemes by predicting more than one moment of the particle size distribution.14,15 A double moment scheme predicts both the particle mixing ratio and the concentration, while a single-moment scheme predicts only the particle mixing ratio. The benefit of multi-moment schemes is that they should be applicable across a wider range of environments. Multi-moment schemes are starting to be applied in numerical models13,14; however, their increased computational cost as a result of the prediction of a multiple-moment discourages their use in real-time numerical weather prediction.16
CRMs can be used to study the response of thunderstorms to large-scale circulations. To do so, CRMs are driven with large-scale observations similar to the procedure that is followed when testing cumulus parameterisation schemes with a single column model.10,17,18 This method constrains the domain-averaged horizontal velocities to follow the observed values and thereby provides a means for controlling the cloud system dynamics by the large-scale momentum and shear. Synoptic and mesoscale motions play a major role in the formation, maintenance and structure of thunderstorms. The tropical-temperate trough, which is associated with the northwest-southeast aligned cloud bands, is a major synoptic rainfall-producing weather system over southern Africa.19-21 In this paper, we introduce two microphysics schemes with the purpose of investigating the adequacy of these schemes for simulating the convective response to large-scale forcing, as well as the sensitive dependence of the simulated convective dynamics and precipitation to different microphysics schemes.
The use of observations from the experimental campaigns has contributed to the improvement of models and has also shown that CRMs are useful tools to study cloud systems.18,21,22 In this study, forcing data from the Tropical Oceans Global Atmosphere Coupled Ocean-Atmosphere Response Experiment (TOGA COARE) were used.23-25 The case study presented here was investigated by the Precipitating Cloud Systems Working Group of the Global Energy and Water Cycle Experiment Cloud System Study.24,26,27 The objective of this case study was to examine the role of the convective process in moistening the atmosphere during the suppressed phase of the Madden-Julian oscillation and to assess the impact of moistening on the subsequent evolution of convection in numerical simulations.23,24,27 In this study, the NSM with the newly added microphysics schemes will be used to simulate the suppressed and active periods of TOGA COARE in order to test the NSM's ability to respond to the large-scale forcing. We first describe the basic equations of the model and the two microphysics schemes.
Model, data and methods
The basic equations of the Non-hydrostatic σ-coordinate Model
Engelbrecht et al.1,2 derived the NSM equation set as the σ-coordinate equivalent to the pressure coordinate equations of White28. These equations have been modified to reflect the introduction of moisture and microphysics processes. σ is defined based on the full pressure field (p) as
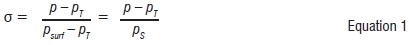
where PT is the prescribed pressure at the model top and Psurf is the full surface pressure and Ps = Psirff - PT.
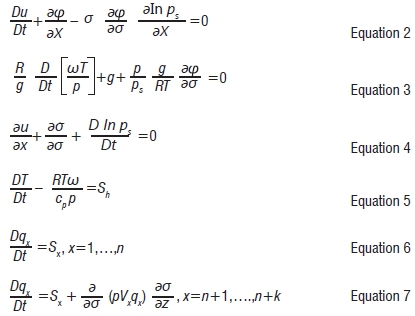
In Equations 2 to 7, the total derivative is given by
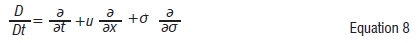
where x represents the horizontal coordinate and t is time. All differentiations with respect to time and the horizontal coordinate are carried out at constant σ. The horizontal component of the wind is u; ø is the geopotential height, gz, z being geometric height; T is temperature; σ=Dσ/Dt and ω=Dp/Dt. R is the gas constant for dry air and k=R/cp, with cP the specific heat of dry air at constant pressure. The development in this study was performed on a two-dimensional model.
The horizontal (Equation 2) and vertical (Equation 3) momentum equations take on the same form as for dry air. The continuity and thermodynamic equations are given by Equations 4 and 5, respectively. Microphysics processes change a particular water class, and also change the temperature through the release and absorption of latent heating. The change in temperature as a result of the microphysics processes is represented by the term on the right hand side of Equation 5. When moisture is introduced, water continuity equations (Equations 6 and 7) have to be solved for all the non-falling and falling water classes in the model, respectively. qx represents the different mixing ratios with x being the place holder for different species of the water substance. Sx represents the microphysics processes that act as sources and sinks for qx The BMP schemes introduced to the NSM use five or six water classes, as discussed in the next subsection.
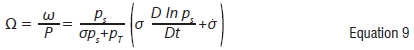
A variable Ω is defined based on the relation between the fields σ and ω as:
Equations 2 to 7 may be combined to obtain an elliptic equation (Equation 10) in the geopotential. An extra term (i.e. last term) appears in the elliptic equation as a result of the microphysics processes (compared with the dry adiabatic form of the equation).
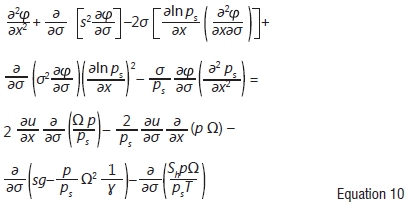
Here, s=(σ+pt/ps)(g/RT)=(p/ps)(g/RT), = cp/cv and Sh is heating or cooling from latent heat release or absorption, respectively. Equation 10 is needed during the numerical solution of governing Equations 2 to 7. The split semi-Langragian method is used to solve the quasi-elastic σ-coordinate equations.
The microphysics schemes
Two microphysics schemes that are used to forecast the changes in mixing ratios as a result of microphysics processes and sedimentation were obtained from the NCAR WRF model.29 The two schemes - the classic and the new - are described below.
The classic scheme
Chen and Sun30 developed a BMP that is based on Lin et al.31 and Rutledge and Hobbs12. The scheme was developed at Purdue University (Indiana, USA) and is known as the PURDUE-LlN scheme. It includes six classes of the water substance, namely water vapour, cloud water, cloud ice, rain, snow and graupel. Chen and Sun30 also applied the saturation adjustment of Tao et al32. All precipitating fields are assumed to fall at their mass-weighted fall speed. Cloud water and cloud ice are assumed to be monodispersed and non-falling. The scheme can be used either with five water classes (i.e. excluding graupel) or with all six classes. The PURDUE-LIN scheme was chosen because it is considered to be a classic scheme, on which most recent schemes are based. There are studies that suggest that PURDUE-LIN is an outlier with the largest biases compared with other schemes33; however, other studies, based on the most complete data sets of tropical convection, have shown the scheme to be comparable in performance with more recently developed schemes.34,35
The new scheme
A new BMP scheme was recently developed at Stony Brook University (New York, USA) using the PURDUE-LIN scheme as a starting point.36 The developers of the scheme called it SBU-YLIN. The SBU-YLIN scheme includes five prognostic equations, for water vapour, cloud water, cloud ice, rain and precipitating ice. Snow and graupel share the same category and hence the same processes, which makes the scheme cheaper to run. The SBU-YLIN scheme uses a generalised gamma distribution to describe size distribution of cloud water droplets Nc=N0cDµe- λD where N0c is the intercept, µ is the shape parameter and λ is the slope. Rain and its related parameterisations are similar to those of the PURDUE-LIN scheme. Cloud ice is assumed to be monodispersed, similar to the PURDUE-LIN scheme; however, ice is allowed to fall. Dry snow, rimed snow and graupel are included in the precipitation ice category through the introduction of varying riming intensity parameters. The SbU-YLIN scheme was chosen because, although it is newer and improved, it is also cheaper to run compared to the classic scheme, which makes it ideal for numerical weather prediction purposes.
Data and methods
The simulations were carried out for three periods: 28 November to 10 December 1992 (A0 experiment), 09 to 21 January 1993 (B0 experiment) and 21 to 29 January 1993 (C0 experiment); all of which were observed using TOGA COARE. TOGA COARE is an observational and modelling program aimed at understanding (1) the basic processes that maintain the warmest waters of the oceans and (2) the role that warm water plays in determining the mean state and variability of climate. The TOGA COARE intensive observing period took place from 01 November 1992 to 28 February 1993 in the near equatorial western Pacific Ocean, part of a region commonly referred to as the warm pool.25
The large-scale advective tendencies of potential temperature and water vapour, which were provided six hourly, were made by Ciesielski37. The NSM's simulated horizontal average winds (u) were relaxed towards the observed horizontal wind (uobs) with a timescale (τ) of 2 h, applied at every time step (Equations 11 and 12). The temperature and water vapour tendencies were interpolated linearly to the NSM's vertical grid and every advection time step and applied directly to the NSM (Equations 13 and 14).
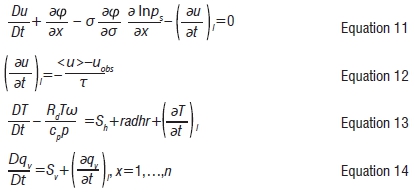
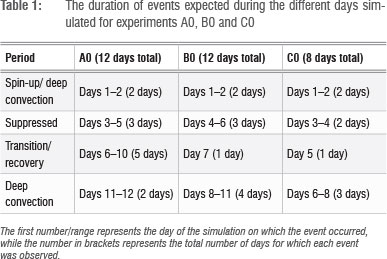
Similarly to Woolnough23, the large-scale forcing was applied only up to the 150 hPa level. Active and suppressed periods were defined by the nature of the large-scale forcing applied. The suppressed periods were defined by periods when the large-scale forcing was acting to dry and warm the column. The active periods were defined by periods during which there was substantial cooling and moistening of nearly the entire column by the large-scale forcing. Each of the three experiments is characterised by deep convection in the first 2 days to spin-up the model, followed by suppressed conditions, and then a transition period, ending with deep convection of different lengths as shown in Table 1. The experiment was run initially for Day 1 of the simulation, with updated large-scale tendencies. The simulated average temperature and water vapour mixing ratio in x were then replaced with the initial condition temperature and water vapour mixing ratio at every advection time step of 10 s. In this way, perturbations were generated and used with the initial conditions and the runs were resubmitted and allowed to simulate for a number of days for each experiment. The sea-surface temperatures and surface pressure were prescribed at every time step. Surface fluxes were calculated using aerodynamic equations as described in Holtslag and Boville38, which allow moisture from the ocean back into the atmosphere. A 2K/day cooling was applied throughout the troposphere. Simulations were made with the PURDUE-LIN and SBU-YLIN schemes. The PURDUE-LIN was run for two cases: with graupel (PURDUE-LIN1) and without graupel (PURDUE-LIN2).
Results
The simulations are initially compared with TOGA COARE observations and then the simulations made with the different microphysics schemes are compared with one another. Such comparisons enable us to determine if the NSM simulations are closer to reality, and whether the response to the large scale is dependent on the microphysics schemes. A combination of simulations made with PURDUE-LIN1 and PURDUE-LIN2 is called PURDUE-LIN simulations. The A0 experiment is discussed in detail, whereas the B0 and C0 experiments are discussed only briefly for comparison with the A0 experiment.
Comparison with TOGA COARE observations
Temperature
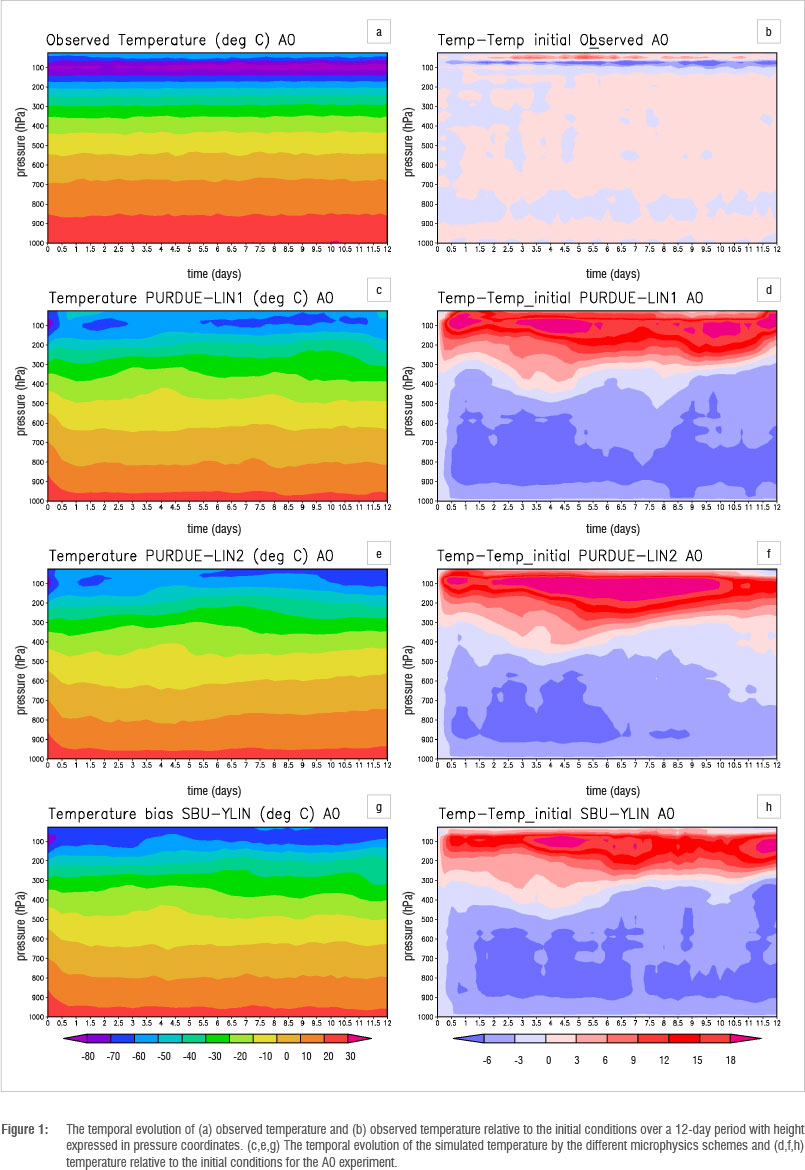
The simulations were compared with the reanalysed full fields generated by Ciesielski37 and therefore correspond fully with the initial conditions and forcing fields used to make the simulations. Figure 1a shows observed temperatures over the 12-day period of the A0 experiment, while Figure 1b shows how the temperature changed over the 12-day period with respect to the initial conditions. The troposphere is generally warmer compared to the initial conditions. Almost throughout the 12-day period, there is a cooler region at a level of about 900-700 hPa. The simulated temperature with all the schemes (Figure 1c, 1e and 1g) decreases significantly in the first few hours of the simulation. The heat seems to be transported from the lower parts of the troposphere to the upper parts. This transport is represented by a much warmer upper troposphere and lower stratosphere compared to the initial conditions in Figure 1d, 1f and 1h. All the microphysics schemes simulate a much cooler region between the 700 hPa and 900 hPa levels which is simulated as a layer much thicker than that observed. This result suggests that the mechanism that leads to a cooler region in the observations is simulated by the NSM even though the simulated layer is much thicker.
The cooling in the first few hours of the simulation during the spin-up period is also simulated in the B0 (Figure 2c, 2e and 2g) and C0 experiments (Figure 2d, 2f and 2h). The cooling in the simulations is much stronger than in the observations (Figure 2a and 2b). This result suggests that the model reaches a steady state with lower temperatures in the lower troposphere and higher temperatures in the upper troposphere and lower stratosphere. Increases in temperature do occur at certain times beyond the first day of simulation; however, the temperature values are not able to recover to levels comparable with the observations and initial conditions. The NSM is able to capture the differences in the experiments. The observations show that the atmosphere is generally cooler in the C0 experiment compared to the initial conditions during the 8-day period (Figure 2b). The NSM is able to capture that the C0 experiment (Figure 2 column 1) is much cooler compared to its initial state, while the A0 and B0 experiments are less cooler compared to their initial states (Figures 1 and 2 column 2). The NSM simulates much cooler conditions during Days 6 to 8 under all the microphysics schemes in the B0 experiment, although this situation is not observed.
Specific humidity
The deep convection periods in the A0 experiment are observed to be characterised by moister conditions in the upper troposphere compared to other days of the simulation period (Figure 3b). This finding is in agreement with those of Lucas and Zipser39 who studied the TOGA COARE observations and found that during rainy periods, the midtroposphere was rather moist with relative humidity in the order of 70%, while during periods without widespread precipitation, the opposite was seen - with a relative humidity of ~40% in the mid-troposphere. The specific humidity is higher everywhere in the lower troposphere up to the 800 hPa level throughout the 12-day period compared to the initial conditions. The moister region corresponds to the cooler region seen in the temperature figures. This result suggests that hydrometeors generally evaporate in this layer, subsequently increasing the amount of water vapour in the atmosphere while cooling the atmosphere as a result of latent heat absorption.
The A0 experiment simulated atmosphere becomes much drier than the initial conditions and observations in the first few hours of the simulation, and then it recovers at some point, but not to the magnitudes found in the initial conditions or observations (Figure 3d, 3f and 3h). This feature is also found in the B0 and C0 experiments (not shown). The cooler and drier troposphere correspond because cooler air carries less water vapour than warmer air. Although much drier than the observations, there is a layer close to the 900 hPa level that is less dry in comparison to layers below and above in the A0 experiment. The last 2 days of the simulation are less dry compared to the rest of the 12 days, which suggests that the NSM responds well to the large-scale forcing (Figure 3d, 3f, 3h and 3i). The simulated specific humidity values in the C0 experiment are smaller compared to the other two experiments, and are similar to differences seen in observations, consistent with temperature differences.
Horizontal winds
The horizontal winds were observed to be westerly in the most part of the troposphere and lower stratosphere during the first deep convection period in the A0 experiment (Figure 4a). The simulated winds compare well with the observed winds in the troposphere (Figure 4c, 4e and 4g) suggesting that the relaxation of the simulated winds to the observations was applied successfully. The differences are bigger at the top of the domain where the relaxation was not applied.
Updrafts and hydrometeor simulations
Deep convection or spin-up period
The large-scale forcing applied to the model in the first 2 days of simulation in all three experiments was done in order to allow deep convection to spin-up the model. In the A0 experiment, convection forms before the end of the first 2 h of simulation, using all three microphysics schemes (Figure 4d, 4f and 4h). As soon as the hydrometeors start forming, the simulated maximum updrafts start to appear different. In all three simulations with different microphysics schemes, the updrafts are stronger on the first day of simulation than on the second day of simulation; on the second day, the updrafts are stronger in the PURDIE-LIN1 simulation and weaker in the SBu-YLIN simulations.
The simulations suggest that the PURDUE-LIN scheme simulates stronger cold pools that are able to trigger stronger storms compared to the SBu-YLIN scheme. Simulated temperature differences (not shown) show that in the first 2 days of the simulation, the PURDUE-LIN2 and SBU-YLIN schemes are generally warmer closer to the surface than the PURDUE-LIN1 simulation. These temperature differences confirm the presence of a stronger cold pool. The SBU-YLIN scheme is the warmest along the surface. The higher temperatures in the SBU-YLIN scheme compared to the PURDUE-LIN schemes extend into the middle and higher troposphere from about 12 h until 24 h in the PURDUE-LIN2 simulation and 26 h in the PURDUE-LIN1 simulation. The higher temperatures suggest the presence of more ice in the SBU-YLIN scheme simulation, which is associated with more latent heat release in its formation. The values of the total mixing ratio of ice (Figure 5) confirm that more ice is simulated by the SBU-YLIN scheme.
The PURDUE-LIN1 scheme acts quicker to remove cloud water and ice from the atmosphere because of the presence of graupel. This is confirmed by the amount of simulated ice by this scheme which is the least of all the schemes (Figure 5b). The SBU-YLIN hydrometeors fall slower and hence produce weaker downdrafts and cold pools. PURDUE-LIN1 simulates the least amount of liquid water, while PURDUE-LIN2 simulates the highest amount of liquid water. This difference is because graupel and rain water in the PURDUE-LIN1 simulation remove cloud water from the atmosphere faster than would be possible in the PURDUE-LIN2 and SBU-YLIN schemes. The simulated liquid water is generally deeper in the SBU-YLIN scheme simulations. The NSM is also found to adequately respond to the large-scale forcing during the spin-up period in both the B0 and C0 experiments (Figure 6).
The suppressed period
The simulated maximum updrafts in the suppressed period are much smaller compared to those in the spin-up period in both the A0 and C0 experiments when using all three microphysics schemes (Figure 4d, 4f, 4h and Figure 6d, 6f, 6h). Some ice particles are simulated, but they are much smaller compared to the active and transition periods (e.g. Figure 5). Woolnough et al.23 found the suppressed period to be dominated by shallow convection with some updrafts penetrating above the melting level. The updraft during the suppressed period in the B0 experiment (Figure 6c, 6e and 6g) is stronger than those in the A0 and C0 experiments, with more ice and liquid water simulated in the B0 experiment. The suppressed period in the B0 experiment forms part of the period for which the large-scale forcing was suspected to have errors.23 Temperatures in the SBU-YLIN scheme are generally higher than the PURDUE-LIN temperatures in the troposphere, suggesting that the cooler and drier biases that are found in the simulations are stronger in the PURDUE-LIN simulations.
Transition period
The simulated maximum updrafts are stronger in the transition period compared to the suppressed period in both the PURDUE-LIN1 and SBU-YLIN simulations and in the A0 and C0 experiments. No recovery is simulated in the PURDUE-LIN2 simulations in the A0 experiment, which illustrates the need for graupel in the simulations. The temperature differences show that the PURDUE-LIN2 is generally much warmer compared to the PURDUE-LIN1 and SBU-YLIN during the transition period. Maximum updrafts in the B0 experiment during the transition period are smaller than during the suppressed period. Woolnough et al.23 found a steady increase in precipitation in the simulations and observations during the transition between the suppressed period and the active period. There is a general recovery in the level of simulated specific humidity in all the simulations during the transition period.
Active period
The maximum updrafts are generally stronger in this period compared to the suppressed and transition periods in all three experiments. In the A0 experiment, SBU-YLIN simulates the strongest updrafts during the first day, and much weaker updrafts in the second day of simulation. PURDUE-LIN1 simulates the highest values during the second day of the active period. PURDUE-LIN2 simulates the smallest values of maximum updrafts and it is also found to be warmer than simulations with two other microphysics schemes. All three schemes simulate the atmosphere reasonably, and can all potentially be used for operational forecasting.
Summary, conclusions and recommendations
A CRM is under development in South Africa. Two bulk microphysics parameterisation schemes were added to a dynamical core of the NSM. The two schemes were obtained from the NCAR WRF model and are called the PURDUE-LIN and SBU-YLIN schemes. The CRM presented here was used to simulate cloud evolution over three periods, which all started with deep convection to spin-up the model, followed by a period during which convection is suppressed, a transition period and a second period of deep convection. Two of the periods were 12 days (A0 and B0), while the third was 8 days (C0). The deep convection, transition and suppressed periods within the longer periods were all of different durations. The PURDUE-LIN scheme was run both with graupel (PURDUE-LIN1) and without graupel (PURDUE-LIN2).
The NSM with newly added microphysics is shown to be able to capture general differences in the experiments. The simulations were found to be colder and drier compared to observations, for all the experiments performed and for all options of microphysics schemes used. The PURDUE-LIN simulations display a larger cold bias than the SBU-YLIN simulations. Previous studies have shown that PURDUE-LIN1 tends to overpredict precipitation because it unrealistically converts snow to graupel which falls out quicker.40,41 Our results also show that PURDUE-LIN simulates more rain than does SBU-YLIN. Moreover, in the lower levels, the melting of graupel and stronger downdrafts induced by graupel are likely contributing to the larger cold bias in PURDUE-LIN1 simulations.
Of the three observed periods, A0 was generally the warmest throughout the troposphere but cooler in a layer between 900 hPa and 600 hPa. The model captured the existence of this relatively cool layer, but overestimated its depth. The C0 experiment represented the observed atmosphere that evolved into the coolest state (relative to the observations). The NSM realistically simulated this evolution of the large-scale state. The different amounts of hydrometeors influence the temperature as a result of latent heating or absorption, which then determines how the atmosphere responds when the large-scale forcing is applied. In general, the NSM captured the differences in the suppressed, transition and active regimes, with some simulations being more realistic than others. In general, all three microphysics schemes were comparable, with the scheme without graupel being least realistic.
Further development of the NSM is continuing, with the implementation of a sophisticated radiation scheme almost completed. Preliminary results show a slightly warmer lower troposphere, which is an improvement over the simulations without a radiation scheme. The results presented here illustrate progress towards the development of a CRM that can be used to study the attributes of cumulus cloud and convective rainfall over the southern African region.
Acknowledgements
The CSIR is acknowledged for funding this work through a parliamentary grant and Young Researcher Establishment Funds. The Centre for High Performance Computing (CHPC) as well as the Applied Centre for Climate and Earth System Science (ACCESS) are also acknowledged for their support. Two anonymous reviewers are acknowledged for their valuable comments.
Authors' contributions
M.M.B. undertook the development of the model and experiments; F.A.E. supervised and helped throughout the study; D.A.R. advised and helped throughout the study; and W.A.L. supported the study and helped with the writing of the manuscript.
References
1. Engelbrecht FA. Theory and application of quasi-elastic equations in terrain -following coordinates based on the full pressure field [PhD thesis]. Pretoria: University of Pretoria; 2006. [ Links ]
2. Engelbrecht FA, McGregor JL, Rautenbach CJdW. On the development of a new non-hydrostatic atmospheric model in South Africa. S Afr J Sci. 2007;103:3-4:127-134. [ Links ]
3. Bopape MM, Engelbrecht FA, Randall DA, Landman WA. Simulating moist convection with a quasi-elastic equation. SASAS 2012: Bridging the Gap; 2012 Sep 26-27; Cape Town, South Africa. South African Society for Atmospheric Sciences; 2012. p. 65-66. [ Links ]
4. Abiodun BJ, Prusa JM, Gutowski Jr WJ. Implementation of a non-hydrostatic, adaptation, adaptive-grid dynamics core in CAM3. Part I: Comparison of dynamics cores in aqua-planet simulations. Clim Dynam. 2008;31:795-810. http://dx.doi.org/10.1007/s00382-008-0381-y [ Links ]
5. Engelbrecht FA, Tsugawa M, McGregor JL. Development of a new coupled climate model in South Africa: Recent developments and future plans. SASAS 2012: Bridging the Gap; 2012 Sep 26-27; Cape Town, South Africa. South African Society for Atmospheric Sciences; 2012. [ Links ]
6. Beraki A, Landman WA, De Witt D. Southern hemisphere climate variability as represented by an ocean-atmosphere coupled model. SASAS 2012: Bridging the Gap; 2012 Sep 26-27; Cape Town, South Africa. South African Society for Atmospheric Sciences; 2012. p. 14-15. [ Links ]
7. Randall DA. A university perspective on global climate modeling. Bull Am Meteorol Soc. 1996;77:2685-2690. http://dx.doi.org/10.1175/1520-0477(1996)077<2685:AUPOGC>2.0.CO;2 [ Links ]
8. Phillips NA. A coordinate system having some special advantages for numerical forecasting. J Meteorol. 1956;14:184-185. http://dx.doi.org/10.1175/1520-0469(1957)014<0184:ACSHSS>2.0.CO;2 [ Links ]
9. Reason CJC, Engelbrecht F, Landman WA, Lutjeharms JRE, Piketh S, Rautenbach H, et al. A review of South African research in atmospheric science and physical oceanography during 2000-2005. S Afr J Sci. 2006;102:1-2:35-45. [ Links ]
10. Randall DA, Xu K, Sommerville RJC, Iacobellis S. Single-column models and cloud ensemble models as links between observations and climate models. J Clim. 1996;9:1683-1697. http://dx.doi.org/10.1175/1520-0442(1996)009<1683:SCMACE>2.0.CO;2 [ Links ]
11. Kessler E. On the distribution and continuity of water substance in atmospheric circulations. Meteor Monogr Amer Meteorol Soc. 1969;32:1-84. [ Links ]
12. Rutledge SA, Hobbs PV. The mesoscale and microscale structure and organization of clouds and precipitation in midlatitude cyclones. XII: A diagnostic modeling study of precipitation development in narrow cold-frontal rainbands. J Atmos Sci. 1984;41:2949-2972. http://dx.doi.org/10.1175/1520-0469(1984)041<2949:TMAMSA>2.0.CO;2 [ Links ]
13. Stensrud DJ. Parameterisation schemes: Keys to understanding numerical weather prediction models. New York: Cambridge University Press; 2007. http://dx.doi.org/10.1017/CBO9780511812590 [ Links ]
14. Milbrant JA, Yau MK. A multimoment bulk microphysics parameterisation. Part IV: Sensitivity experiment. J Atmos Sci. 2006;63:3137-3159. http://dx.doi.org/10.1175/JAS3817.1 [ Links ]
15. Morrison H, Milbrandt J. Comparison of two-moment bulk microphysics schemes in idealised supercell thunderstorm simulations. Mon Weather Rev. 2011;139:1103-1130. http://dx.doi.org/10.1175/2010MWR3433.1 [ Links ]
16. Thompson G, Field PR, Rasmussen RM, Hall WD. Explicit forecasts of winter precipitation using an improved bulk microphysics scheme. Part II: Implementation of a new snow parameterisation. Mon Weather Rev. 2008;136:5095-5115. http://dx.doi.org/10.1175/2008MWR2387.1 [ Links ]
17. Grabowski WW, Wu X, Moncrieff MW. Cloud-resolving modeling of tropical cloud systems during Phase III of GATE. Part I: Two-dimensional experiments. J Atmos Sci. 1996;53:3684-3708. http://dx.doi.org/10.1175/1520-0469(1996)053<3684:CRMOTC>2.0.CO;2 [ Links ]
18. Xu K, Randall DA. Updraft and downdraft statistics of simulated tropical and midlatitude cumulus convection. J Atmos Sci. 2001;58:1630-1649. http://dx.doi.org/10.1175/1520-0469(2001)058<1630:UADSOS>2O.CO;2 [ Links ]
19. Harrison MSJ. A generalized classification of South African summer rain-bearing synoptic systems. Int J Climatol. 1984;4:547-560. http://dx.doi.org/10.1002/joc.3370040510 [ Links ]
20. De Coning E, Forbes GS, Poolman E. Heavy precipitation and flooding on 1214 February 1996 over the summer rainfall regions of South Africa: Synoptic and isentropic analysis. National Weather Digest. 1998;22:25-36. [ Links ]
21. Hart NCG, Reason CJC, Fauchereau N. Tropical-extratropical interactions over southern Africa: Three cases of heavy summer season rainfall. Mon Weather Rev. 2010;128:2608-2623. http://dx.doi.org/10.1175/2010MWR3070.1 [ Links ]
22. Khairoutdinov MF, Randall DA. Cloud resolving modelling of the ARM summer 1997 IOP: Model formulation, results, uncertainties, and sensitivities. J Atmos Sci. 2003;60:607-625. http://dx.doi.org/10.1175/1520-0469(2003)060<0607:CRMOTA>2.0.CO;2 [ Links ]
23. Woolnough SJ, Blossey PN, Xu K-M, Bechtold P Chaboureau J-P Hosom J, Iacobellis S, et al. Modelling convective processes during the suppressed phase of the single-column models with cloud-resolving models. Q J Roy Meteor Soc. 2008;136:333-353. [ Links ]
24. Petch JC, Willet M, Wong RY Woolnough SJ. Modelling suppressed and active convection. Comparing a numerical weather prediction, cloud-resolving and single-column model. Q J Roy Meteor Soc. 2007;133:1087-1100. http://dx.doi.org/10.1002/qj.109 [ Links ]
25. Webster PJ, Lukas R. TOGA COARE: The Coupled Ocean-Atmosphere Response Experiment. Bull Am Meteorol Soc. 1992;73:1377-1416. http://dx.doi.org/10.1175/1520-0477(1992)073<1377:TCTCOR>2O.CO;2 [ Links ]
26. Randall D, Krueger S, Bretherton C, Curry J, Duynkerke P Moncrieff, et al. Confronting models with data: The GEWEX Cloud Systems Study. Bull Am Meteorol Soc. 2003;84:455-469. http://dx.doi.org/10.1175/BAMS-84-4-455 [ Links ]
27. Willet MR, Bechtold P Williamson DL, Petch JC, Milton SF, Woolnough SJ. Modelling suppressed and active convection: Comparisons between three global atmospheric models. Q J Roy Meteor Soc. 2008;134:1881-1896. http://dx.doi.org/10.1002/qj.317 [ Links ]
28. White AA. An extended version of a non-hydrostatic, pressure coordinate model. Q J Roy Meteor Soc. 1989;115:1243-1251. http://dx.doi.org/10.1002/qj.49711549004 [ Links ]
29. Skamarock WC, Klemp JB, Dudhia J, Gill DO, Barker DM, Wang W, et al. A description of the Advanced Research WRF Version 2. NCAR Tech Notes-468+S. Boulder, CO: National Center for Atmospheric Research; 2005. [ Links ]
30. Chen S, Sun W. A one-dimensional time dependent cloud model. J Meteorol Soc Japan. 2002;80:99-118. http://dx.doi.org/10.2151/jmsj.80.99 [ Links ]
31. Lin Y Farley RD, Orville HD. Bulk parametrization of the snow field in a cloud model. J Clim Appl Meteor. 1983;22:1065-1090. http://dx.doi.org/10.1175/1520-0450(1983)022<1065:BPOTSF>2O.CO;2 [ Links ]
32. Tao W-K, Simpson J, McCumber M. Notes and correspondence, an ice-water saturation adjustment. Mon Weather Rev. 1989;117:231-235. http://dx.doi.org/10.1175/1520-0493(1989)117<0231:AIWSA>2.0.CO;2 [ Links ]
33. Jankov I, Grasso LD, Sengupta M, Neiman PJ, Zupanski D, Zupanski M, et al. An evaluation of five ARW-WRF microphysics schemes using synthetic GOWS imagery for an atmospheric river event affecting the California coast. J Hydrometeorol. 2011;12:618-633. http://dx.doi.org/10.1175/2010JHM1282.1 [ Links ]
34. Wang Y Long CN, Leung LR, Dudhia J, McFarlane SA, Mather JH, et al. Evaluating regional cloud-permitting simulation of the WRF model for the Tropical Warm Pool International Cloud Experiment (TWP-ICE), Darwin, 2006. J Geophys Res. 2009; D21203. [ Links ]
35. Rajeevan M, Kesarker A, Thampi SB, Rao TN, Radhakrishna B, Rajasekhar M. Sensitivity of WRF cloud microphysics to simulations of a severe thunderstorm event over Southeast India. Ann Geophys. 2010;28:603-619. http://dx.doi.org/10.5194/angeo-28-603-2010 [ Links ]
36. Lin Y, Colle BA. A new bulk microphysical scheme that includes riming intensity and temperature-dependent ice characteristics. Mon Weather Rev. 2011;139:1013-1035. http://dx.doi.org/10.1175/2010MWR3293.1 [ Links ]
37. Ciesielski PE, Johnson RH, Haertel PT, Wang J. Corrected TOGA COARE sounding humidity data: Impact on diagnosed properties of convection and climate over the warm pool. J Clim. 2003;16:2370-2384. http://dx.doi.org/10.1175/2790.1 [ Links ]
38. Holtslag AM, Boville BA. Local versus nonlocal boundary-layer diffusion in a global climate model. J Clim. 1993;6:1825-1842. http://dx.doi.org/10.1175/1520-0442(1993)006<1825:LVNBLD>2.0.CO;2 [ Links ]
39. Lucas C, Zipser EJ. Environmental variability during TOGA COARE. J Atmos Sci. 2000;57:2333-2350. http://dx.doi.org/10.1175/1520-0469(2000)057<2333:EVDTC>2.0.CO;2 [ Links ]
40. Hong S-Y Lim K-SS, Kim J-H, Lim J-OJ, Dudhia J. Sensitivity of cloud-resolving simulations with WRF using two bulk microphysical parameterizations: Ice-phase microphysics versus sedimentation effects. J Clim Appl Meteor. 2009;48:61-76. http://dx.doi.org/10.1175/2008JAMC1960.1 [ Links ]
41. Lin Y Colle BA. The 4-5 December 2001 IMPROVED event: Observed microphysics and comparisons with the weather research and forecasting model. Mon Weather Rev. 2009;137:1372-1392. http://dx.doi.org/10.1175/2008MWR2653.1 [ Links ]
 Correspondence:
Mary-Jane Bopape
Natural Resources and the Environment
Council for Scientific and Industrial Research
PO Box 395, Pretoria 0001, South Africa
EMAIL: mmbopape@csir.co.za
Received: 03 May 2013
Revised: 19 Sep. 2013
Accepted: 27 Feb. 2014

