


![Dichloro(bis[diphenylthiourea])cadmium complex as a precursor for HDA-capped CdS nanoparticles and their solubility in water](/img/pt/prev.gif)


Serviços Personalizados
Artigo
 Inglês (pdf)
 Artigo em XML
 Referências do artigo
Indicadores

Links relacionados
-
 Citado por Google
 -
 Similares em Google
Compartilhar

 Permalink
South African Journal of Science
versão On-line ISSN 1996-7489
versão impressa ISSN 0038-2353
S. Afr. j. sci. vol.110 no.7-8 Pretoria Ago. 2014
RESEARCH ARTICLE
Relationships between ecological infrastructure and the economy: The case of a fishery
Jacobus G. CraffordI; Rashid M. HassanII
IPrime Africa, Pretoria, South Africa
IICentre for Environmental Economics and Policy in Africa, Department of Agricultural Economics, University of Pretoria, Pretoria, South Africa
ABSTRACT
The Millennium Ecosystem Assessment identified the regulating services as amongst the least understood but potentially most valuable services offered by ecosystems. This lack of understanding of regulating services has been a major reason for the overexploitation and degradation of ecosystems. The value of regulating services is best determined through an economic production function approach, which derives the value of regulating services as intermediate inputs into other economic goods and services. We used existing scientific knowledge and data sourced from existing scientific databases and studies to develop and demonstrate empirical production functions that measure relationships between ecological infrastructure and the economy in fisheries in KwaZulu-Natal, along the east coast of South Africa. We applied econometric analyses - a technique that allows for evidence-based analysis of observed data, based on existing scientific knowledge. Our work demonstrates that existing scientific databases may contain useful evidence of relationships between ecological infrastructure and the economy, and that decisions need not always wait for the results of controlled experiments.
Keywords: biodiversity; ecological infrastructure; production functions; marine and coastal ecosystems; estuaries, ecosystem services
Introduction
The Millennium Ecosystem Assessment (MEA) identified the regulating services as amongst the least understood but potentially most valuable services offered by ecosystems.1,2 These services enable ecosystems to continue to produce other direct benefits to humans, over a range of stresses or shocks, often of anthropogenic origin. Such services may also be interpreted as providing 'insurance' value, as they allow the system to continue to function over a range of conditions.2,3
The lack of understanding of regulating services has been the major reason for overexploitation and degradation of ecosystem assets and the ecosystem services they provide to humans.1,4-7 Dasgupta8 attributed this exclusion to a historical propensity by mainstream development economists to judge ecosystems as luxury goods which would improve as wealth improves, as well as to the low visibility of continuous ecosystem degradation. In addition, Perrings9 described several typical weaknesses in environmental economic study approaches. One of the most significant weaknesses was that most of these studies focused primarily on the direct use values of the environment, and put comparatively little effort into understanding the indirect linkages among ecological functioning, ecosystem services and the production and consumption of other economic goods and services.
In order to address these problems, the MEA1,5 and The Economics of Ecosystems and Biodiversity6 (TEEB) initiative introduced a new way of thinking about the value of biodiversity as a life-supporting system underlying the benefits provided by ecosystem services to human society. Central to this approach is the definition of the concept of ecosystem services. TEEB defines ecosystem services as the direct and indirect contributions of ecosystems to human well-being. TEEB distinguishes among four types of ecosystem services: provisioning, cultural, regulating and supporting services. Provisioning services describe the material or energy outputs from ecosystems. Cultural services include the non-material benefits people obtain from contact with ecosystems. Regulating services are the services that ecosystems provide by acting as regulators. Supporting services underpin almost all other services through their function of providing living spaces for humans, plants and animals. Regulating services play an indirect role in the economy and mitigate environmental risk.
There is consensus amongst the professional community of resource economists that an economic production function approach is best suited as a valuation method for intermediate ecosystem services. These production functions quantify values for ecosystem services that contribute at least part of the value of those resources. They would apply knowledge of ecosystem functioning and processes to derive the value of supporting and regulating ecosystem services. They do this through deriving the value of ecosystems and the services they provide as intermediate inputs into goods and services that are produced and consumed by economic agents.9-14 An ecological production function considers an ecosystem service as a dependent variable (or response variable), and one or more ecosystem component and/or process indicators as independent variables (or influencing factors/determining variables).
Ecological production functions require an understanding of the concepts of ecological infrastructure and biodiversity. The South African National Biodiversity Institute describes ecological infrastructure as a network of natural assets 'that conserve ecosystem values and functions and provide associated benefits to society'. Another useful characterisation is provided by Noss15 who describes biodiversity as the composition, structure and function of an ecosystem:
...[Composition has to do with the identity and variety of elements in a collection, and includes species lists and measures of species diversity and genetic diversity. Structure is the physical organization or pattern of a system, from habitat complexity as measured within communities to the pattern of patches and other elements at a landscape scale. Function involves ecological and evolutionary processes, including gene flow, disturbances, and nutrient cycling.
In this study, we applied the ecosystem services framework and used the concepts of composition, structure and function of an ecosystem to formulate and demonstrate production functions to link ecological infrastructure and biodiversity to the economy, in the form of a case study. The practical challenge in so doing lies in the application of an economic technique known as econometric analysis. This technique allows for evidence-based analysis of multiple variables. Econometrics requires the application of time-series or cross-sectional, observed data for assessing economic theories, in this case resource economic theories, based on existing scientific knowledge. Econometrics most often employs regression analysis, as the data available are most often not sourced from controlled experiments. The advantage of this type of analysis is that it provides information on the extent to which society indirectly depends on components of ecosystems and the degree of risk that society is exposed to when ecosystems degrade.
Thus, using existing scientific knowledge and data sourced from existing databases and studies, we developed and demonstrate empirical production functions to measure such relationships in KwaZulu-Natal (KZN) fisheries along the east coast of South Africa as a case study. Marine and estuarine systems are demonstrated separately.
KwaZulu-Natal fisheries
The province of KZN on the east coast of South Africa supports a significant shore and boat recreational fishing industry, a small commercial linefishing industry and various subsistence fisheries.16 The KZN fish fauna include resident species that spawn locally and have local nurseries (some of which are estuaries), pelagic summer migrants from tropical Indian Ocean waters that spawn in the tropics and have distant nurseries, and winter migrants from Cape waters, which move into KZN waters to spawn, before returning south in early summer.17-19
Various studies have quantified the economic size of these fisheries, both in estuarine and marine ecosystems.20-23 These studies report various economic indicators, for a variety of years, and use different valuation techniques. A combined analysis of the work done in these studies indicates that the size of the total fisheries industry may vary between R900 million and R1400 million per year, measured in terms of the industry's contribution to the gross domestic product (GDP). The variation results from changes in catch and in input and output prices, which vary from year to year. Interestingly, the largest component of this industry is recreational shore and boat fishing (in estuarine and marine systems), for which the expenditure on fishing tackle and the associated travel cost contribute significantly. Another very significant contributor is subsistence fisheries, whose contribution to GDP is a form of economic externality as the activity takes place in the informal economy.
South Africa has an excellent body of marine and estuarine science that explains the dependence of this important and large economic sector on ecosystems. It is well known that the more productive fishery zones around the southern African coast are driven primarily by oceanic nutrient upwelling. In contrast, the KZN coast of southern Africa is located in a highly nutrient-depleted section of the Indian Ocean and is thus believed to rely heavily on nutrient influx from terrestrial run-off.24 Thus nutrient influx into the system is sporadic, and tied closely to annual variations in climate, rainfall and, ultimately, run-off. In addition, terrestrial plant material is washed down rivers and, together with decaying seaweed, is macerated by wave action, providing a major input of detritus to filter feeders such as mussels, oysters and ascidians.17
Rivers and estuarine canals supply freshwater run-off and nutrients into the estuaries. They often are lined with white mangroves and, together with the tidal flats, support the most productive area in the KZN coast in terms of crustacean abundance and diversity.18,25 The main body of mangroves in the KZN estuarine meta-system comprises white mangrove (Avicennia marina) occurring on the fringes of some estuaries, the largest of which (about 1200 ha) is found in the Mhlathuze Estuary. Tidal flats, both intertidal and sub-tidal, comprise the most extensive habitat in the meta-system. These tidal flats, together with the upper estuary areas, bear productive benthic faunas and are the important nursery habitats of juvenile estuary-dependent fish, crustacea and other marine animals, and also of waterbirds and fish that feed on them.18
Such scientific knowledge creates an important starting point for the development of ecological production functions.
Measuring relationships between biodiversity and fish production
In this study, we adapted the MEA and TEEB frameworks of ecosystem services, both of which broadly define two sets of services - those that are directly consumed as final products in the economy (direct benefits provided by provisioning and cultural services) and those that are used as inputs in generating products for final consumption (intermediate benefits provided by regulating and supporting services).
Fisheries supply both provisioning and cultural services: fish caught by commercial and subsistence fishers provide food and fishing serves a recreational purpose. Clearly, both of these services provide valuable benefits to various social and economic sectors and to the people off the KZN coast. Market valuation techniques for provisioning services of fisheries are well developed. Cost functions for both commercial and recreational fishing typically take the form of multiple regression functions in which the catch (H) in a period (t) is a function (f) of the fish biological production, e.g. biomass (St) and fishing effort (Et)1213:

By comparison, economic valuation techniques for intermediate ecosystem services are less developed. The production function approach has been the most common model for valuing the marginal contribution of intermediate ecosystem services. In the following sections we develop ecological fishery production functions based on the three elements that constitute the concept of biodiversity: function, composition and structure.
Capturing the functional effects of nutrients on fish production
There is ample evidence in the literature that nutrient levels strongly influence fish abundance and biological production. The KZN coastline is characterised as an oligotrophic (or nutrient deficient) marine ecosystem. Thus freshwater run-off from rivers is considered an important source of nutrient loading into estuaries and the marine environment.16,26,27
Our specification therefore describes the functionality of the system by the relationship:

where St is an indicator of biological production, and Nt is an indicator of nutrient load in the fish production system.
Capturing effects of ecosystem structure and composition on fisheries
In the case of estuarine-dependent fish species, nutrient levels alone are insufficient to describe the ecological system influencing fish production. The compositional and structural elements of estuarine biodiversity also provide important ecological infrastructure, in particular with respect to hydrodynamics and primary production. Hydrodynamics is important because the ecosystem services yielded by estuaries depend in the first place on the flow of water and the materials carried in the water.16,28-30 Both tidal flows and freshwater inflows are important. Freshwater inflows, especially during full spate, deliver nutrients in the form of dissolved and suspended solids. Much of the suspended solids settle in the estuaries31 while the rest pass into the main water body where they precipitate as mud in the benthos, or, if organic, are carried out with the tides or decayed or comminuted, and then consumed by detritus feeders. Primary production in estuaries results from photosynthetic microorganisms, mainly microalgae, in the shallow benthos and from phytoplankton in the water body and mangroves. The rich benthic filter- and particle-feeding communities of the tidal flats, especially the sub-tidal flats, are key to primary production. They provide energy and nutrition to the fry of sea-breeding and other fish in the shelter of the shallows and thus form the link in the local and regional fisheries chain. The benthic animals and the abundant small fish attract predators, such as larger fish and birds, and form the basis for recreational activities and other services.24
Indicators of the ecological infrastructure of an estuary include variables describing the type of habitat services provided, areas of tidal flats and mangroves, and measures of the degree of openness, reflecting retention time and accessibility to juvenile fish. Estuaries are also prone to degradation caused by various forms of human activity, relating to various forms of water pollution, physical destruction and other disturbances. As a result, various estuarine ecology studies have developed indicators of human disturbance through rating the condition of estuaries.32-34
Thus, our specification describes the functionality of the system by the relationship:

where St is an indicator of biological production, Nt is an indicator of nutrient load in the estuarine system, TYPE is an indicator of the degree of openness of the estuary, HAS is a vector of habitat types (shallow sub-tidal sand, mud flats and mangroves) preferred by various fish species and COND measures anthropogenic disturbance and its resultant degradation of system quality.
In addition to such key structural characteristics, the compositional elements of an estuarine ecosystem are also crucial for biological production of estuarine-dependent fish. There is strong evidence in the literature that higher ecosystem resilience, and thus productivity, is achieved through higher levels of species diversity.14 Species-area studies further suggest that species diversity is significantly related to the available area of suitable quality habitat.35 Equation 3 is thus redefined to reflect these effects in a system of two equations:
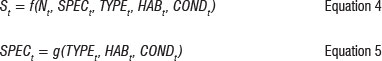
where SPEC t is an indicator of species abundance in the estuarine system.
Data and methods
We employed the above analytical framework to specify an empirical model to measure the relationship between the recreational fishery and the compositional and structural elements of estuarine biodiversity.
Data and variables in the empirical analysis
Although the analytical framework developed above implies that Equations 1 to 4 represent a system of interlinked processes and responses, unavailability of appropriate data necessitated separation of the empirical analysis into two components in empirical specification and implementation.
The first component analyses the functional effects of terrestrial nutrient deposition on the commercial marine linefishing industry. An excellent data source is the fish egg database on the website www. fisheggsandlarvae.com.24 This time-series data forms part of a 24-year sampling record of spawning patterns of fishes with pelagic eggs, on the inshore shelf within 5 km of the coast, along a short section of the KZN coastline 50 km south of Durban.19 The data set also includes mean annual run-off (MAR) data suitable for the purposes of analysing the relationship between nutrient influx and fish egg biomass.25 We thus use time series data on run-off available from a different source coupled with corresponding information on an alternative index of fish biomass (i.e. fish egg abundance) to empirically specify and measure nutrient loading influences of run-off as a separate component.
The second component of the model employs cross-sectional data to capture effects of the other elements of biodiversity - in this case, the compositional estuarine ecosystem elements influencing fish productivity. Two data sets containing cross-sectional data collected independently by two research teams from sub-sets of the east coast sub-tropical estuaries of South Africa are available. One data set was compiled by Dr George Begg and was published in hard copy as The Estuaries of Natal volumes 132 and 233. These data were based on extensive environmental monitoring carried out on 72 estuaries during the late 1970s and early 1980s. A second data set was compiled by Dr Trevor Harrison for the State of SoUth African Estuaries report for the Department of Environmental Affairs in 2000.36 Harrison evaluated 47 estuaries along the KZN coast.
The combined Begg-Harrison cross-sectional data comprised more than 120 measures of various estuary components and processes. Both Begg and Harrison conducted extensive biological sampling and recorded the abundance (biomass) and number of fish species in the surveyed estuaries. Several other compositional and structural characteristics of KZN estuaries were included in Begg and Harrison's cross-sectional data. Key among these measurements are: (1) estuary depth and shoreline length used as proxies for the extent of tidal flat area; (2) the type of estuary, reflecting the degree of openness of the estuary; and (3) rating of the general condition of the estuary. These variables all have important functions in the production of estuarine ecosystem services. The degree of openness measures the connectivity of an estuary to the marine ecosystem. Highly connected estuaries (i.e. those that are open for 12 months of the year) will be more productive than estuaries that are only temporarily open, and would be expected to have higher species richness. The shoreline length (in kilometres) and area of shallow sub-tidal flats (in hectares) are both measures of habitat area. The condition of the estuary is rated through an index, which measures its general health and levels of human disturbance (e.g. pollution and physical alterations). Begg also provides measures of terrestrial run-off, either directly as river inflow into estuaries or indirectly as catchment areas which, with MAR, can yield run-off values. The Begg-Harrison data also contain a measure of dissolved oxygen (in mg/litre), which is indirectly proportional to nutrient content as higher levels of dissolved oxygen in these estuaries are commonly associated with poorer nutrient load conditions.37 More dissolved oxygen is primarily a result of larger systems which are open and subject to marine flushing, rather than related to nutrient concentration.
A notable difference between Begg's and Harrison's data sets relates to their fish sampling gear: Begg used a small beam trawl while Harrison used a variety of nets including seine nets and gill nets (Connell A 2013, oral communication, March 06). We therefore used only the Harrison data set for fish species and abundance data, with data standardised to a catch per unit effort.
Empirical models
The first component of the above specified analytical framework describing the relationship between freshwater run-off and fish egg abundance (Equation 2) was estimated using nutrient influx data and counts of fish eggs as an indicator of the condition of those fish species that spawn in the area. These data are available in time series.19 Whilst we recognise that both the condition of the spawner biomass and seasonal variables will influence spawning intensity, counts of fish eggs are expected to be influenced by MAR in the current year (MARt), as nutrient inflow indirectly promotes spawning. Nutrient inflow promotes primary productivity, which increases the biomass of zooplankton grazers benefitting from the algal blooms. The zooplankton and algal mix form a good food source for grazing fish such as anchovy, sardine and other small shoaling species. As these are the key spawners, one would thus expect a lag - of about one year - between high nutrient input (rainfall) and high egg production. One can expect a further lag before the predatory fish that feed on these small shoaling species also contribute to higher spawning levels. We accordingly estimated extended versions of the model in Equation 2 to account for lagged MAR effects. The following specifications of the relationship were empirically tested:

The second component of the analytical framework describing the relationship between estuaries ecosystem structure and composition was estimated using the Begg-Harrison cross-sectional data set, which allowed specification of the following system of ecological production function equations:
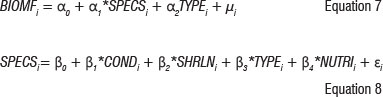
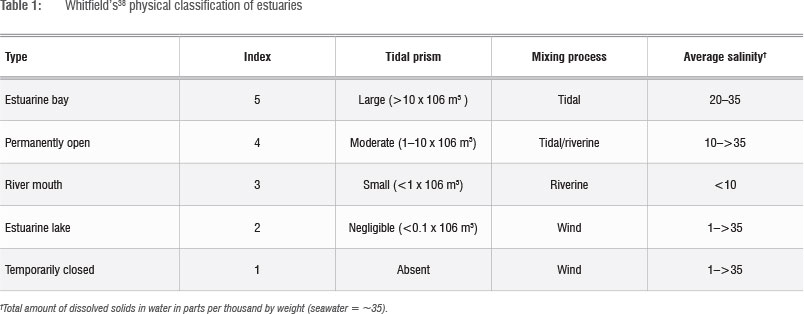
where BIOMF measures the total weight of fish caught in grams per sample in estuary i; SPECSj is the number of fish species in the sample from estuary i, CONDj is an index of the condition of estuary i measured through the Harrison-Whitfield multimetric estuary index25 and SHRLNj measures the length of the shoreline of estuary i (in metres). TYPEi is an index that refers to the classification of estuary as defined by the Whitfield physical classification of estuaries (see Table 1), NUTRI, is an index of the nutrient capacity of the estuarine system and was calculated by dividing the catchment area (in km2) by the volume of the estuary waterbody (in m3),  and
and  are model parameters and
 and
and  are the residual error terms.
Equation 7 specifies the biological production of fish to be a function of the number of species present in the system (diversity composition effect) and the estuary type. In Equation 8, the number of species present in the system (species richness) is modelled to vary with differences in key ecosystem component and process variables: estuarine condition as measured by the Harrison-Whitfield multimetric estuary index is a good indicator of the overall ecosystem health of an estuary.38 Shoreline length is a proxy for the extent of tidal flat area, which is an indicator of the area of shallow sub-tidal flats, which is important fish feeding habitat. Estuarine type is important because larger estuaries that are permanently open to the sea generally provide more diverse habitat and improved connectivity between marine and estuarine habitats, and thus allow for a greater number of fish species. Nutrient cycling is important because estuaries with larger catchment areas (within the same metasystem) would produce more detritus and are more likely to flush the estuary. The NUTRI variable also indirectly captures effects of run-off on nutrient capacity, as a larger catchment area is expected to have a higher MAR and thus higher nutrient input.
Results of the empirical analysis
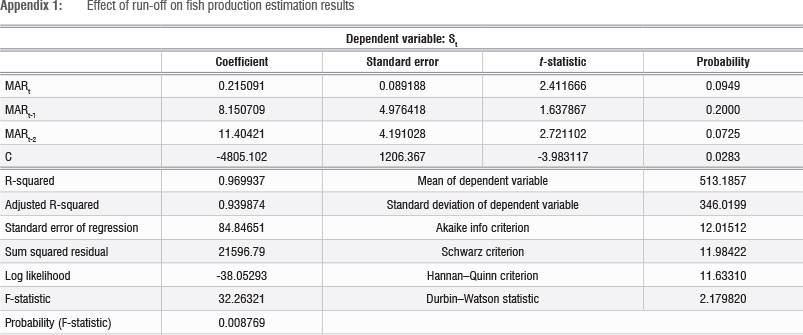
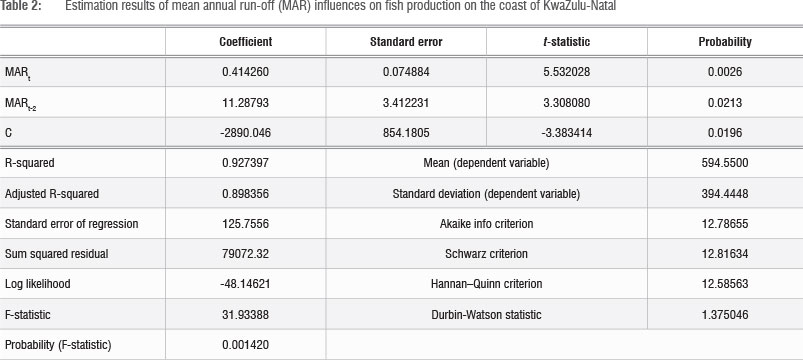
The empirical relationship between run-off and spawning intensity was estimated using linear and Cobb-Douglas functional forms. The linear form function gave the best statistical performance (Table 2). The results show that nutrient input into the system in the current period t, combined with lagged effects of nutrient input over the preceding 2 years (t-1 and t-2), explains 97% of the variation in St (fish egg abundance) (Appendix 1). However, the effect of a one-period lag (Mt-1) was not statistically significant and hence estimation results for the statistically significant two-period lag are reported in Table 2. Both coefficients indicate a strong positive correlation between run-off and spawning intensity. The lagged effect is consistent with the life-cycle characteristics of fish, which reach spawning maturity after 12-24 months. It should be noted that the improved condition of the spawning adults in the population, resulting from improved nutrition, contributed to the increased spawning.
The fact that the variable SPEC appears on both sides of the system in Equations 7 and 8 implies an endogeneity problem and hence that an ordinary least squares estimation is not appropriate. A two-stage least squares (2SLS) procedure was accordingly employed to estimate the parameters of this system, which, unlike an ordinary least squares approach, yields consistent estimators of system parameters.39 Two functional form specifications were tested: the linear and Cobb-Douglas (double-log) forms. The linear function gave the best statistical fit. Results of the 2SLS estimation of the linear system are presented in Table 3. Results of the double-log function are reported in Appendix 2.
The influences of all factors in the linear 2SLS model are of high statistical significance and all show the expected sign, i.e. direction of effect. Equation 7 relates the number of species (SPECS) and the estuarine type (TYPEi) to fish biomass (BIOMFi), and these two variables explained 43% of the variation in fish biomass (BIOMF).
As expected, catch size of fish biomass in an estuary increases with increasing number of fish species at more than 99.9% confidence limit. This result is very important as it provides strong scientific evidence that biodiversity, as measured by species abundance, is positively correlated with biomass abundance, and thus the productivity of the estuarine system. Similarly, levels of fish biomass in an estuary are higher in larger estuaries with a higher degree of openness, as measured by the Whitfield physical classification index of estuaries (TYPEj was significant at a 99% confidence limit).
Equation 8 measures the effects of estuary ecosystem component factors on fish species abundance, which explained more than 70% of the variation in fish species. The area of shallow sub-tidal flats (measured by shoreline length (SHRLN )), estuarine type (TYPE ) and the nutrient capacity (NUTRI ) of the estuary were all highly statistically significant variables. This finding means that larger estuaries with larger shallow sub-tidal flat habitats, higher degrees of openness and larger nutrient capacities will accommodate a richer diversity of fish species.
Estuarine condition (COND) as measured by the Harrison-Whitfield multimetric estuary index, which uses a multiple of indicators, showed a strong positive correlation with species diversity and was significant at the 99.9% confidence limit.
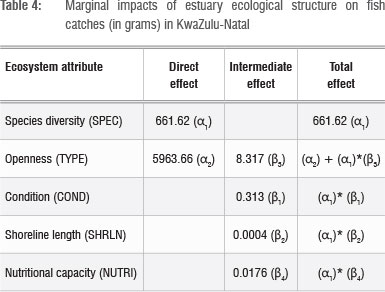
To derive marginal effects of estuarine ecosystem services on fish catches, one should bear in mind the direct and intermediate effects specified in Equations 7 and 8. These are calculated in Table 4, based on parameter estimates given in Table 3. It is clear that the degree of openness and species diversity contribute the most to fish productivity. These estimates can be used to derive shadow values (accounting prices) of the estuary intermediate and regulating ecosystem services at fish catch prices. However, they overestimate the value of the marginal contribution of these services as our model - because of a lack of appropriate corresponding data - does not account for the effect of economic efforts (inputs) on harvest; but these estimates can be used as upper bound estimates.
Conclusions, implications and limitations
We have demonstrated how the production function approach can be used to measure the relationships between fishery activities and the compositional and functional elements of both estuarine and marine ecosystems, and we have used this approach to demonstrate how shadow values (accounting prices) may be estimated for KZN estuarine and marine ecosystems. We used available time-series and cross-sectional data sets that were independently collected on various compositional and functional components of the estuarine and marine ecosystem asset and fish biomass.
A single equation ecological production function has been empirically specified to measure the functional effects of nutrient inputs on fish production in the marine system. In addition, a two-equation system of ecological production functions has been estimated to measure the effects of estuarine ecosystem composition and structure on fish production in the estuary. Using the SURE (Seemingly Unrelated Regression Equations) regression analysis method, the estimated system showed highly significant statistical performance and parameter effects consistent with scientific knowledge. The results provide compelling evidence, expressed in econometric terms, of the importance of estuarine structure and composition on fish biodiversity and production. Ultimately, such results are of great importance to estuarine management, harbour development and planning, and various other coastal sustainable development strategies and policies.
There were, however, limitations to the study as a result of a lack of appropriate data. It is expected that seasonal effects related to, for instance, fish population size and rainfall events would explain a large component of the variation in fish production. The modelling of such relationships requires time-series data sets, which were not available. We also did not have access to appropriate data to control for the effects of economic efforts (e.g. economic inputs) on fish harvesting. Accordingly, we could be overestimating the marginal effects and accounting prices based on the derived estimates of the effects of estuary ecosystem assets structure and composition attributes in computing shadow values of their services.
The results nevertheless hold several important policy implications. They demonstrate, through empirical evidence, how ecological degradation and changes in estuarine and marine ecosystems may indirectly affect a valuable industry. The results provide statistical evidence of the importance of ecological infrastructure and biodiversity for the fish production systems along the KZN coast. As tension between conservation of biodiversity and economic development is expected to increase in future, the need for evidence-based policy decisions will become greater. The current work demonstrates the benefits that could be derived from continued investment in long-term scientific monitoring programmes. It also demonstrates that existing databases may contain useful evidence of relationships between ecological infrastructure and the economy, and that decisions need not always wait for the results of controlled experiments.
The production functions also demonstrate the importance of responsible coastal development initiatives. River impoundments, water pollution, harbour development and other coastal developments are all factors that influence fish production and thus the economy.18,40,41 Future developments should mitigate for their effects on ecosystem services.
This knowledge can also greatly assist policymakers in the issuance of fishing permits. Conventional fisheries models use historical catch records and catch effort data to estimate fish stock sizes and also to control fishing permit conditions. This new knowledge introduces the possibility of using environmental variables as additional predictors of fish stocks. We would like to note, however, that the accentuated response to terrestrial-based nutrients applies only to fish stocks that are located in areas with significant terrestrial run-off into otherwise oligotrophic waters.
Furthermore, elevated spawning does not necessarily mean elevated recruitment. A good spawning could be followed by poor survival of larvae, as their food requirements differ from those of adults; a shortage of suitable food items for early larvae could result in poor survival of recruits.
Finally, a strong correlation between spawning intensity and rainfall-based nutrient input is implied, although not empirically proven. However, this work has demonstrated strong linkages between nutrient levels (using MAR as a proxy) and fish egg abundance and thus enables the investigation of run-off and rainfall-related climate change effects on KZN fisheries.
Acknowledgements
We gratefully acknowledge Dr Allan Connell of the South African Institute for Aquatic Biodiversity for providing data for this study and for his input into various sections of this article. We also acknowledge Prof. Charles Breen and Dr Fred Kruger for their assistance in helping us understand some of the aspects of marine and estuarine biodiversity. We thank Transnet Ltd for their role in initiating this study. We are very grateful to Dr Stanley Liphadzi of the Water Research Commission for the financial support provided for this work.
Authors' contributions
J.C.G. is the primary author and performed the data mining, production function specification and econometric analysis; R.M.H. assisted in writing the manuscript and the econometric analysis.
References
1. Alcamo J, Ash NJ, Butler CD, Callicot JB, Capistrano D, Carpenter SR. Ecosystems and human well-being: A framework for assessment. Washington: Island Press; 2005. [ Links ]
2. Simonit S, Perrings C. Sustainability and the value of the 'regulating' services: Wetlands and water quality in Lake Victoria. Ecol Econ. 2011;70:1189-1199. http://dx.doi.org/10.10167j.ecolecon.2011.01.017 [ Links ]
3. Loreau M, Naeem S, Inchausti P, editors. Biodiversity and ecosystem functioning: Synthesis and perspectives. Oxford: Oxford University Press; 2002. [ Links ]
4. Barbier EB. Valuing ecosystem services as productive inputs. Econ Policy. 2007;22:177-229. http://dx.doi.org/10.1111/j.1468-0327.2007.00174.x [ Links ]
5. Hassan RM, Scholes R, Ash N. Millennium ecosystem assessment -Ecosystems and human well-being: Current state and trends volume 1. Washington: Island Press; 2007. [ Links ]
6. De Groot R, Fisher B, Christie M, Aronson J, Braat L, Gowdy J, et al. Integrating the ecological and economic dimensions in biodiversity and ecosystem service valuation. In: Kumar P, editor. The economics of ecosystems and biodiversity: The ecological and economic foundations. London and Washington: Earthscan; 2010. p. 1-40 Available from: http://www.teebweb.org/publication/the-economics-of-ecosystems-and-biodiversity-teeb-ecological-and-economic-foundations/ [ Links ]
7. Wealth Accounting and the Valuation of Ecosystem Services (WAVES). Annual report 2013. Washington: WAVES; 2013. Available from: http://www.wavespartnership.org/sites/waves/files/images/WAVES-Annual-Report-2013.pdf [ Links ]
8. Dasgupta P. The place of nature in economic development. Beijer Discussion Paper Series No 216. Stockholm: The Beijer Institute of Ecological Economics, The Royal Swedish Academy of Sciences; 2008. Available from: http://www.beijer.kva.se/PDF/1965944_Disc%20216_new.pdf [ Links ]
9. Perrings C. Ecological economics after the Millennium Assessment. Int J Ecol Econ. 2006;6(F06):8-22. [ Links ]
10. Mäler K-G. The production function approach. In: Vincent JR, Crawford EW, Hoehn JP, editors. Valuing environmental benefits in developing countries. Special Report 29. East Lansing, MI: Michigan State University; 1991. p. 11-32. [ Links ]
11. Kinzig A, Perrings C, Scholes RJ. Ecosystem services and the economics of biodiversity conservation. Phoenix, AZ: Arizona State University; 2007. Available at: http://www.public.asu.edu [ Links ]
12. Barbier E. Valuing the environment as input: Review of applications to mangrove-fishery linkages. Ecol Econ. 2000;35(1):47-61. http://dx.doi.org/10.1016/S0921-8009(00)00167-1 [ Links ]
13. Barbier EB. Habitat-fishery linkages and mangrove loss in Thailand. Contemp Econ Policy. 2003;21(1):59-77. http://dx.doi.org/10.1093/cep/21.L59 [ Links ]
14. Barbier EB, Baumgärtner S, Chopra K, Costello C, Duraiappah A, Hassan RM, et al. The valuation of ecosystem services. In: Naeem S, Bunker DE, Hector A, Loreau M, Perrings C. Biodiversity, ecosystem functioning and human wellbeing: An ecological and economic perspective. Oxford: Oxford Scholarship Online; 2009. p. 248-262. http://dx.doi.org/10.1093/acprof:oso/9780199547951.003.0018 [ Links ]
15. Noss R. Indicators for monitoring biodiversity: A hierarchial approach. Conserv Biol. 1990;4(4):355-364. http://dx.doi.org/10.1111/j.1523-1739.1990.tb00309.x [ Links ]
16. Turpie JK, Lamberth SJ. Characteristics and value of the Thukela Banks crustacean and linefish fisheries, and the potential impacts of changes in river flow. Afr J Mar Sci. 2010;32(3):613-624. http://dx.doi.org/10.2989/1814232X.2010.538162 [ Links ]
17. Van der Elst R. Shelf ichthyofauna of Natal. In: Schuman EH. Coastal ocean studies off Natal, South Africa. New York: Springer-Verlag; 1988. p. 209-225. http://dx.doi.org/10.1029/LN026p0209 [ Links ]
18. Weerts SP Cyrus DP Occurrence of young and small-sized fishes in different habitats within a subtropical South African estuary and adjacent harbour. Mar Freshw Res. 2002;53:447-456. http://dx.doi.org/10.1071/MF01155 [ Links ]
19. Connell AD. A 21-year ichthyoplankton collection confirms sardine spawning in KwaZulu-Natal waters. Afr J Mar Sci. 2010;32:331-336. http://dx.doi.org/10.2989/1814232X.2010.502638 [ Links ]
20. McGrath MD, Horner CCM, Brouwer SL, Lamberth SJ, Mann BQ, Sauer WHH. An economic valuation of the South African linefishery. S Afr J Mar Sci. 1997;18(1):203-211. http://dx.doi.org/10.2989/025776197784161171 [ Links ]
21. Mann BQ, James NC, Beckley LE. An assessment of the recreational fishery in the St Lucia estuarine system, KwaZulu-Natal, South Africa. S Afr J Mar Sci. 2002;24(1):263-279. http://dx.doi.org/10.2989/025776102784528330 [ Links ]
22. Lamberth SJ, Turpie JK. The role of estuaries in South African fisheries: Economic importance and management implications. Afr J Mar Sci. 2003;25(1):131-157. http://dx.doi.org/10.2989/18142320309504005 [ Links ]
23. Crafford JG, Kruger FK, Harris KR, Ginsburg AE. Comparative environmental-and-resource-economics evaluation of the ecosystem services of the Durban Bay. Johannesburg: Transnet Ltd; 2007. [ Links ]
24. Connell A. Marine fish eggs and larvae from the east coast of South Africa [homepage on the Internet]. c2007 [cited 2010 May 31]. Available from: http://www.fisheggsandlarvae.com/ [ Links ]
25. Weerts SP, Cilliers G, Cyrus DP. Estuarine macrocrustacea of Richards Bay Harbour, South Africa, with particular reference to the penaeid prawns. Afr Zool. 2003;38(2):285-296. [ Links ]
26. Whitfield AK. Biology and ecology of fishes in southern African estuaries. Ichthyological monographs of the J.L.B. Smith Institute of ichthyology 2. Grahamstown: Rhodes University; 1998. [ Links ]
27. Lamberth SJ, Turpie JK. The role of estuaries in South African fisheries: Economic importance and management implications. Afr J Mar Sci. 2003;25:131-157. http://dx.doi.org/10.2989/18142320309504005 [ Links ]
28. Gillanders BM, Kingsford MJ. Impact of changes in flow of freshwater on estuarine and open coastal habitats and the associated organisms. Oceanogr Mar Biol Annu Rev. 2002;40:233-309. http://dx.doi.org/10.1201/9780203180594.ch5 [ Links ]
29. Van Ballegooyen RC, Van Niekerk L, Lamberth SJ, Weerts S, Taljaard S. Freshwater requirements of the coastal and offshore marine environment of South Africa: An overview and initial assessment. CSIR report ENV-S-C. Stellenbosch: CSIR; 2005. [ Links ]
30. Lamberth SJ, Drapeau L, Branch GM. The effects of altered freshwater inflows on catch rates of non-estuarine-dependent fish in a multispecies nearshore linefishery. Estuar Coast Shelf S. 2009;84(4):527-538. http://dx.doi.org/10.1016/j.ecss.2009.07.021 [ Links ]
31. Cooper A, Wright I, Mason T. Geomorphology and sedimentology. In: Allanson BR, Baird D, editors. Estuaries of South Africa. Cambridge: Cambridge University Press; 1999. p. 5-25. http://dx.doi.org/10.1017/CBO9780511525490.002 [ Links ]
32. Begg GW. The estuaries of Natal. Report vol. 41. Pietermaritzburg: Natal Town and Regional Planning Commission; 1978. [ Links ]
33. Begg GW. The estuaries of Natal Part 2. Report vol. 55. Supplement to NTRP report vol. 41. Pietermaritzburg: Natal Town and Regional Planning Commission; 1984. [ Links ]
34. Harrison TD, Whitfield AK. A multi-metric fish index to assess the environmental condition of estuaries. J Fish Biol. 2004;44(3):683-710. http://dx.doi.org/10.1111/j.0022-1112.2004.00477.x [ Links ]
35. Scheiner SM. Six types of species-area curves. Global Ecol Biogeogr. 2003;12:441-447. http://dx.doi.org/10.1046/j.1466-822X.2003.00061.x [ Links ]
36. Harrison TD, Cooper JAG, Ramm AEL. State of South African estuaries: Geomorphology, ichthyofauna, water quality and aesthetics. State of the Environment Series report no. 2. Pretoria: Department of Environmental Affairs and Tourism; 2000. [ Links ]
37. Chambers PA, Culp JM, Glozier NE, Cash KJ, Wrona FJ, Noton L. Northern rivers ecosystem initiative: Nutrients and dissolved oxygen - issues and impacts. Env Monit Assess. 2006;113:117-141. http://dx.doi.org/10.1007/s10661-005-9099-z [ Links ]
38. Whitfield AK. A characterisation of southern African estuarine systems. S Afr J Aquat Sci. 1992;12:89-103. [ Links ]
39. Johnston J. Econometric methods. New York: McGraw Hill; 1984. [ Links ]
40. Forbes AT, Demetriades NT, Cyrus DP. Biological significance of harbours as coastal habitats in KwaZulu-Natal, South Africa. Aquat Conserv. 1996;6:331-341. http://dx.doi.org/10.1002/(SICI)1099-0755(199612)6:4<331::AID-AQC198>3.0.CO;2-C [ Links ]
41. Weerts SP, Cilliers G, Cyrus DP. Estuarine macrocrustacea of Richards Bay Harbour, South Africa, with particular reference to the penaeid prawns. Afr J Zool. 2003;38:285-296. [ Links ]
 Correspondence:
Jackie Crafford
Prime Africa, PO Box 433
Garsfontein 0042, South Africa
j.crafford@primeafrica.net
Received: 09 May 2013
Revised: 17 Dec. 2013
Accepted: 29 Dec. 2013


