


Servicios Personalizados
Articulo
 Inglés (pdf)
 Articulo en XML
 Referencias del artículo
Indicadores

Links relacionados
-
 Citado por Google
 -
 Similares en Google
Compartir

 Permalink
South African Journal of Science
versión On-line ISSN 1996-7489
versión impresa ISSN 0038-2353
S. Afr. j. sci. vol.110 no.5-6 Pretoria mar. 2014
RESEARCH ARTICLE
Modelling new particle formation events in the South African savannah
Rosa T. GierensI; Lauri LaaksoII, III; Ditte MogensenI; Ville VakkariI; Johan P BeukesIII; Pieter G. van ZylIII; Hannele HakolaII; Alex GuentherIV, V; Jacobus J. PienaarIII; Michael BoyI
IDepartment of Physics, Helsinki University, Helsinki, Finland
IIResearch and Development, Finnish Meteorological Institute, Helsinki, Finland
IIIUnit for Environmental Sciences and Management, North-West University, Potchefstroom, South Africa
IVPacific Northwest National Laboratory, Richland, Washington, USA
VWashington State University, Pullman, Washington, USA
ABSTRACT
Africa is one of the less studied continents with respect to atmospheric aerosols. Savannahs are complex dynamic systems sensitive to climate and land-use changes, but the interaction of these systems with the atmosphere is not well understood. Atmospheric particles, called aerosols, affect the climate on regional and global scales, and are an important factor in air quality. In this study, measurements from a relatively clean savannah environment in South Africa were used to model new particle formation and growth. There already are some combined long-term measurements of trace gas concentrations together with aerosol and meteorological variables available, but to our knowledge this is the first detailed simulation that includes all the main processes relevant to particle formation. The results show that both of the particle formation mechanisms investigated overestimated the dependency of the formation rates on sulphuric acid. From the two particle formation mechanisms tested in this work, the approach that included low volatile organic compounds to the particle formation process was more accurate in describing the nucleation events than the approach that did not. To obtain a reliable estimate of aerosol concentration in simulations for larger scales, nucleation mechanisms would need to include organic compounds, at least in southern Africa. This work is the first step in developing a more comprehensive new particle formation model applicable to the unique environment in southern Africa. Such a model will assist in better understanding and predicting new particle formation - knowledge which could ultimately be used to mitigate impacts of climate change and air quality.
Keywords: atmospheric modelling; aerosols; nucleation; boundary layer; savannah
Introduction
Savannahs are highly dynamic systems covering an area of approximately 16 x 106 km2, or 11.5% of the global land surface. They are sensitive to climate and land-use alterations, which can lead to fast changes in biomass and soil properties.1 These areas lie mostly in the developing world where vast land-use changes take place.2 Savannahs affect the regional and global climate, but the interactions between the biosphere and the atmosphere have not undergone intense investigation and are therefore still not well understood.3 In order to understand the global climate, it therefore is important to study the savannah environment.
Aerosols modify the climate directly by affecting the Earth's radiative budget by scattering and absorbing solar radiation, as well as indirectly by acting as cloud condensation nuclei and thereby changing the properties of the clouds, which again alter the radiation budget. According to recent studies based on global modelling and observations, new particle formation contributes to these aerosol effects.4-8 In addition to the climate impacts, aerosols are an important factor for air quality and thus influence human health. In developed countries, strong measures have been taken to improve air quality, but in the developing world aerosols harm the health of hundreds of millions of people.9
Africa is one of the less studied continents with regard to atmospheric aerosols both from a measurement and a modelling point of view. Biomass burning is a significant source of aerosols in Africa, but previous studies have shown that there are also several other sources.10 A few modelling studies using regional and global models have investigated South Africa,11,12 but none have used detailed chemistry and aerosol dynamics. In this case study, we used measurements conducted at a semi-clean savannah site in South Africa to simulate new particle formation and growth. The measurements were carried out with a transportable measurement trailer.13 The observations were used as input to the model to constrain the result. The model used in this work was MALTE (Model to predict new Aerosol formation in the Lower TropospherE).14,15 Our aim was to investigate the processes creating secondary organic aerosols and explore what factors are important for the growth of these aerosols, especially in southern Africa. Furthermore, we wanted to test the model in a savannah environment, which is very different from the boreal forest ecosystem that the model was developed for. In addition to being a method to enhance our understanding of the processes studied, modelling also allows one to extrapolate to places without measurements. The reliability of such extrapolated results will obviously depend on knowledge of the local conditions. Therefore modelling is a useful tool for compensating when measurements are sparse, such as for areas like southern Africa.
Methods
Site characteristics
The measurements were conducted at a station in the Botsalano Game Reserve (located at 25.54°S and 25.75°E, 1400 m above sea level) in the North West Province of South Africa. Botsalano is located 50 km north of the nearest city, Mafikeng, which has a population of 260 000, and approximately 100 km south of Gaborone (population 200 000), the capital of Botswana. The mining and metallurgical region in the vicinity of the cities of Rustenburg and Brits in the Western Bushveld Indigenous Complex,16 which is one of the largest regional pollution sources, is located approximately 150 km east of Botsalano. This area is a platinum group mineral, chromium and base metal mining and metallurgical extraction region, which results in enhanced SO2 and associated sulphate emissions. Otherwise, the nearby region east of Botsalano is quite sparsely populated. The Johannesburg-Pretoria megacity, with more than 10 million inhabitants and heavy industry, is located 300 km east to southeast of the site.17 There are some small cities and industry in the region, but the area west and south of Botsalano has few anthropogenic activities. There are some small local pollutant sources such as traffic and biomass burning. Considering all the aforementioned, Botsalano can be considered to be representative of a semi-clean background site, with occasional higher pollutant concentrations associated with easterly winds.18,19 The location of Botsalano and surroundings is shown in Figure 1 and a detailed description of the site is given by Laakso et al.10
The Botsalano Game Reserve is located in dry bushveld, with a fairly homogeneous vegetation of grass and thin tree stands.10 The dominant trees and shrubs are mostly Acacia, Rhus, Ziziphus, Vitex and Grewia, which are typical for a savannah biome. There is also different grass and herbaceous species. The height of the canopy is approximately 8 m. Animals roam freely through the reserve. The large-scale meteorology is characterised by a high degree of stability and anticyclonic circulation taking place more than 50% of the time year-round.20 As a result of the high stability, the vertical mixing is limited and thus creates situations where air masses are contaminated either by industrial sources or by biomass burning.21 Re-circulation occurs on regional and sub-continental scales and often in the order of several days.20 New particle formation events occurred on 69% of the days when measurements were taken, which is a relatively high frequency for continental boundary layer conditions, and only 6% of the days showed clearly no signs of new particle formation.18
Measurements
The measurements were made with a mobile measurement trailer. The trailer is aimed to be a self-sufficient and mobile monitoring station requiring only three-phase power and periodic maintenance of the instruments. In addition to measuring instruments, the trailer is equipped with a GPRS modem, so that data can be automatically, and wirelessly, copied to a server, enabling remote monitoring of data quality. A detailed description of the trailer is given by Petäjä et al.13 During the measurement period described here (July 2007 - January 2008), the trailer was not moved. All data were quality controlled for unreliable measurements, which occurred mostly as a result of frequent electricity breaks.10
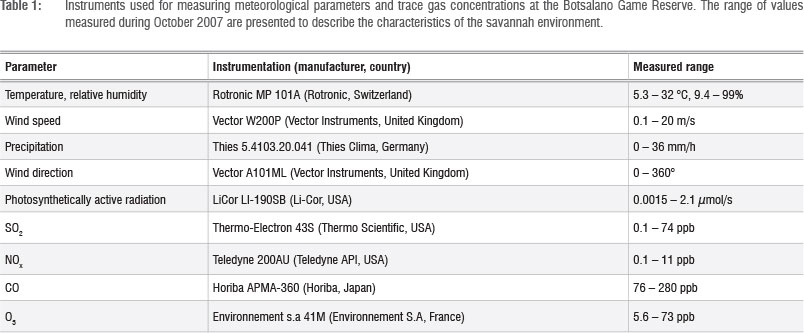
For measuring the particle number distribution, a differential mobility particle sizer was used with a size range from 10 nm to 840 nm and a time resolution of 7.5 min. The meteorological instruments were mounted on a mast located on the roof of the trailer at a height of 3.7 m above the ground. The meteorological parameters together with trace gas concentrations were logged at a time resolution of 1 min. The measured parameters, together with the instruments used, are shown in Table 1. The gas concentration data were corrected based on on-site calibrations. Volatile organic compound (VOC) measurements were conducted using adsorbent tubes filled with Tenax-TA and Carbopack-B with a sampling time of 2 h. The samples were analysed using a thermodesorption instrument (Perkin-Elmer TurboMatrix 650) attached to a gas chromatograph (Perkin-Elmer Clarus 600) and a mass selective detector (Perkin-Elmer Clarus 600T). The column used was a DB-5MS (60 m, 0.25 mm, 1 jm) column. The sample tubes were desorbed at 300 °C for 5 min and cryofocused in a Tenax cold trap (-30 °C) prior to injecting the sample into the column by rapidly heating the cold trap (40 °C/min) to 300 °C. A five-point calibration was conducted using liquid standards in methanol solutions. Standard solutions were injected onto adsorbent tubes and flushed with nitrogen flow for 5 min in order to remove methanol. The VOC sampling system did not include ozone removal and therefore the VOC mixing ratios may be considered as the lower limits only for the ozone reactive compounds such as monoterpenes and isoprene. VOC measurements were made only intermittently, which had to be taken into account when selecting the days to be studied.
Days selected
We chose 6 days (7-10 and 14-15 October 2007) during the local spring; each day had different characteristics with respect to trace gas and particle concentrations. This period coincided with the beginning of the growing season. On these days, the temperature varied between a night-time low of 5 °C and a daytime maximum of 32 °C, and the relative humidity from 9% to 99%. The predominant wind direction was from the north, but various directions were observed (Table 1). There was a nucleation event during all of the studied days, which included days with clean background air as well as higher pollutant concentrations. Most of the days were sunny, and rain occurred only once during the evaluated period.
Model description
MALTE is a one-dimensional model that simulates new particle formation and growth in the lower troposphere, from the surface up to 3 km above the ground, covering the entire boundary layer. It includes modules for the boundary layer meteorology, chemical and aerosol dynamic processes, and for emissions from the canopy.14 In this study we used a further developed version, in which the one-dimensional version of the model SCADIS is used to improve the meteorology scheme.15 This modification was made to improve the estimates of vertical turbulent fluxes of heat, moisture and scalars.
MALTE has a flexible number of vertical layers. The layer height increases logarithmically from the ground upwards, such that the resolution is highest near the ground. A total of 51 layers from the ground to a height of 3000 m were chosen for this study, with 14 of the layers located inside the canopy (lowest 8 m). Based on meteorological conditions at each level, the detailed chemical and aerosol dynamic processes were solved. Meteorology, emissions, chemistry and aerosols were combined with a split-operator approach: the meteorological conditions, as well as fluxes of particles and gases, were calculated with a 10-s time step for 60 s. Afterwards, emissions from the canopy, chemical reactions and aerosol dynamic processes at every atmospheric layer were solved with a time step of 60 s. Then the meteorological module started again and the process continued. From the meteorological model point of view, changes in the gas phase and in particle concentrations appeared instantly after each minute.15
Boundary layer meteorology
For the boundary layer processes, the one-dimensional version of the model SCADIS (scalar distribution) was applied. A detailed description of the model is given by Sogachev et al.22-24 This part of the model solves the meteorological conditions in and above the atmospheric boundary layer, the vertical transport by turbulence, as well as the interactions with and within the canopy. SCADIS includes a set of equations for momentum, continuity, heat, humidity and transport of a passive tracer. For solving the turbulent fluxes, the one-and-a-half order closure is applied. The canopy is described with multiple layers. SCADIS includes parameterisations for drag forces of leaves and for radiation transfer, distinguishing between sunlit and shaded leaf area, and thus aims to properly describe interactions between vegetative canopy and the atmosphere. In the model, a horizontally homogenous vegetation canopy is assumed. Penetration of solar radiation inside the canopy was calculated based on the leaf area index, and gave the average radiation flux at each level. In a bushy area like Botsalano, this was a challenging approach. Because of the one-dimensional nature of the model, there is no separation between the area between the trees and 'inside' the trees. From the model point of view, the canopy was treated as if it were horizontally homogenous with very sparse foliage. Prognostic equations for soil moisture were also included.
Emissions from the canopy
Isoprene and monoterpene emission rates have been reported for many important savannah woody (tree and shrub) genera in southern Africa including the dominant genera at Botsalano Game Reserve.25-28 In contrast, there are few measurements of biogenic emissions from herbaceous savannah vegetation. These species are generally assumed to make a negligible contribution to the total biogenic VOC flux, but this assumption could result in underestimated emissions. The five dominant woody genera at Botsalano include one with high isoprene and monoterpene emissions (Rhus), one low monoterpene emitter (Grewia) and two very low emitters (Vitex and Ziziphus). The fifth genera, Acacia, is more diverse and includes high isoprene emitters (e.g. A. nigrescens and A. polycantha), high monoterpene emitters (e.g. A. tortilis) and species with low emissions of both (e.g. A. nilotica).25,28 In this context, the leaf level emission rate categories are based on the definitions of Guenther et al.29 The isoprene emission classification comprises high (>14 µg/(g h)), low (0.1 to 14 µg/(g h)) and very low (<0.1 µg/(g h)). The classes for monoterpenes are high (>1.6 mg/(g h)), low (0.1 to 1.6 µg/(g h)) and very low (<0.1 µg/(g h)).29 The high variability of the woody covered fraction and the diversity of high and low emitters results in very different emission rates from the various savannah landscapes. Otter et al.26 combined a regional database of plant species composition and isoprene and monoterpene emission rates to estimate biogenic emission rates from land-cover types in southern Africa. They found a large range in isoprene (<1 to >13 g/m2 per year) and monoterpene (<0.5 to >5 g/m2 per year) emission rates for different southern African savannahs.
Emissions of isoprene, monoterpenes and other VOCs from the canopy were calculated with the model MEGAN (Model of Emissions of Gases and Aerosols from Nature).30,31 The compounds included were: isoprene, 2-methyl-3-buten-2-ol, ß-pinene, a-pinene, methanol, acetone, acetaldehyde, formaldehyde, formic acid, acetic acid, methane, sabinene, Δ3-carene, myrcene, limonene, trans-ß-ocimene, ß-caryophyllene, α-farnescene, 'other monoterpenes' (for those not mentioned here) and 'other sesquiterpenes' (for those not mentioned here). The isoprene and monoterpene emission factors used for this simulation are based on the estimates by Otter et al.26 for the savannah type located at the Botsalano Game Reserve. The emission rates for all other compounds are based on the emission factors recommended by Guenther et al.31 The emission rates depend also on leaf temperature and available solar radiation for leaves in the sun and shade, which are calculated separately for every model level inside the canopy. No anthropogenic VOC sources were included in the model.
Gas phase chemistry
The gas phase concentrations of all compounds were calculated for every model time step by the Kinetic PreProcessor.32 In total, 770 chemical species and 2148 chemical and photochemical reactions chosen from the Master Chemical Mechanism (MCM) version 3.2 33,34 via http://mcm.leeds.ac.uk./MCM/ were included for the model runs. These numbers include atmospherically relevant inorganic compounds and reactions together with the full oxidation chemistry paths for isoprene, 2-methyl-3-buten-2-ol, ß-pinene, a-pinene, methanol, acetone, acetaldehyde, formaldehyde, formic acid, acetic acid and methane. We also included first-order oxidation reactions among ●OH, O3, NO3● and the following organic compounds: sabinene, Δ3-carene, myrcene, limonene, ocimene (to simulate the chemistry of trans-ß-ocimene), 'other monoterpenes' (those not mentioned here), ß-caryophyllene, farnesene (to simulate the chemistry of a-farnescene), and 'other sesquiterpenes' (other than the two mentioned here). The full chemistry paths for these compounds (we are referring to the following compounds: sabinene, Δ3-carene, myrcene, ocimene, 'other monoterpenes', farnesene, and 'other sesquiterpenes') are not included, as they are unknown and not provided by MCM. In the case of limonene and ß-caryophyllene, for which the full near-explicit MCM chemistries are available, we chose not to include them because of computational costs; limonene and ß-caryophyllene comprise 539 and 591 compounds, respectively, and MALTE is not written in parallel. Furthermore, as the predicted emissions of limonene and ß-caryophyllene are relatively low compared with, especially, a-pinene and ß-pinene, it is reasonable to exclude the chemistry of these minor components.
Aerosol dynamics
We used the size-segregated aerosol dynamics model UHMA (University of Helsinki Multicomponent Aerosol model)35 to simulate the aerosol dynamic processes occurring in our study. UHMA describes in detail new particle formation and growth, including both particle coagulation and multicomponent condensation. The fixed-sectional method with 38 size bins was applied to represent particle size distributions. The model has an option to include several different nucleation mechanisms. We first used kinetic nucleation,36 in which critical clusters are formed by collisions of sulphuric acid molecules (H2SO4) or other molecules containing sulphuric acid. The nucleation rate Jkin is calculated by

where K is the kinetic coefficient that contains details of the nucleation process, such as the probability of a collision of two molecules containing sulphuric acid resulting in the formation of a stable critical cluster.
It has been suggested that gases other than sulphuric acid participate in the nucleation process; for example ammonia or low volatile organic vapours might play a role.37,38 The second nucleation mechanism used in this work assumes the formation of stable critical clusters by collision of sulphuric acid or a molecule containing sulphuric acid and a low volatile organic compound. The nucleation rate Jorg is calculated in the same way as by Lauros et al.15:

where [Corg] represents the concentration of low volatile organic gases (in the model these are the first stable reaction products of a-pinene, ß-pinene and isoprene with OH), u is the collision rate of the molecules and the coefficient P contains details about the nucleation process, similarly as for K in Equation 1.
The newly formed nanosize clusters grow by condensation of sulphuric acid and low volatile organic compounds (Corg alike as in nucleation)14 following the nano-Köhler theory.39 For particles reaching a size of a few nanometres, sulphuric acid and the first stable reaction products of a-pinene, ß-pinene and isoprene generated by reactions with •OH, O3 and NO3• participate in the growth of the particles. Oxidation products from a-pinene, ß-pinene and isoprene reactions were chosen to represent the oxidation products of the VOCs, as there is no currently available method in MALTE to estimate saturation vapour pressure. Other monoterpenes (myrcene, sabinene, limonene, Δ3-carene and ocimene) and sesquiterpenes (farnescene and ß-caryophylllene) were not chosen, because full chemistry for these compounds was not included. For the remaining organic compounds, we predicted concentrations that are too low and expected saturation vapour pressures that are too high for these compounds to make a significant condensation contribution. We scaled the concentration of condensing vapours by taking a fraction of 0.05 of the abovementioned compounds gas phase concentrations based on measurement fit.
The model calculates dry deposition for newly formed particles as well as deposition to the canopy. Because MALTE does not simulate the formation of clouds or precipitation, wet deposition was not included.
Model set-up
All measured meteorological parameters were used in the model. Temperature, absolute humidity and wind speed were used for nudging with a factor of 0.1. In this way we were able to simulate the meteorological conditions in the model more closely to the observations, which allowed some of the effects of synoptic scale weather phenomena to be included. Upper boundary values for temperature, humidity and wind speed are required in order to simulate the vertical profiles. Because of the non-existence of soundings in the region of Botsalano, the values from the ERA-Interim reanalysis40 provided by the European Centre for Medium-Range Weather Forecasts (ECMWF) were used.
The simulation of emissions from the canopy depends on the standard emission potentials, which in this study were based on the measurements reported in the literature.25,26,28 In the beginning of the simulation the concentrations of all emitted gases and their reaction products were set to zero. For this reason the model run was started one day prior to the studied days, so that the concentrations could accumulate and the chemistry related to these species could stabilise.
From the measured trace gas (O3, SO2, NO, NOx, and CO) concentrations, 15-min averages were calculated and used as input to the model. Data points with concentrations below zero (caused by measurement error) were set to the detection limit of the instruments. For periods of missing data, gap filling was applied (that is, concentrations for missing data points were calculated based on the gradients at the same time on the previous and following days). Every midnight, the particle number concentration in each size bin in the model was set to the measured concentration in order to initialise each study day and to correct the background aerosol concentrations. For the initialisation, the boundary layer was assumed to have a constant concentration and a height of 300 m. Above the boundary layer the concentration was set to 20% of that inside the boundary layer, reflecting the dilution of background aerosol loading in the residual layer.
Results and discussion
Meteorological conditions
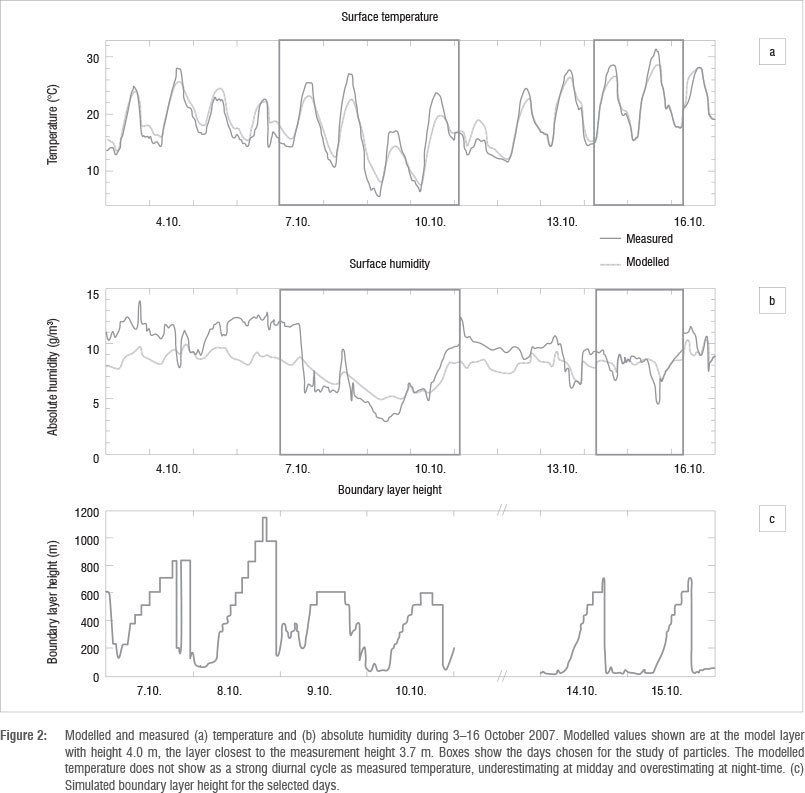
The meteorological conditions were evaluated for a 2-week period, including the days selected. The model reproduced the measured temperature well most of the time, but during the warmest hours of midday the model underestimated the measured temperature by 3-5 °C on two out of three days simulated (Figure 2). Almost as common, but less extreme, was the overestimation during the night, which did not exceed 2.6 °C. The model provided an average temperature of the area - both in and out of shade - but the measurements were taken at one location that was not shaded by the canopy. If this approach explained the underestimated daytime temperatures, the difference would not be present above the canopy. The temperatures produced by the model at 10 m were the same as those at 4 m, except for some nights with strong vertical gradients. Even if there were no measurements made above the canopy, it is unlikely that any known physical process caused by the sparse vegetation would have had such a strong effect that the model could not recognise. Therefore the temperatures underestimated by the model are not merely a consequence of inclusion of the model values representing shaded areas. Furthermore, as seen from the middle panel in Figure 2, the simulated absolute humidity was underestimated for most of the studied period. These two issues might be connected, as an underestimation of temperature leads to an underestimation of evaporation, which results in a too low concentration of water vapour in the air. One significant factor affecting the temperature near the surface is the boundary values given for the upper boundary at 3000 m. We investigated the effects of errors in the upper boundary values by altering the upper boundary temperature and found that errors in this temperature can only partly explain the underestimated surface temperature. Another reason for the underestimated midday temperature might be errors in the albedo, the ground heat capacity, or the heat flux from the ground, none of which have been measured in the area and can thus not be validated. These effects could also explain the overestimated temperatures modelled for some nights. All of the explanations mentioned, except the upper boundary values, play a role in the energy balance, which, according to Grote et al.3, is poorly understood in savannah ecosystems.
For the vertical mixing of particles, the amount of turbulence and the height of the boundary layer are important. The atmospheric boundary layer is well mixed, but transportation from the boundary layer to the free atmosphere is weak. Figure 2 shows the daily evolution of the atmospheric boundary layer. The night-time boundary layer, in particular, was shallow, which was caused by strong stable stratification typical of the region. The sudden downward peak during the late hours on 7 October was caused by numerical instability in the model41. Lauros et al.15 compared the vertical profiles of the model to measurements made by radiosonde soundings, and stated that the model suggested a too high level of stability and too weak mixing. As the sub-continental conditions in Botsalano are very stable, we cannot make the same conclusion without comparison with measurements. The night-time boundary layer on the last 2 days was very shallow (below 100 m). Turbulent kinetic energy indicates the effectiveness of turbulent mixing. During the last 3 nights, turbulent kinetic energy was approximately zero, indicating that, based on the model, no vertical mixing of particles or gases took place. This scenario leads to high concentrations near ground level for compounds with sources inside the canopy. We therefore need to consider these high levels of stability during the last 2 nights when evaluating the gas and particle concentrations.
Gas phase concentration
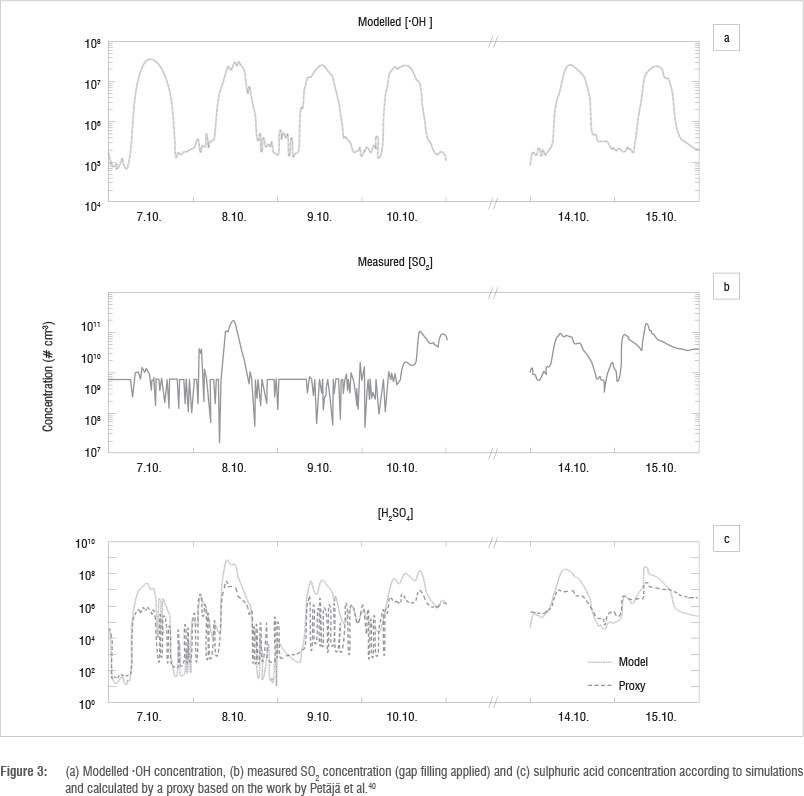
For particle formation and growth, a good estimate of the sulphuric acid concentration is essential. Sulphuric acid is traditionally thought to be produced by •OH oxidation of SO2. Therefore it is important to consider these compounds when evaluating the model's ability to predict the sulphuric acid concentration. Modelled "OH concentration (a), measured SO2 concentration (b) and modelled sulphuric acid concentration together with an estimate of the sulphuric acid concentration based on the sulphuric acid proxy (c) are presented in Figure 3. The sulphuric acid proxy was calculated as
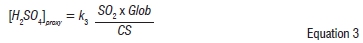
where k3 = 1.4 x 10⁷ x Glob0,70, Glob is the global radiation, and CS is the condensation sink as given by Petäjä et al.42 This method was used by Vakkari and co-workers18 to estimate the measured sulphuric acid concentrations in Botsalano, and is shown here to provide comparison with their work. As expected, "OH showed a clear diurnal cycle, which also reflected the sulphuric acid concentration pattern. Large fluctuations of the sulphuric acid proxy were especially pronounced on 9 October as a result of relatively large variations in low SO2 concentrations. The simulated sulphuric acid concentration was higher (in the order of 108 cm-3) than measurements from other sites42; compared with the sulphuric acid proxy, we generally seem to overestimate the concentration. Occasional higher concentrations of sulphuric acid seem to be related to the high concentrations of SO2 caused by advection. However, no sulphuric acid concentration measurements exist at this station or anywhere close by and our model simulations show good agreement between measured and modelled sulphuric acid concentration for another station.14 We made sensitivity runs with doubled emission rates for the organic compounds (similar to Boy et al.43), which decreased the "OH concentration and thereby decreased the sulphuric acid concentration. However, we did not observe a significant decrease in the sulphuric acid concentration and because we do not have any "OH concentration measurements to compare with, we chose to use the original modelled sulphuric acid concentrations for simulations of aerosol formation and growth in the next section.
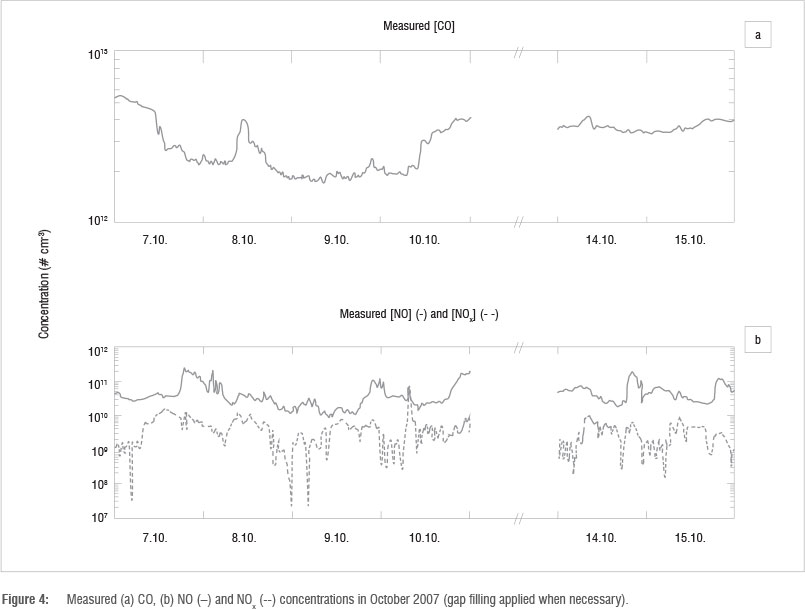
For completion, we also present the measured concentrations of CO (a), NO and NO2 (b) in Figure 4. Increased concentrations of CO (and SO2) are usually an indication for pollution events. In Botsalano, this pollution is observed especially when the wind blows from a southeasterly direction. Such peaks are seen on 8 October and 10 October, with a twofold higher CO concentration and 10-20-fold higher SO2 concentrations compared with the times in-between. During 14 and 15 October, there seem to be different air masses present because the trace gas concentrations, as well as the particle number distribution, clearly vary (see 'Particles'). On these days, the wind blew from all directions, not only a southeasterly direction.
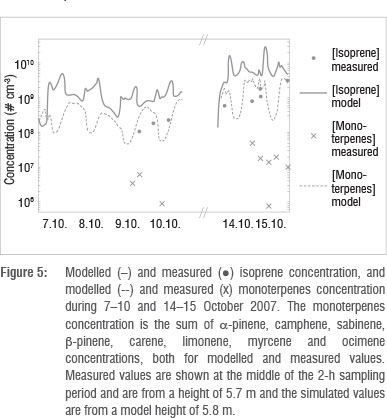
Other important vapours participating in the growth of the particles are low volatile organic compounds. Only limited VOC measurements were available during four of the selected days, and the concentrations were mostly below the detection limit. Measured and modelled concentrations of isoprene and the sum of monoterpenes (a-pinene, camphene, sabinene, ß-pinene, Δ3-carene and limonene) are visualised in Figure 5. The measured values (dots and crosses) are from a 5.7-m sampling height and in the figure are shown at the middle of the 2-h sampling period. The emission rate of isoprene was highest during daytime because the emission of isoprene is driven by light- and temperature-dependent enzymatic synthesis. Shortly after the emission starts to increase, the boundary layer begins to develop as a result of radiative heating of the surface. Emitted gases are then mixed in a larger volume of air, which lowers the gas concentration. The maximum isoprene concentrations are therefore found in the morning and in the evening. In the case of the monoterpenes, the mixing conditions dominate over the emission rate, leading to higher concentrations during the night than during the day; this pattern has been observed at other sites44. The stable nights during 14-15 October resulted in especially high concentrations for both isoprene and the monoterpenes. The measured concentrations of isoprene are one order of magnitude lower and the measured monoterpene concentrations are up to two orders of magnitude lower than what the model predicted. In part, this may be a result of differences in the emission factors or the plant species composition data between the regional model and the Botsalano site. The sum of the measured monoterpenes is calculated based on samples of individual monoterpenes. However, the low observed values seem to be because of the lack of ozone removal in the sampled air. Very recent data by Jaars45 for the Welgegund measurement site in South Africa that lies close to the ecotone of the grassland and savannah biomes, indicated that monthly median isoprene and monoterpene concentrations vary between 2.4 x 10⁸ to 1.25 x 109 cm-3 and 2.4 x 10⁸ to 3.1 x 109 cm-3, respectively. These values were obtained by utilising ozone removal prior to sampling, as suggested by Hellen et al.46, and are much closer to the modelled values than the measured values reported in this paper. Because of the level of uncertainty in the measurements, we therefore cannot make any solid conclusions on the reliability of the model based on this comparison.
The modelled concentrations of the first stable reaction products of a-pinene, ß-pinene and isoprene with "OH, O3 and NO3", which in the simulations are forming and growing the particles, are shown in Figure 6. The low level of mixing, together with the higher concentrations of monoterpenes (Figure 5), is reflected in the high concentrations of the reaction products during the last 2 days. The concentrations of the reaction products generated from monoterpene and isoprene reactions with "OH (dotted line) and O3 (dashed line), showed similar behaviour to those previously described for isoprene - a high formation rate during the day but, with effective mixing, the concentration decreased or did not continue to increase. The reaction products generated from monoterpene and isoprene reactions with NO3" (solid line) showed diurnal cycles driven by the vertical mixing. This process caused the concentration to be higher if the surface layer was very stable, which was the case during the last 2 days (14-15 October), especially during the night. The stable stratification also leads to strong vertical gradients, as the VOCs are emitted in the canopy.
Particles
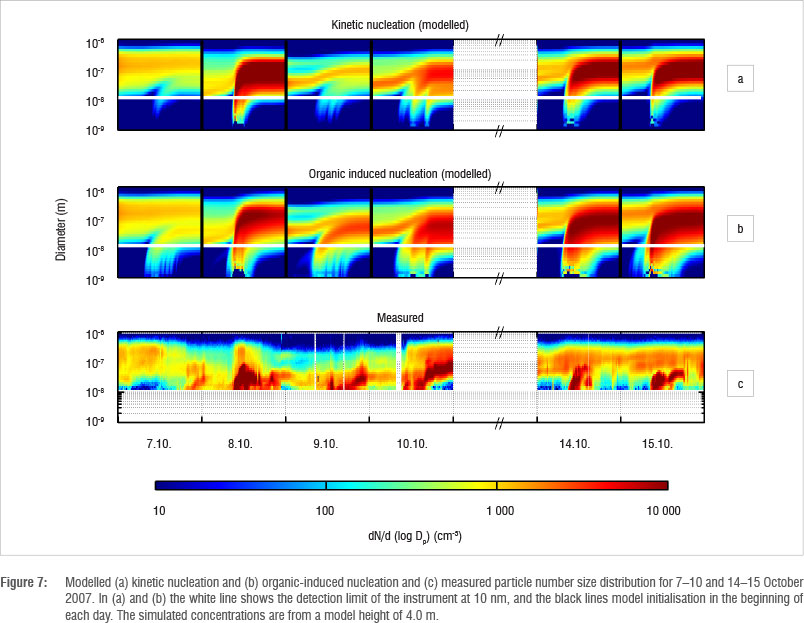
The ability of the two selected nucleation mechanisms - kinetic and organic-induced nucleation - to reproduce the observed number concentration of particles was evaluated by holding the nucleation coefficients K (in Equation 1) and P (in Equation 2) constant for all simulated days. The modelled events, together with the observations, are shown in Figure 7. To allow more detailed comparison, the formation rate of 10-nm particles (J10) and the growth rate for 10-20-nm particles were calculated from observations and both simulations for each day (Table 2).
On the first day (7 October 2007) the measurements showed an increasing concentration of nucleation mode particles at approximately 18:00 (Figure 7). A sudden decrease in the concentration of Aitken mode particles in the middle of the day can also be seen, probably as a result of a different type of air mass being advected to the site. The formation rate of the particles was the lowest observed in the studied period (Table 2), which, together with the high concentrations of Aitken mode particles for the first half of the day, could have lead to the late beginning of the observed event: in the morning the few newly formed particles were coagulating on bigger particles (which had a high concentration), and when the background aerosol loading decreased, it allowed for the newly formed particles to start growing and reach the size at which they could be observed (10 nm), later than on the other days. This change of air mass cannot be accounted for in the model, and therefore this effect is not seen in the results of the simulations. Both nucleation approaches also led to particle formation in the simulations, only much earlier on the day (Figure 7, Table 2). The values for growth rate agree well with those observed, but kinetic nucleation underestimated J10 by an order of magnitude.
On 8 October, strong advection of SO2 was observed within the measurements, leading to a high sulphuric acid concentration (Figure 3), and thereby causing a high rate of particle formation (Table 2). The simulations also show relatively high formation rates at 10 nm, although lower than observed. The growth rate was overestimated by the model. The results on 9 October are similar to those on 7 October - low sulphuric acid and a good agreement with both J10 and growth rate, except for the kinetic nucleation approach that underestimated the formation rate. The daytime sulphuric acid concentration was the lowest during these 2 days, and as kinetic nucleation assumes particle formation from sulphuric acid, it is to be expected that this approach is sensitive to changes in sulphuric acid concentration.
Of all the simulated days, 10 October showed the best agreement with the observations when considering J10, growth rate and the timing of the start of the event. During the last 2 days (14-15 October), both particle formation mechanisms gave similar results. The sulphuric acid concentration during these days was slightly elevated, and the modelled monoterpene and isoprene concentrations were the highest of the simulated period. In the evening of 14 October there was some rain, but at this point the observed concentrations were already lower. Throughout the last 2 days, the SO2 and CO concentrations (Figure 3 and Figure 4) were generally higher than during the first days, indicating that the air was more polluted at this time than during the first 4 days.
The difference in sulphuric acid concentration among the days leads to a greater difference in the simulated particle concentrations (Figure 7), indicating that sulphuric acid alone cannot be responsible for new particle formation, and the dependency on its concentration was weaker than assumed in the model. The kinetic nucleation approach particularly depends too strongly on sulphuric acid concentration (Table 2). This finding is in good agreement with observations at other sites.15 The organic nucleation approach gave J10 with a better agreement with the observed for all days except 8 October. When changing the approach for particle formation, the mechanism to grow particles in the model was the same. The difference in the growth rates between the simulations can be explained by the changes in coagulation and condensation when the number of particles in lower size bins changed. The high growth rate on 8 October was probably caused by the very high sulphuric acid concentration, and the above mean growth rate on 14 and 15 October by high concentrations of both sulphuric acid and the condensing organic vapours (Figure 6).
In our simulations we assigned the coefficient K in Equation 1 a value of 8 x 1018 cm3/s, which is lower than the values reported for other sites.15,37 For the organic-induced nucleation, P in Equation 2 was set to 1 x 105 cm3/s. To compare with other results, we calculated the coefficient

which varied from 3.8 x 10⁻¹³ cm3/s to 9.4 x 10⁻¹³ cm3/s with a mean value of 5.4 x 10⁻¹³ cm3/s. These values are at the low end of the distribution reported by Paasonen and co-workers38, but not out of range. Compared with other sites, the sulphuric acid concentration in Botsalano is higher, and the K and Korg have lower values, resulting in a nucleation rate that is similar to that reported from other sites.38 The air mass history analysis by Vakkari et al.18 for the same site indicated that the highest formation and growth rates were related to the highest VOC emissions, but not to the highest estimated sulphuric acid concentrations, which suggests that the dependency on sulphuric acid is not as strong as for some other sites.
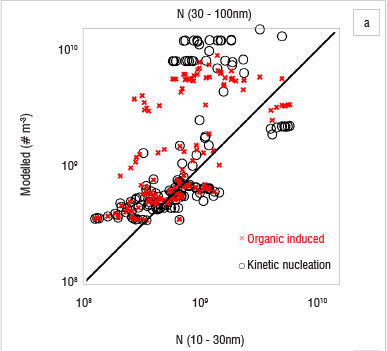
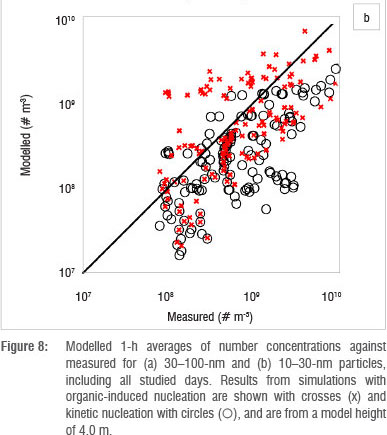
The use of a column model is based on the assumption that the area is homogeneous enough to exclude transport of particles by horizontal advection. Figure 7 shows that this requirement was not always fulfilled at Botsalano. Many of the differences between the observed and simulated particle concentrations can be explained by an air mass with different aerosol properties being advected at the site. This scenario is evident on 8 October and on the last 2 days studied (Figure 7), when the number concentration changed so rapidly that it cannot be explained by aerosol dynamic processes. The concentrations of Aitken mode particles are affected the most, because it takes time for the particles to grow. If the newly formed particles are not present at the site after some time, the modelled concentration is highly overestimated. Figure 8 shows modelled 1-h averages of number concentrations against measured concentrations for 10-30-nm and 30-100-nm particles. Results from simulations with organic-induced nucleation are shown with crosses (x) and kinetic nucleation with circles (O). The modelled number concentration of 30-100 nm was highly overestimated repeatedly by both nucleation mechanisms (Figure 8a). The modelled 10-30 nm number concentration by kinetic nucleation approach, on the other hand, shows a tendency to underestimate the concentration (Figure 8b). The organic-induced nucleation approach did not result in a similar tendency. The mechanism to grow particles was the same in all simulations, only the path to particle formation was changed. Figure 8 shows that the two nucleation approaches resulted in different 10-30-nm number concentrations, whereas the 30-100-nm concentrations were more alike. The similarity in the pattern for the 30-100-nm particle concentration, despite the difference in the smaller size range, indicates that advection indeed plays a key role and that the difference between the model and the measurements cannot be a consequence of error in the particle growth scheme alone. Figure 7 suggests that the heterogeneity of the region has the greatest effect during the afternoons and evenings. While advection was the main cause of the difference between observed and modelled particle concentrations, it is also likely that some variability was caused by the inaccuracy of the parameterisation for growth of the particles.
Conclusions
MALTE simulations of the dynamics of temperature and humidity in the savannah environment need improvement; the diurnal cycle of temperature was not strong enough. However, considering that exchange of water and energy between the atmosphere and the savannah ecosystem is not well understood,3 and that uncertainties originate from the boundary values, the model performance was satisfactory. The simulations showed a high level of stability and a shallow boundary layer during night-time, with significant effects on the concentrations of gases with sources within the canopy.
The sulphuric acid concentrations in the model were relatively high, but can be explained by the high level of "OH and SO2 concentrations. The SO2 concentration depended strongly on the origin of the air mass present at the site, and sudden changes took place repeatedly. The measured monoterpene and isoprene concentrations differed from the measurements by one to two orders of magnitude. The lack of ozone removal in the sampling was probably the main cause of this difference. Although the problems with the values can be discussed, the simulated diurnal variation was reasonable. The reaction products of isoprene, a-pinene and ß-pinene with •OH, O3 and NO3• provided possibly the highest uncertainties for our simulations on the formation and growth of particles.
One of the most important causes of differences between the modelled and measured particle number concentrations was advection. The site was quite heterogeneous with a high frequency of horizontal advection of either clean or polluted air masses, which make the use of a column model challenging. Organic-induced nucleation was better in reproducing observed particle formation and growth rates on all days except one (Table 2), as well as number concentration for 10-30-nm particles (Figure 8). The coefficients describing the nucleation processes, K and P were low compared with studies of other sites. Choosing a constant value for these coefficients proved not to be a valid approximation, and other variables for describing the nucleation process should be introduced.
The next step in developing this work further is to use the Model to Simulate the concentrations of Organic vapours and Sulphuric Acid (SOSA)47 to model particle formation at Welgegund, a station approximately 200 km southeast of Botsalano. The station has the same measurements as Botsalano, but also some additional observations that can be used for driving and validating the model conditions, such as sensible heat flux and soil humidity and temperature. A much more comprehensive VOC measurement campaign was also conducted at this site, during which time ozone removal was applied. SOSA is very similar to MALTE - both include the same modules (or versions of them) - but it is written in parallel so the computational time will not limit the work in the same way as it did in this study. Running longer time periods will give a better understanding on different conditions and the possibility to study, for example, seasonal variability.
Possible climate change and air quality related impacts in southern Africa could be significant. Therefore, continued modelling developments as presented in this paper to better understand and predict new particle formation for this unique environment are critical in mitigating possible negative impacts.
Acknowledgements
This work was supported by the Finnish Center of Excellence in Physics, Chemistry, Biology and Meteorology of Atmospheric Composition and Climate Change, Helsinki University Centre for Environment (HENVI). The CSC-IT Center for Science Ltd is gratefully acknowledged for computational resources.
Authors' contributions
R.G. performed the simulations, analysed the data and wrote most of the manuscript. D.M. provided the chemistry module and wrote the parts concerning chemistry. L.L. was in charge of the project, did the actual VOC sampling in Botsalano, cleaned all the data together with V.V. and contributed to the writing of the manuscript. V.V. also contributed to the writing of the manuscript. J.PB. and PG.v.Z. aided in contextualising the results within a South African context and made some conceptual contributions. H.H. arranged the VOC sampling equipment and VOC analysis and contributed to the writing of the manuscript. A.G. developed the model for emissions from the canopy and contributed to the writing of the manuscript. J.J.P made conceptual contributions. M.B. supervised the modelling work and supported the writing process.
References
1. Scholes RJ, Hall DO. The carbon budget of tropical savannas, woodlands and grasslands. In: Breymeyer AI, Hall DO, Melillo JM, Agren GI, editors. Global change: Effects on coniferous forests and grasslands. Chichester: John Wiley and Sons; 1996. p. 69-100. [ Links ]
2. Land use, land-use change, and forestry. Intergovernmental Panel on Climate Change special report. Cambridge: Cambridge University Press; 2000.
3. Grote R, Lehmann E, Brummer C, Brüggemann N, Szarzynski J, Kunstmann H. Modelling and observation of biosphere-atmosphere interactions in natural savannah in Burkina Faso, West Africa. Phys Chem Earth. 2009;34:251-260. http://dx.doi.org/10.1016/j.pce.2008.05.003 [ Links ]
4. Spracklen DV, Carslaw KS, Kulmala M, Kerminen V-M, Sihto S-L, Riipinen I, et al. Contribution of particle formation to global cloud condensation nuclei concentrations. Geophys Res Lett. 2008;35,L06808. [ Links ]
5. Merikanto J, Spracklen DV, Mann GW, Pickering SJ, Carslaw KS. Impact of nucleation on global CCN. Atmos Chem Phys. 2009;9:8601-8616. http://dx.doi.org/10.5194/acp-9-8601-2009
6. Kerminen V-M, Paramonov M, Anttila T, Riipinen I, Fountoukis C, Korhonen H, et al. Cloud condensation nuclei production associated with atmospheric nucleation: A synthesis based on existing literature and new results. Atmos Chem Phys. 2012;12:12037-12059. http://dx.doi.org/10.5194/acp-12-12037-2012
7. Yu F, Luo G. Simulation of particle size distribution with a global aerosol model: Contribution of nucleation to aerosol and CCN number concentrations. Atmos Chem Phys. 2009;9:7691-7710. http://dx.doi.org/10.5194/acp-11-1083-2011
8. Yu F. A secondary organic aerosol formation model considering successive oxidation aging and kinetic condensation of organic compounds: global scale implications. Atmos Chem Phys. 2011;11:1083-1099. http://dx.doi.org/10.5194/acp-11-1083-2011
9. UNEP and C4. Asian Brown Cloud: Climate and other environmental impacts. Nairobi: UNEP; 2002.
10. Laakso L, Laakso H, Aalto PP Keronen P Petäjä T, Nieminen T, et al. Basic characteristics of atmospheric particles, trace gases and meteorology in a relatively clean southern African savannah environment. Atmos Chem Phys. 2008;8:4823-4839. http://dx.doi.org/10.5194/acp-12-4449-2012
11. Mann GW, Carslaw KS, Ridley DA, Spracklen DV Pringle KJ, Merikanto J, et al. Intercomparison of modal and sectional aerosol microphysics representations within the same 3-D global chemical transport model. Atmos Chem Phys. 2012;12:4449-1476. http://dx.doi.org/10.5194/acp-12-4449-2012
12. Laakso L, Merikanto J, Vakkari V Laakso H, Kulmala M, Molefe M, et al. Boundary layer nucleation as a source of new CCN in savannah environment. Atmos Chem Phys Discuss. 2012;12:8503-8531. http://dx.doi.org/10.5194/acpd-12-8503-2012
13. Petäjä T, Vakkari V Pohja T, Nieminen T, Laakso H, Aalto PP et al. Transportable aerosol characterization trailer with trace gas chemistry: Design, instruments and verification. Aerosol Air Qual Res. 2013;13:421-135.
14. Boy M, Hellmuth O, Korhonen H, Nilsson ED, ReVelle D, Turnipseed A, et al. MALTE - Model to predict new aerosol formation in the lower troposphere. Atmos Chem Phys Discuss. 2006;6:3465-3512. http://dx.doi.org/10.5194/acpd-6-3465-2006
15. Lauros J, Sogachev A, Smolander S, Vuollekoski H, Sihto S-L, Laakso L, et al. Particle concentration and flux dynamics in the atmospheric boundary layer as the indicator of formation mechanism. Atmos Chem Phys. 2011;11:5591-5601. http://dx.doi.org/10.5194/acp-11-5591-2011
16. Venter AD, Vakkari V Beukes JP Van Zyl PG, Laakso H, Mabaso D, et al. An air quality assessment in the industrialised western Bushveld Igneous Complex, South Africa. S Afr J Sci. 2012;108(9/10), Art. #1059, 10 pages. http://dx.doi.org/10.4102/sajs.v108i9/10.1059 [ Links ]
17. Lourens A, Butler T, Beukes JP, Van Zyl PG, Beirle S, Wagner TK, et al. Re-evaluating the NO2 hotspot over the South African Highveld. S Afr J Sci. 2012;108(11/12), Art. #1146, 6 pages. http://dx.doi.org/10.4102/sajs.v108i11/12.1146 [ Links ]
18. Vakkari V Laakso H, Kulmala M, Laaksonen A, Mabaso D, Molefe M, et al. New particle formation events in semi-clean South African savannah. Atmos Chem Phys. 2011;11(7):3333-3346. http://dx.doi.org/10.5194/acp-11-3333-2011
19. Vakkari V Beukes JP Laakso H, Mabaso D, Pienaar JJ, Kulmala M, et al. Long-term observations of aerosol size distributions in semi-clean and polluted savannah in South Africa. Atmos Chem Phys. 2013;13:1751-1770. http://dx.doi.org/10.5194/acp-13-1751-2013
20. Tyson PD, Garstang M, Swap R. Large-scale recirculation of air over southern Africa. J Appl Meteorol. 1996;35:2218-2236. http://dx.doi.org/10.1175/1520-0450(1996)035<2218:LSROAO>2.0.CO;2
21. Swap RJ, Annegarn HJ, Suttles JT, King MD, Platnick S, Privette JL, et al. Africa burning: A thematic analysis of the Southern African Regional Science Initiative (SAFARI 2000). J Geophys Res. 2003;108:8465. http://dx.doi.org/10.1029/2003JD003747
22. Sogachev A, Menzhulin G, Heimann M, Lloyd J. A simple three-dimensional canopy - planetary boundary layer simulation model for scalar concentrations and fluxes. Tellus. 2002;54B:784-819.
23. Sogachev A, Panferov O. Modification of two-equation models to account for plant drag. Bound-Lay Meteorol. 2006;121:229-266. http://dx.doi.org/10.1007/s10546-006-9073-5
24. Sogachev A. A note on two-equation closure modelling of canopy flow. Bound-Lay Meteorol. 2009;130:423-435. http://dx.doi.org/10.1007/s10546-008-9346-2
25. Guenther A, Otter L, Zimmermann P Greenberg J, Scholes R, Scholes M. Biogenic hydrocarbon emissions from southern African savannas. J Geophys Res. 1996;101:25859-25865. http://dx.doi.org/10.1029/96JD02597
26. Otter L, Guenther A, Wiedinmyer C, Fleming G, Harley P Greenberg J. Spatial and temporal variations in biogenic volatile organic compound emissions for Africa south of the equator. J Geophys Res. 2003;108(D13):8505. [ Links ]
27. Greenberg J, Guenther A, Harley P. Eddy flux and leaf-level measurements of biogenic VOC emissions from Mopane woodland of Botswana. J Geophys Res. 2003;108(D13):8466.
28. Harley P Otter L, Guenther A, Greenberg J. Micrometeorological and leaf-level measurements of isoprene emissions from a southern African savanna. J Geophys Res. 2003;108(D13):8468.
29. Guenther A, Zimmerman P Wildermuth M. Natural volatile organic compound emission rate estimates for United States woodland landscapes. Atmos Environ. 1994;28(6):1197-1210. http://dx.doi.org/10.1016/1352-2310(94)90297-6
30. Guenther A, Karl T, Harley P Wiedinmyer C, Palmer PI, Geron C. Estimates of global terrestrial isoprene emissions using MEGAN (Model of Emissions of Gases and Aerosols from Nature). Atmos Chem Phys. 2006;6:3181-3210. http://dx.doi.org/10.5194/acp-6-3181-2006
31. Guenther AB, Jiang X, Heald CL, Sakulyanontvittaya T, Duhl T, Emmons LK, et al. The Model of Emissions of Gases and Aerosols from Nature version 2.1 (MEGAN2.1): An extended and updated framework for modeling biogenic emissions. Geosci Model Dev. 2012;5(6):1471-1492. http://dx.doi.org/10.5194/gmd-5-1471-2012
32. Damian V Sandu A, Damian M, Potra F, Carmichael GR. The Kinetic PreProcessor KPP - A software environment for solving chemical kinetics. Comput Chem Eng. 2002;26:1567-1579. http://dx.doi.org/10.1016/S0098-1354(02)00128-X
33. Jenkin ME, Saunders SM, Pilling MJ. The tropospheric degradation of volatile organic compounds: A protocol for mechanism development. Atmos Environ. 1997;31:81-104. http://dx.doi.org/10.1016/S1352-2310(96)00105-7
34. Saunders SM, Jenkin ME, Derwent RG, Pilling MJ. Protocol for the development of the Master Chemical Mechanism, MCM v3 (Part A): Tropospheric degradation of non-aromatic volatile organic compounds. Atmos Chem Phys. 2003;3:161-180. http://dx.doi.org/10.5194/acp-3-161-2003
35. Korhonen H, Lehtinen KEJ, Kulmala M. Multicomponent aerosol dynamics model UHMA: Model development and validation. Atmos Chem Phys. 2004;4:757-771. http://dx.doi.org/10.5194/acp-4-757-2004
36. McMurry P Friedlander S. New particle formation in the presence of an aerosol. Atmos Environ. 1979;13:1635-1651. http://dx.doi.org/10.1016/0004-6981(79)90322-6
37. Kulmala M, Kerminen V-M. On the growth of atmospheric nanoparticles. Atmos Res. 2008;90:132-150. http://dx.doi.org/10.1016/j.atmosres.2008.01.005
38. Paasonen P Nieminen T, Asmi E, Manninen HE, Petäjä T, Plass-Dülmer P et al. On the roles of sulphuric acid and low-volatility organic vapours in the initial steps of atmospheric new particle formation. Atmos Chem Phys. 2010;10:11223-11242. http://dx.doi.org/10.5194/acp-10-11223-2010
39. Kulmala M, Kerminen V-M, Anttila T, Laaksonen A, O'Dowd CD. Organic aerosol formation via sulphate cluster activation. J Geophys Res. 2004;4, Art. 04205. [ Links ]
40. Dee DP Uppala SM, Simmons AJ, Berrisford P Poli P Kobayashi S, et al. The ERA-Interim reanalysis: Configuration and performance of the data assimilation system. Q J Roy Meteor Soc. 2011;137:553-597. http://dx.doi.org/10.1002/qj.828 [ Links ]
41. Troen IB, Mahrt L. A simple model of the atmospheric boundary layer; sensitivity to surface evaporation. Bound-Lay Meteorol. 1986;37:129-148.
42. Petäjä T, Mauldin III RL, Kosciuch E, McGrath J, Nieminen T, Paasonen P et al. Sulfuric acid and OH concentrations in a boreal forest site. Atmos Chem Phys. 2009;9:7435-7448. http://dx.doi.org/10.5194/acp-9-7435-2009 [ Links ]
43. Boy M, Kulmala M, Ruuskanen TM, Pihlatie M, Reissell A, Aalto PP et al. Sulphuric acid closure and contribution to nucleation mode particle growth. Atmos Chem Phys. 2005;5:863-878. http://dx.doi.org/10.5194/acp-5-863-2005
44. Mogensen D, Smolander S, Sogachev A, Zhou L, Sinha V, Guenther A, et al. Modelling atmospheric OH-reactivity in a boreal forest ecosystem. Atmos Chem Phys. 2011;11:9709-9719. http://dx.doi.org/10.5194/acp-11-9709-2011 [ Links ]
45. Jaars K. Temporal assessment of volatile organic compounds at a site with high atmospheric variability in the North-West Province [MSc thesis]. Potchefstroom: North-West University; 2013.
46. Hellén H, Kuronen P Hakola H. Heated stainless steel tube for ozone removal in the ambient air measurements of mono- and sesquiterpenes. Atmos Environ. 2012;57:35-10. http://dx.doi.org/10.1016/j.atmosenv.2012.04.019 [ Links ]
47. Boy M, Sogachev A, Lauros J, Zhou L, Guenther A, Smolander S. SOSA - A new model to simulate the concentrations of organic vapours and sulphuric acid inside the ABL - Part I: Model description and initial evaluation. Atmos Chem Phys. 2011;11:43-51. http://dx.doi.org/10.5194/acp-11-43-2011 [ Links ]
 Correspondence:
Rosa Gierens
Department of Physics, Helsinki University
PO Box 48, Helsinki 00014, Finland
rosa.gierens@helsinki.fi
Received: 15 Apr. 2013
Revised: 14 Oct. 2013
Accepted: 30 Oct. 2013

